The information in this brief is intended only to provide educational information.
This brief summarizes a CHOICES Learning Collaborative Partnership model examining a strategy to improve access to drinking water in schools in Massachusetts. This strategy involves the installation of touchless chilled water dispensers on or near school cafeteria lunch lines in K-8 public schools with adequate plumbing.
The Issue
All students should have access to safe, clean, and appealing drinking water, no matter where they go to school. Yet, nearly half of K-8 public schools in Massachusetts have identified elevated concentrations of lead in their drinking water and need to improve their drinking water infrastructure.1
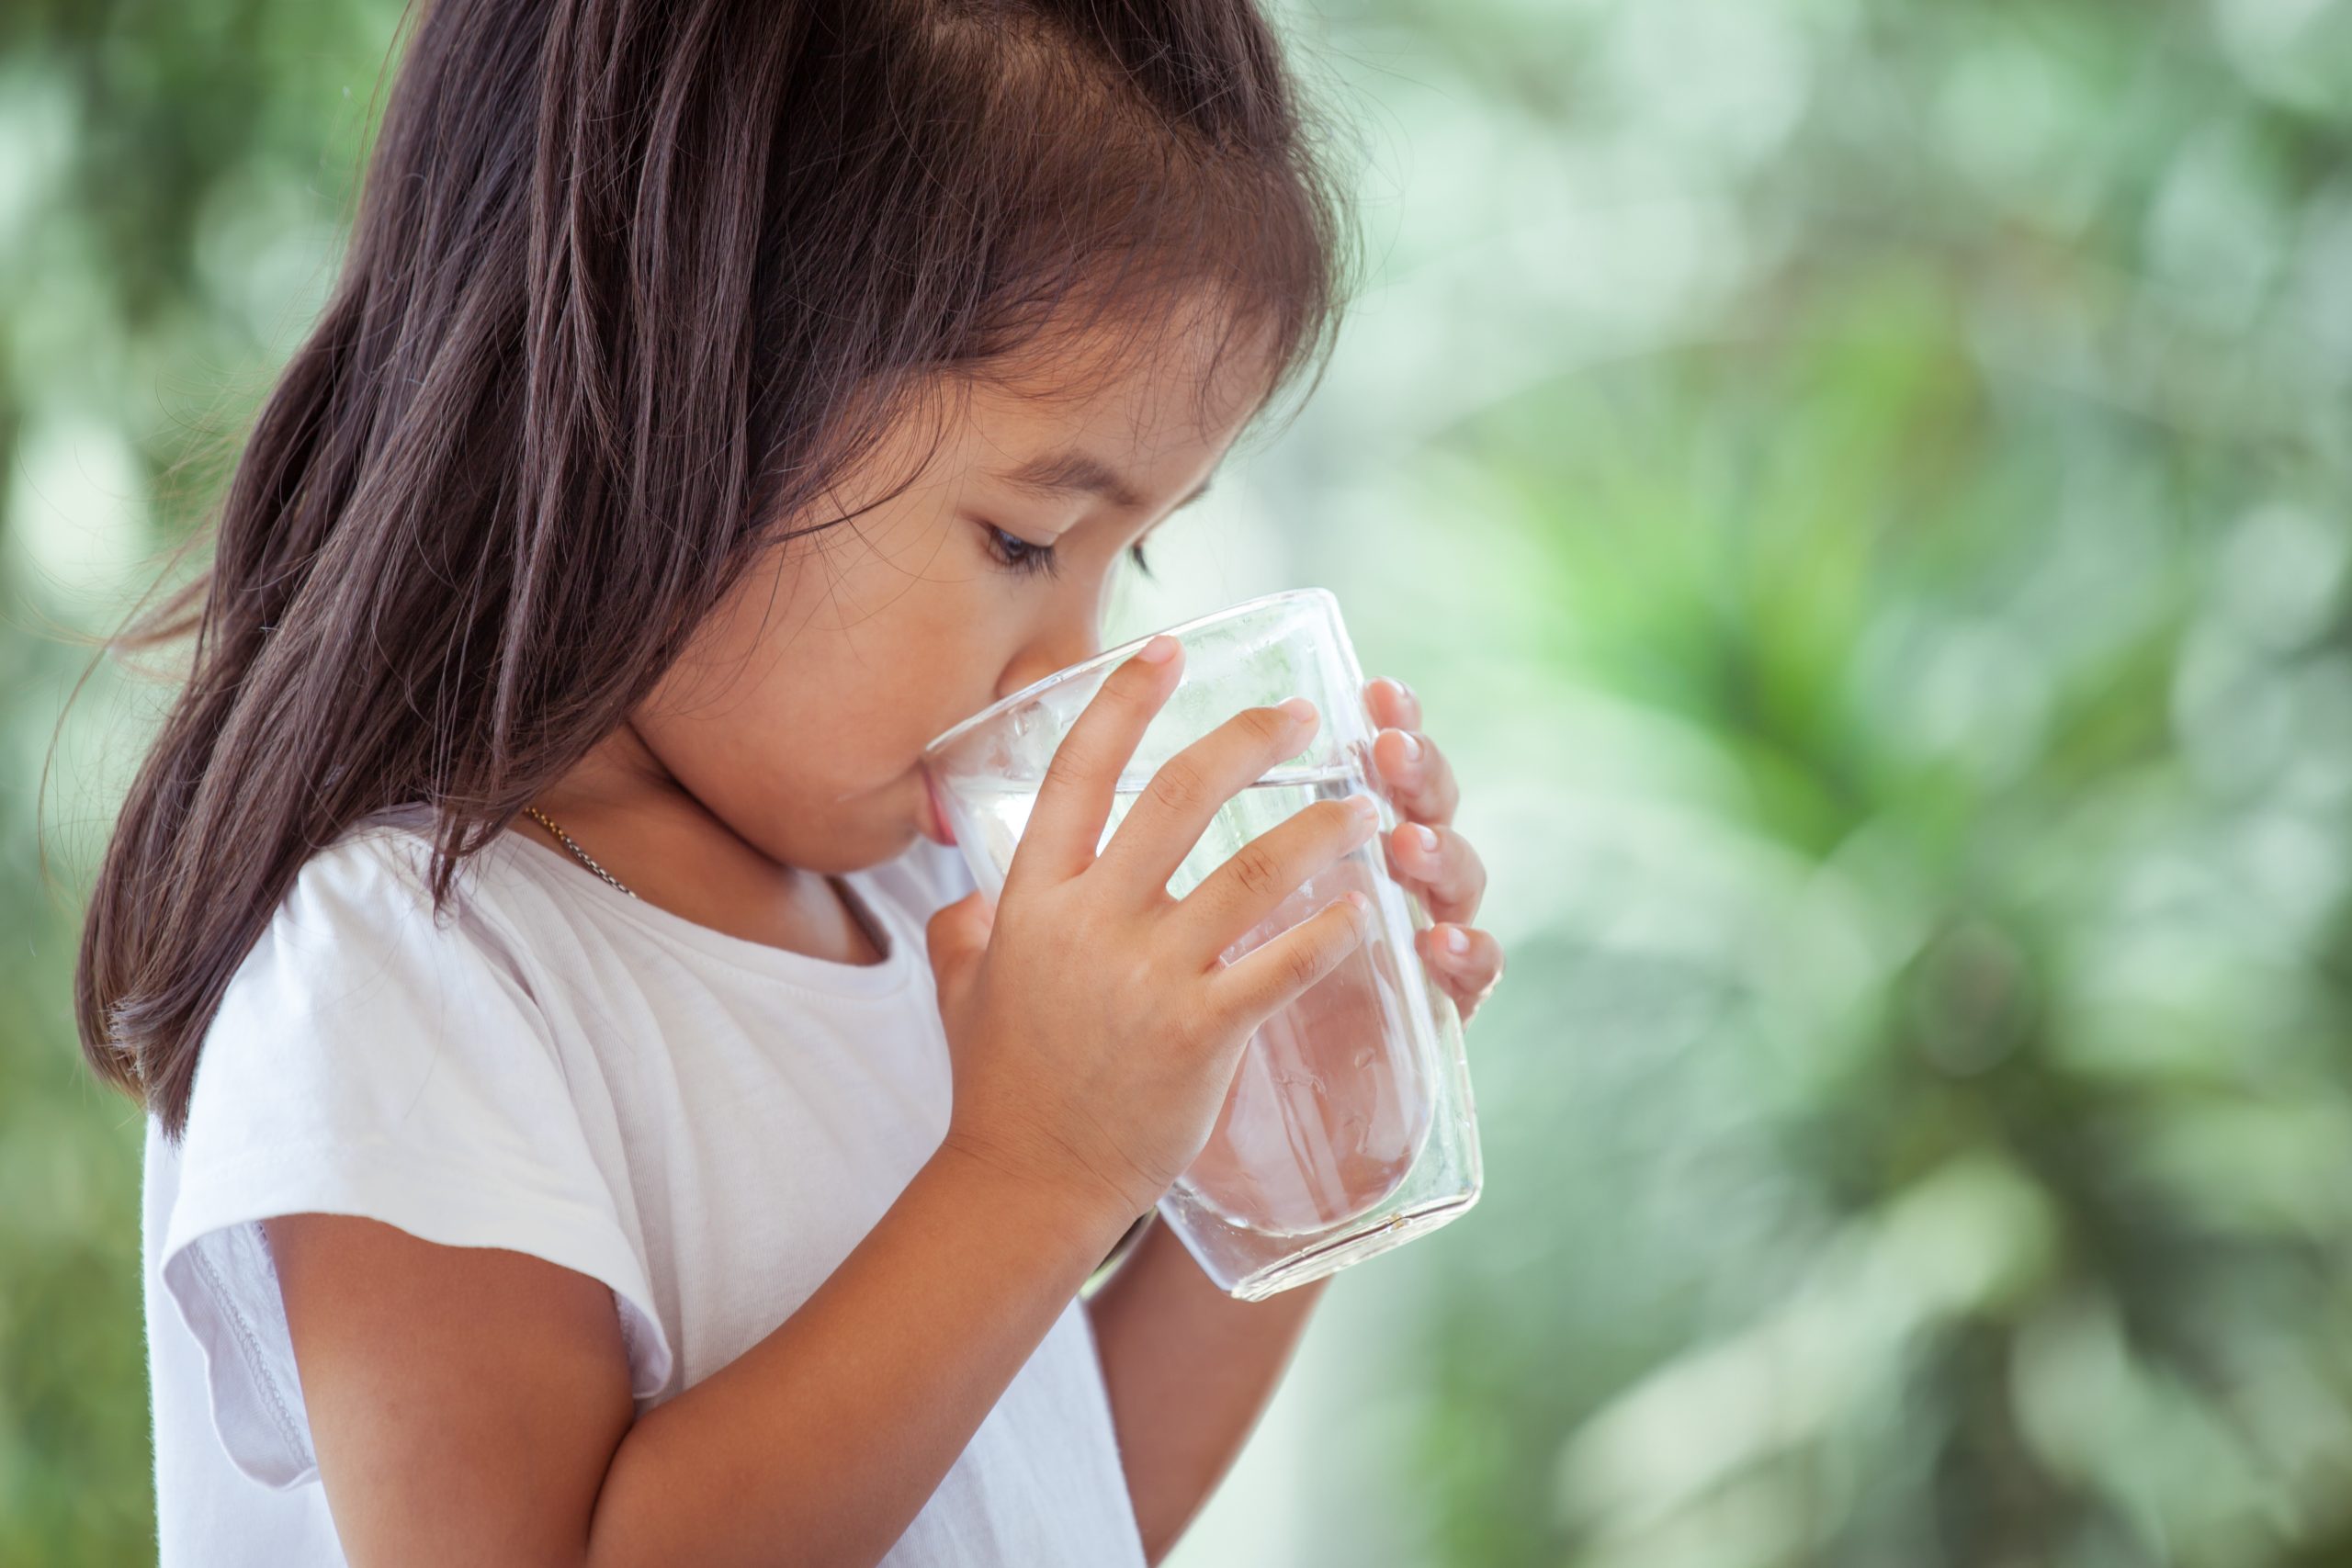
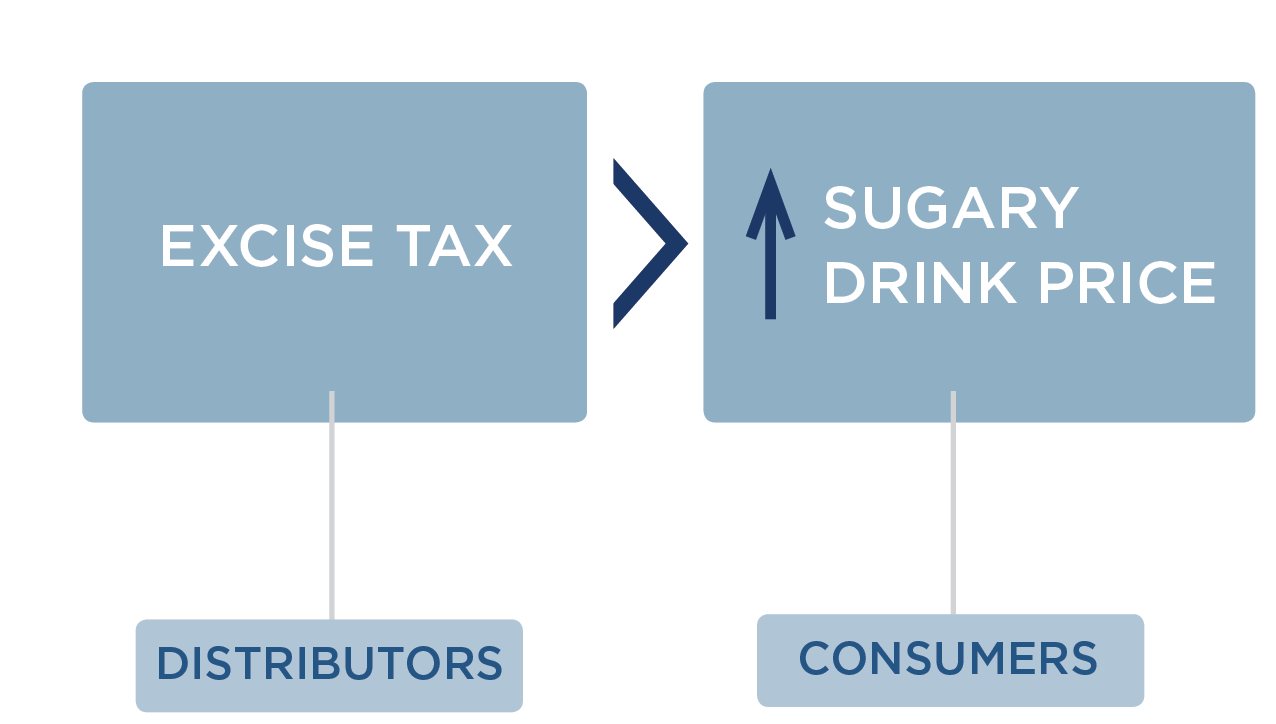
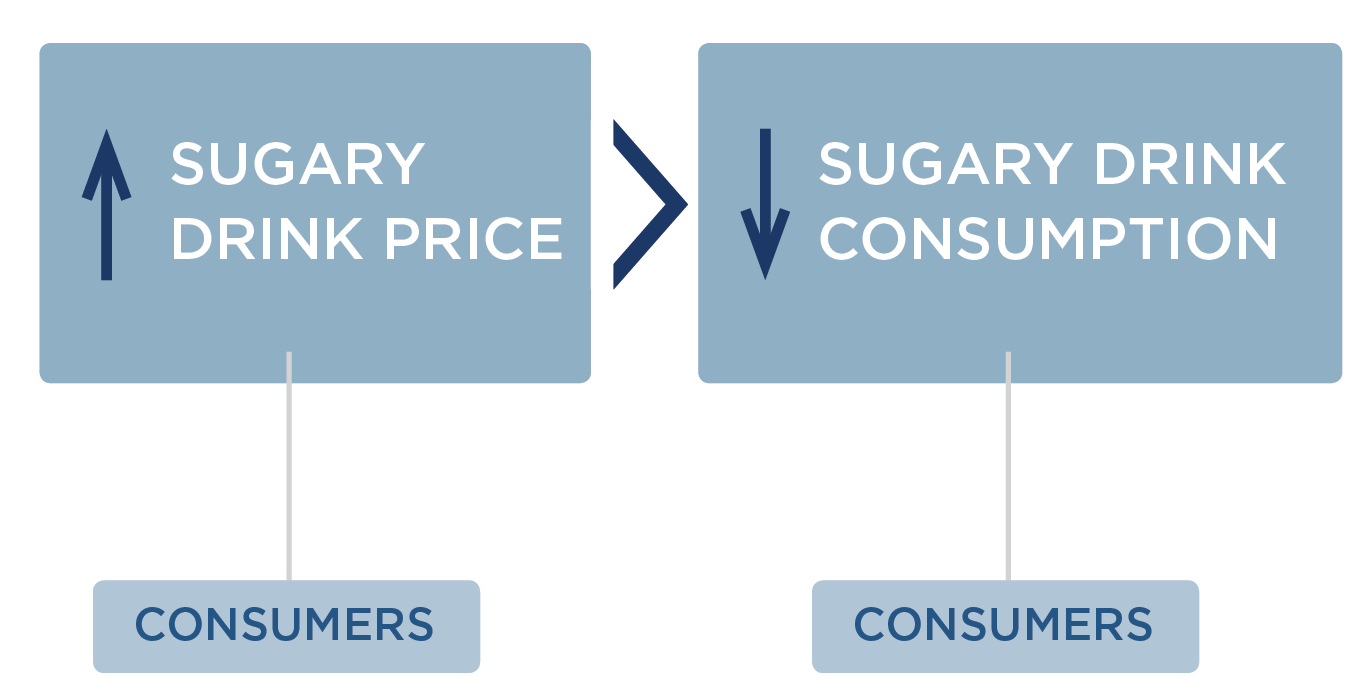
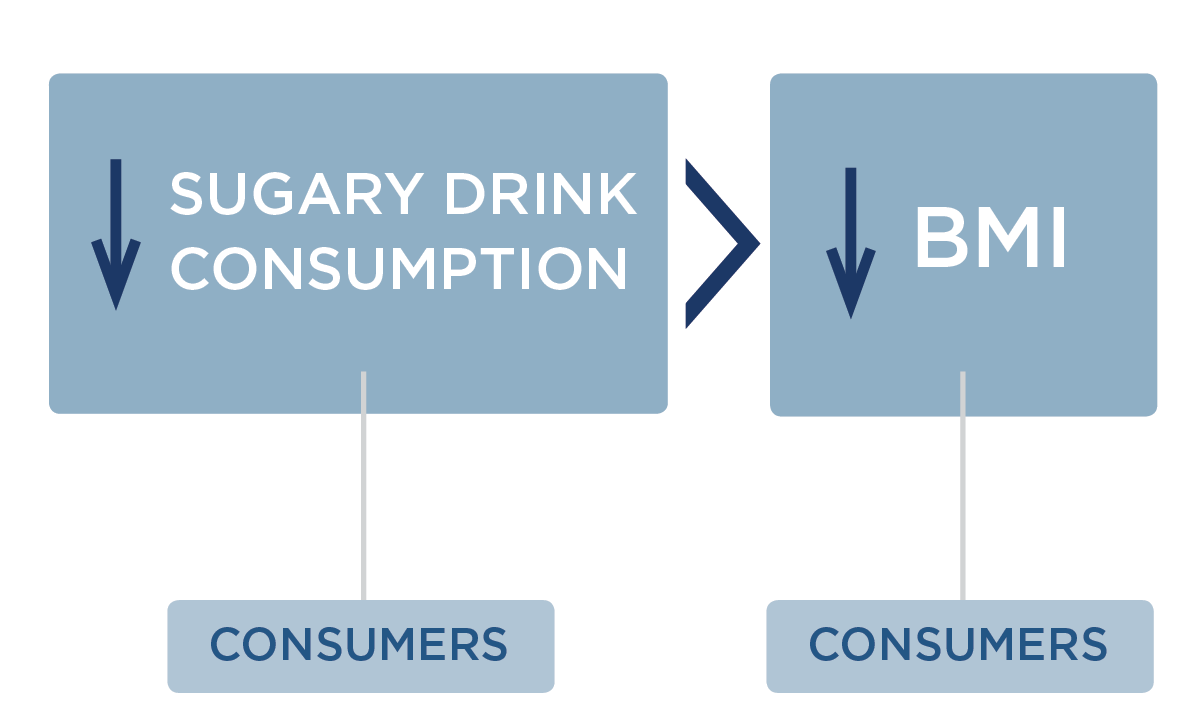
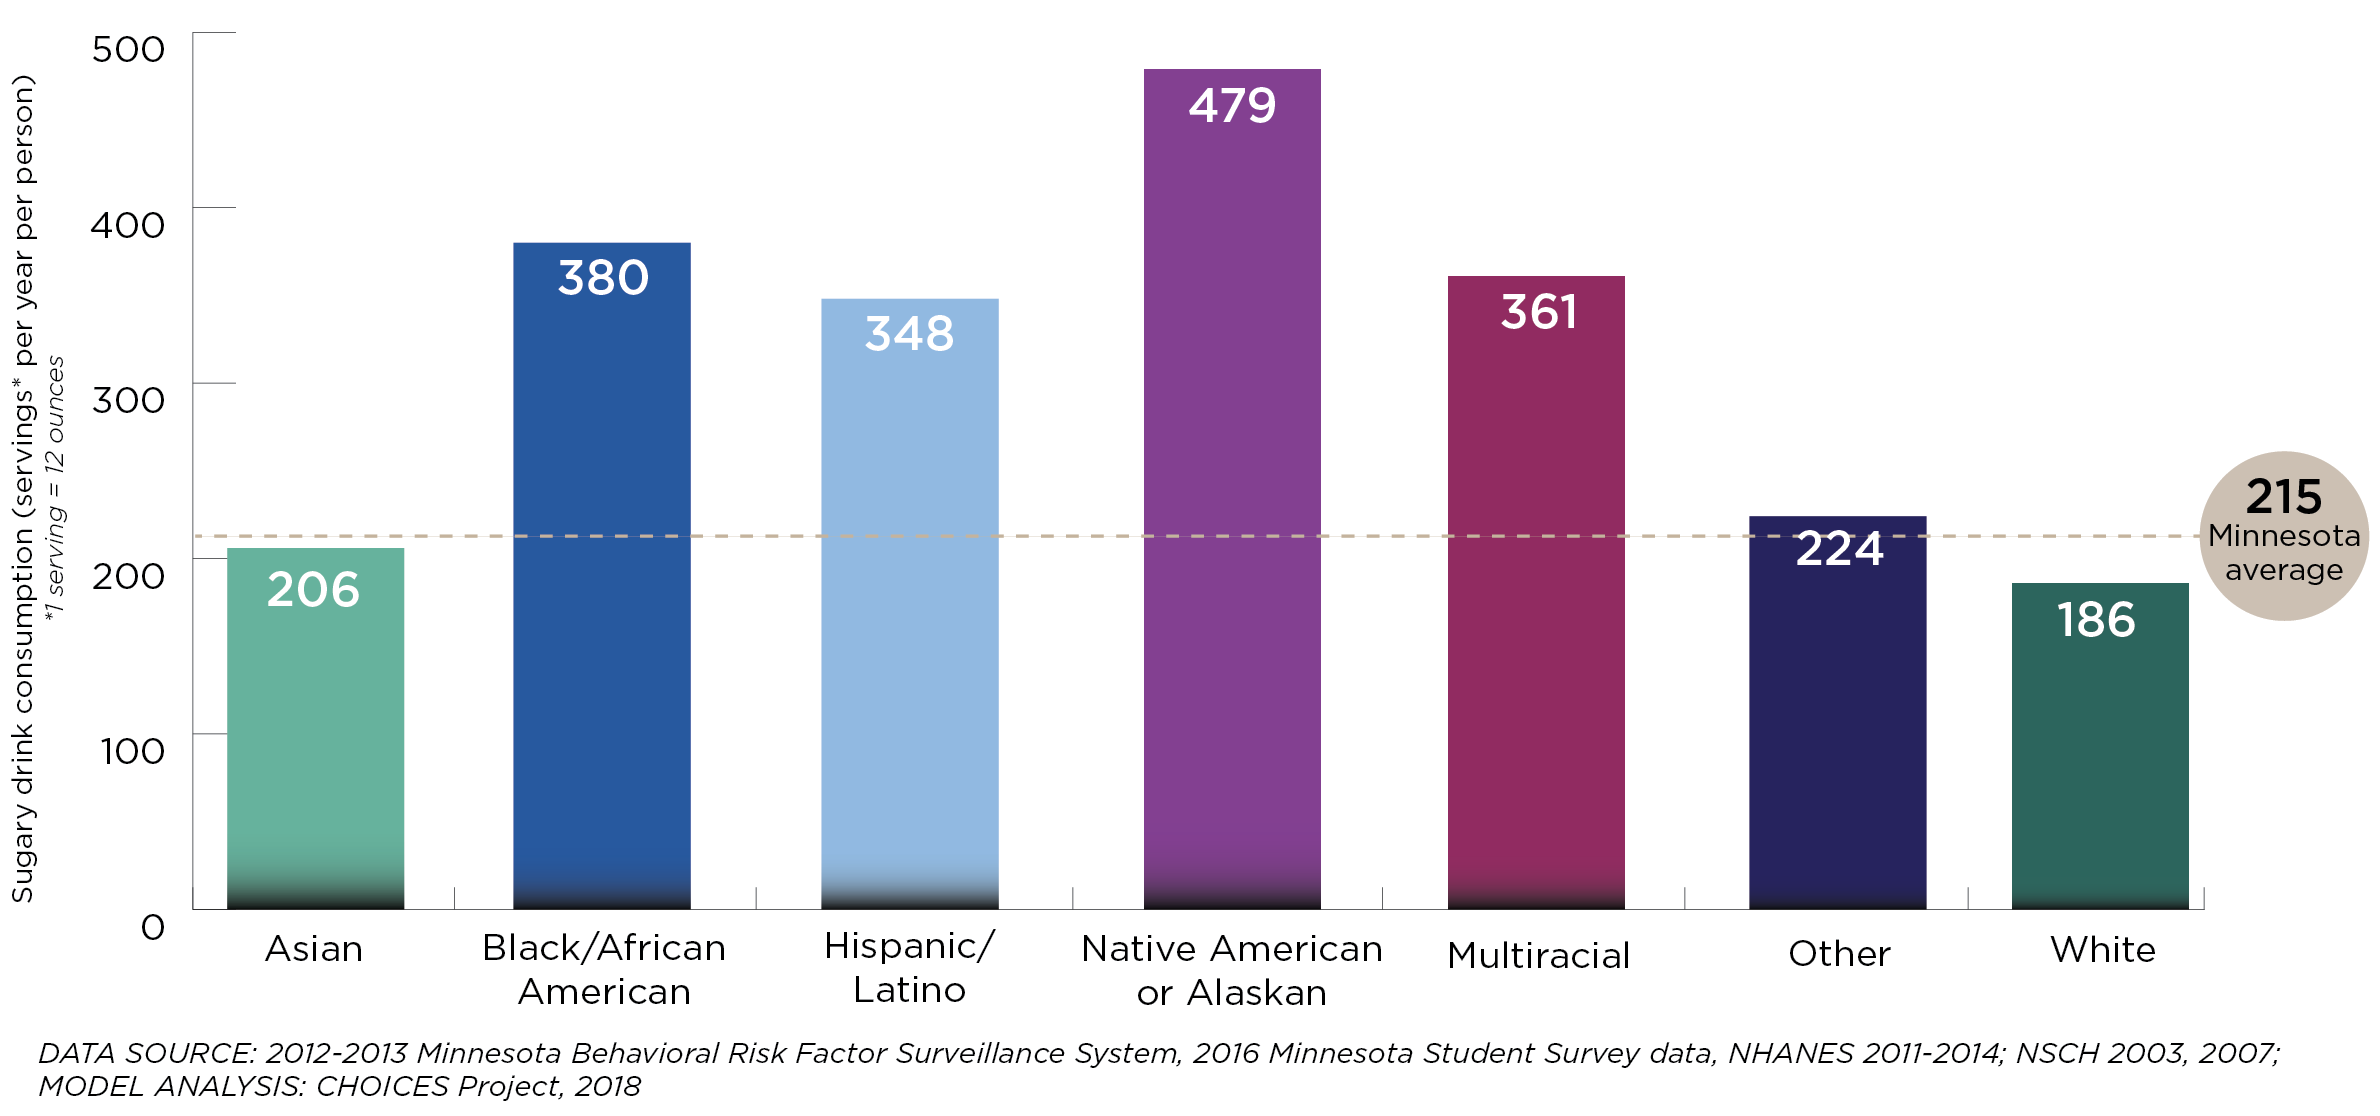
Providing access to appealing drinking water gives students a healthier alternative to sugary drinks, like sweetened fruit drinks, sports drinks, and soda. In 2021, most adolescents in Massachusetts reported consuming sugary drinks,2 which has been linked to excess weight gain, type 2 diabetes, and heart disease.3,4 Students drink more water when schools provide access to water at lunch at no charge,5 and improving school water access may help kids grow up at a healthy weight.6,7 Creating a healthy, equitable school environment with appealing drinking water access can help set children up for a healthy future.
About the Water Dispensers in Schools Strategy
This strategy applied an equity lens to increasing water access by installing touchless water dispensers on or near school cafeteria lunch lines in K-8 Massachusetts public schools with identified needs. Priority schools would be those with elevated concentrations of lead in drinking water documented via state lead testing programs1 and located in cities and towns with Environmental Justice designation based on the community’s share of households with lower incomes, limited English proficiency, or individuals identifying as Black, Indigenous, or people of color.8 Better drinking water access in schools has been shown to increase water intake and may help promote a healthy weight.6 The Massachusetts Departments of Public Health and Elementary and Secondary Education would provide outreach to school districts to encourage the installation of water dispensers through existing relationships. Putting this strategy into place would require resources for administering the program, installing and maintaining dispensers, utility costs, disposable cup provision, and lead testing and remediation.
Comparing Costs and Outcomes
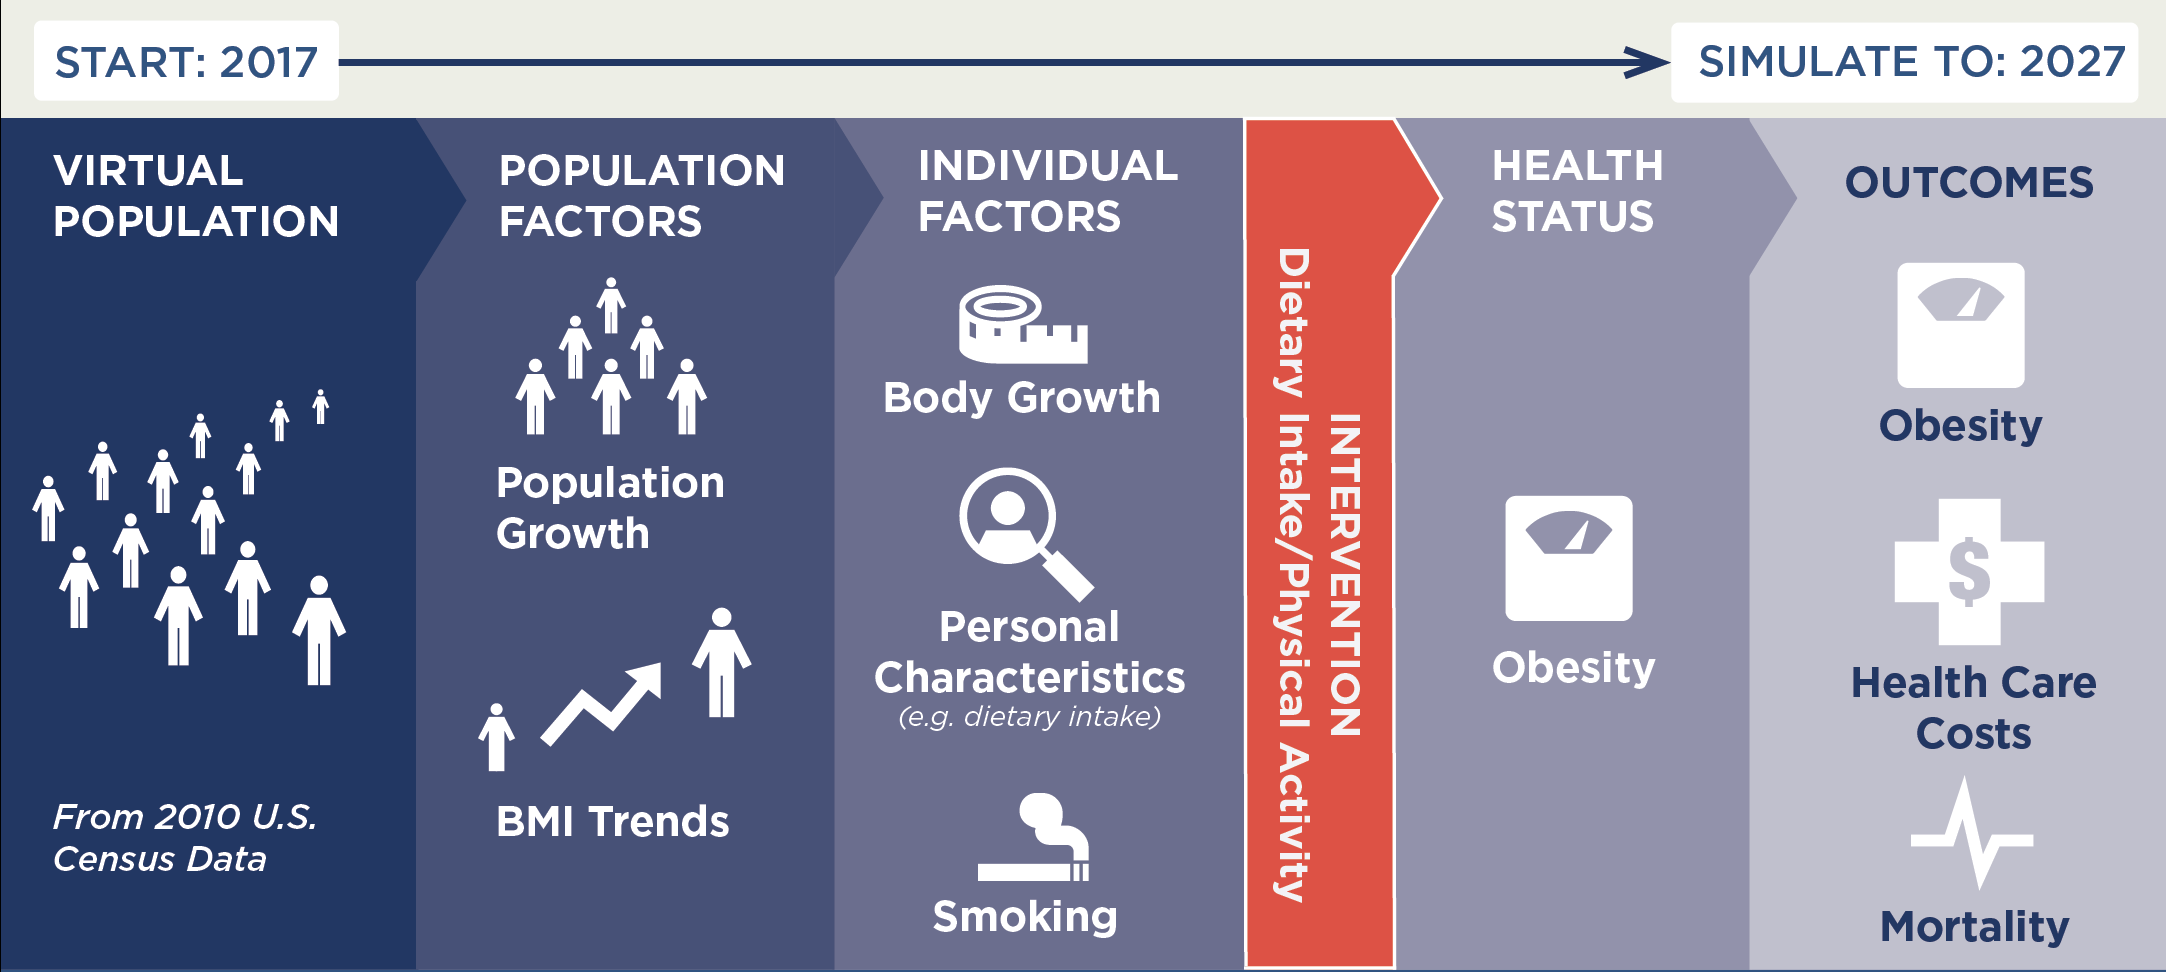
A CHOICES cost-effectiveness analysis compared the costs and outcomes of installing touchless water dispensers in schools with the costs and outcomes associated with not implementing the voluntary water equity and access program over 10 years (2020-2029).
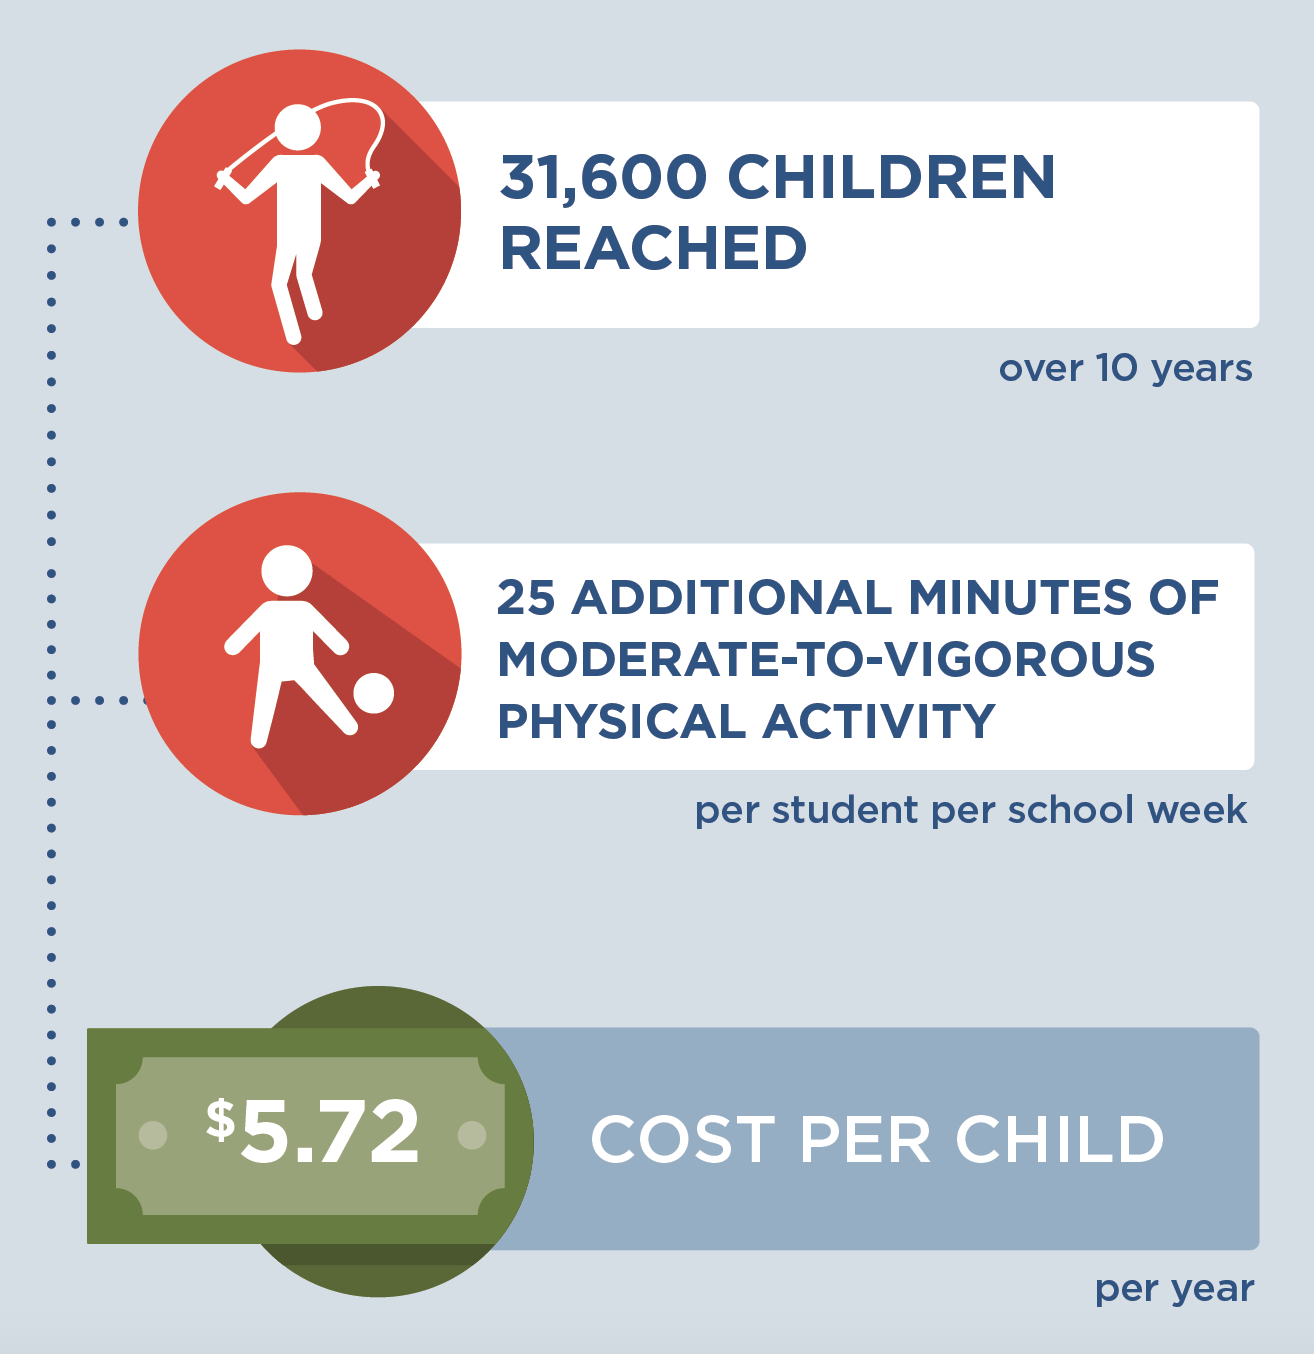
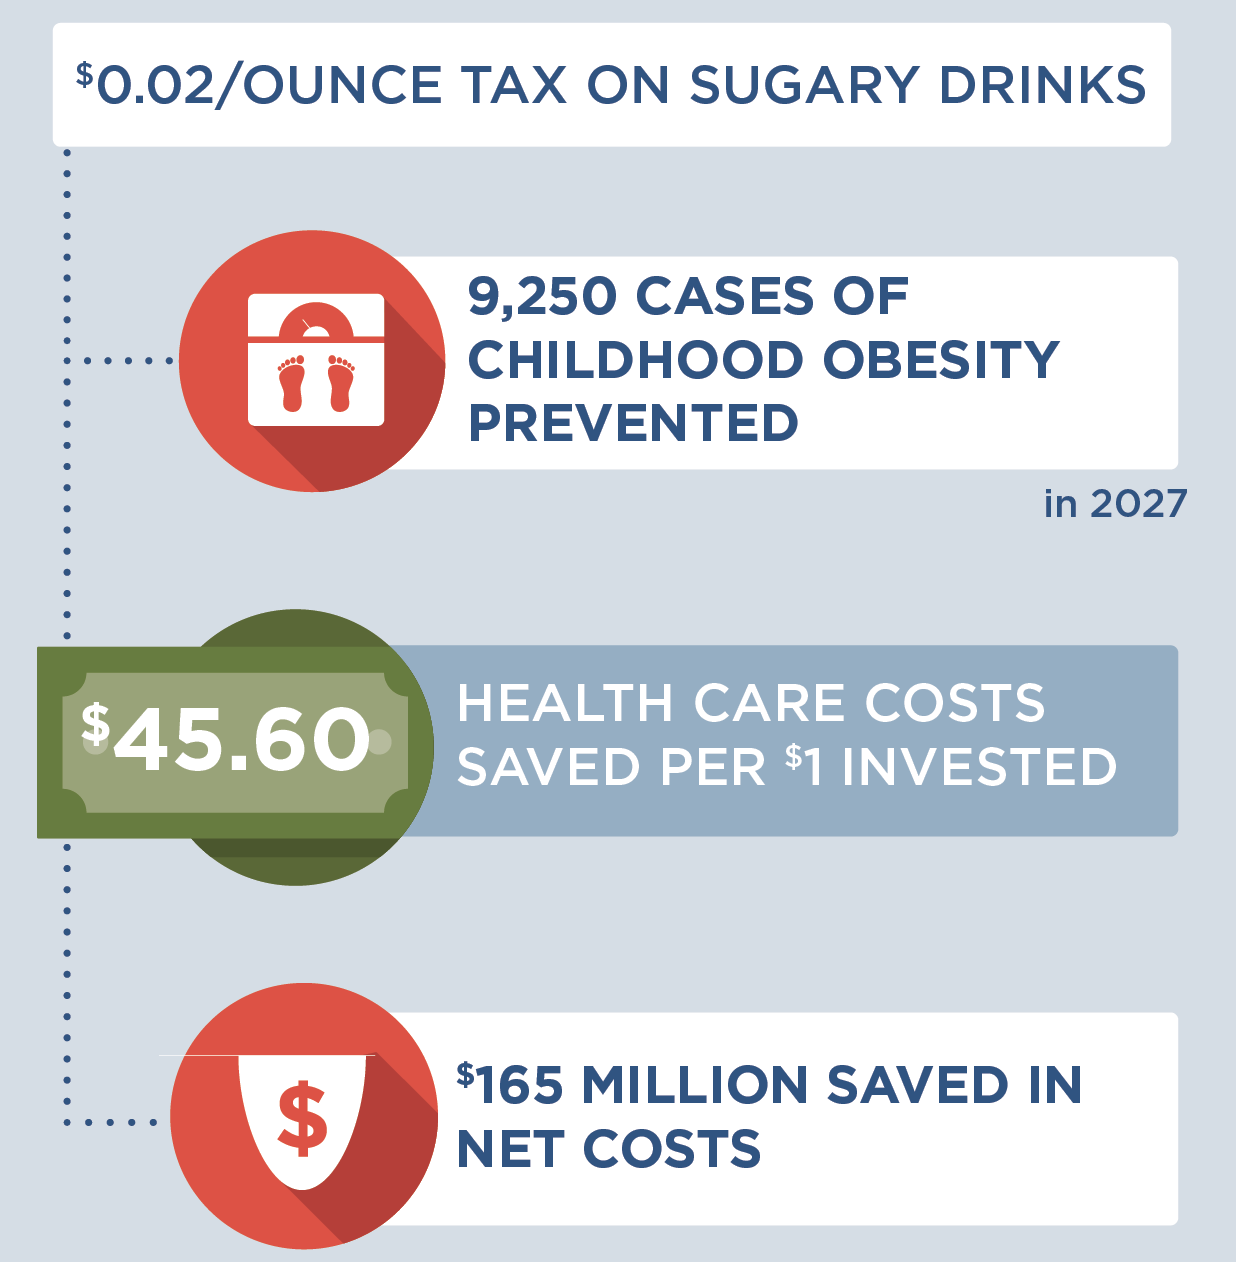
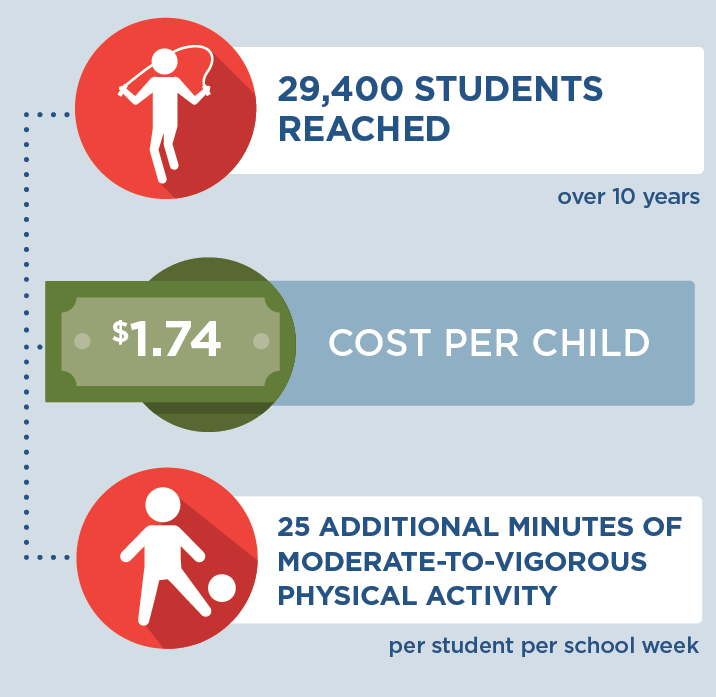
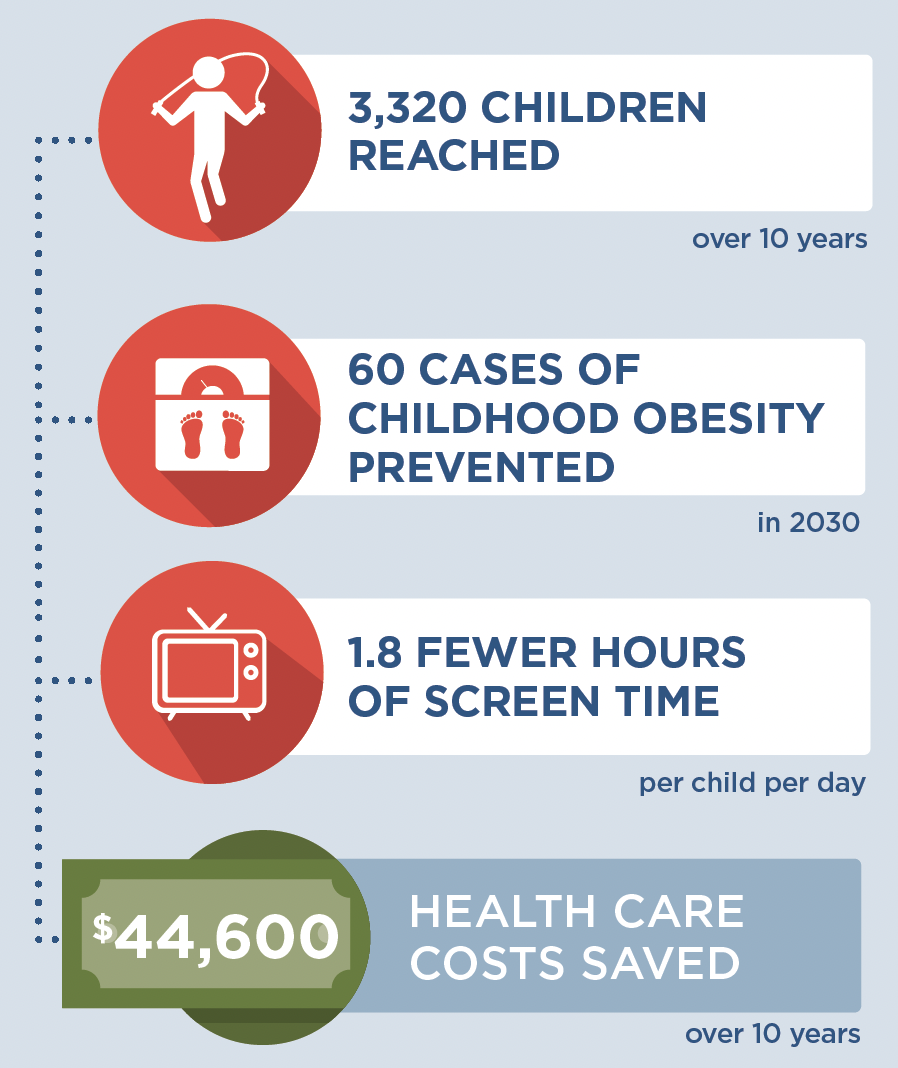
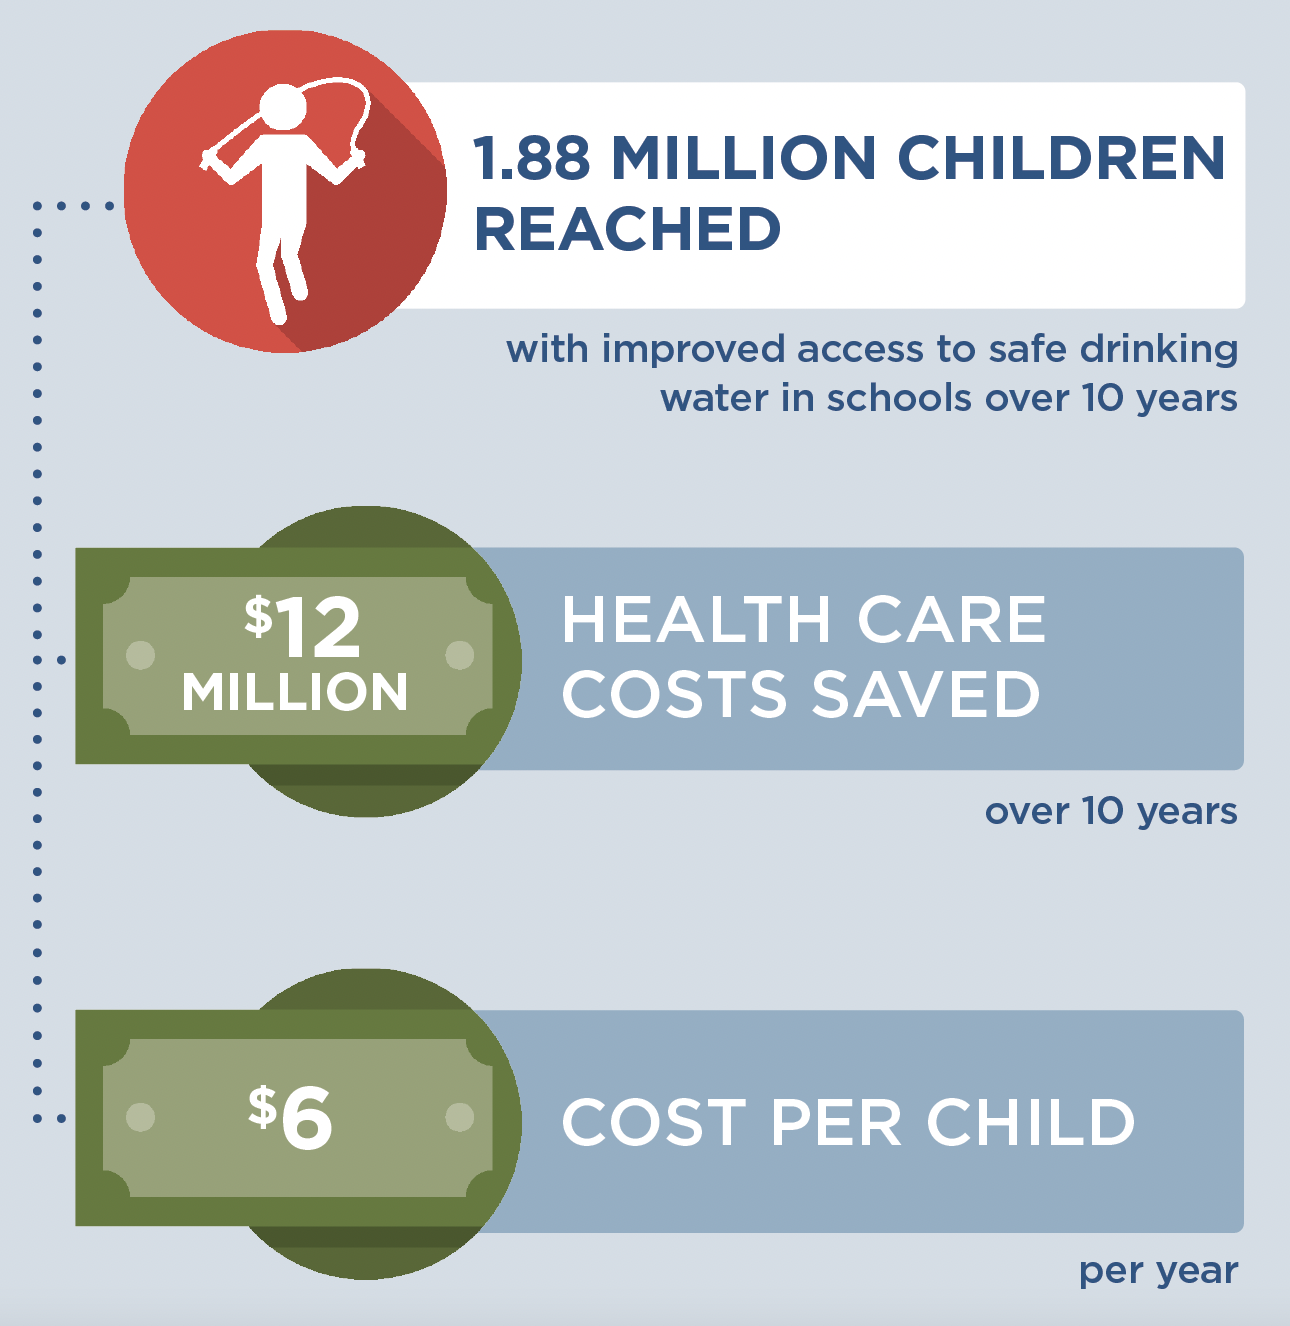
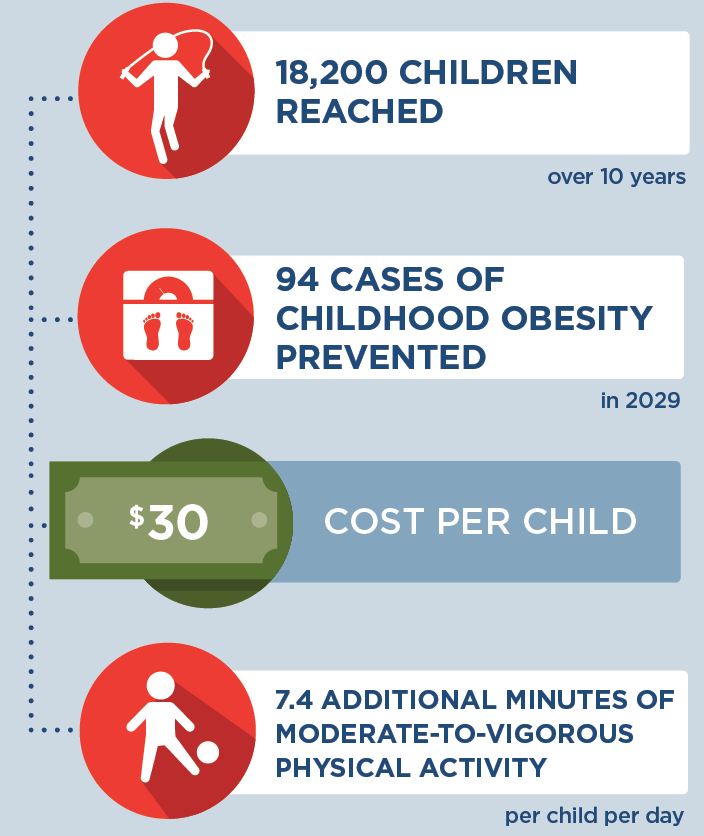
The installation of touchless water dispensers in schools in Massachusetts is an investment in a more equitable future. By the end of 2029: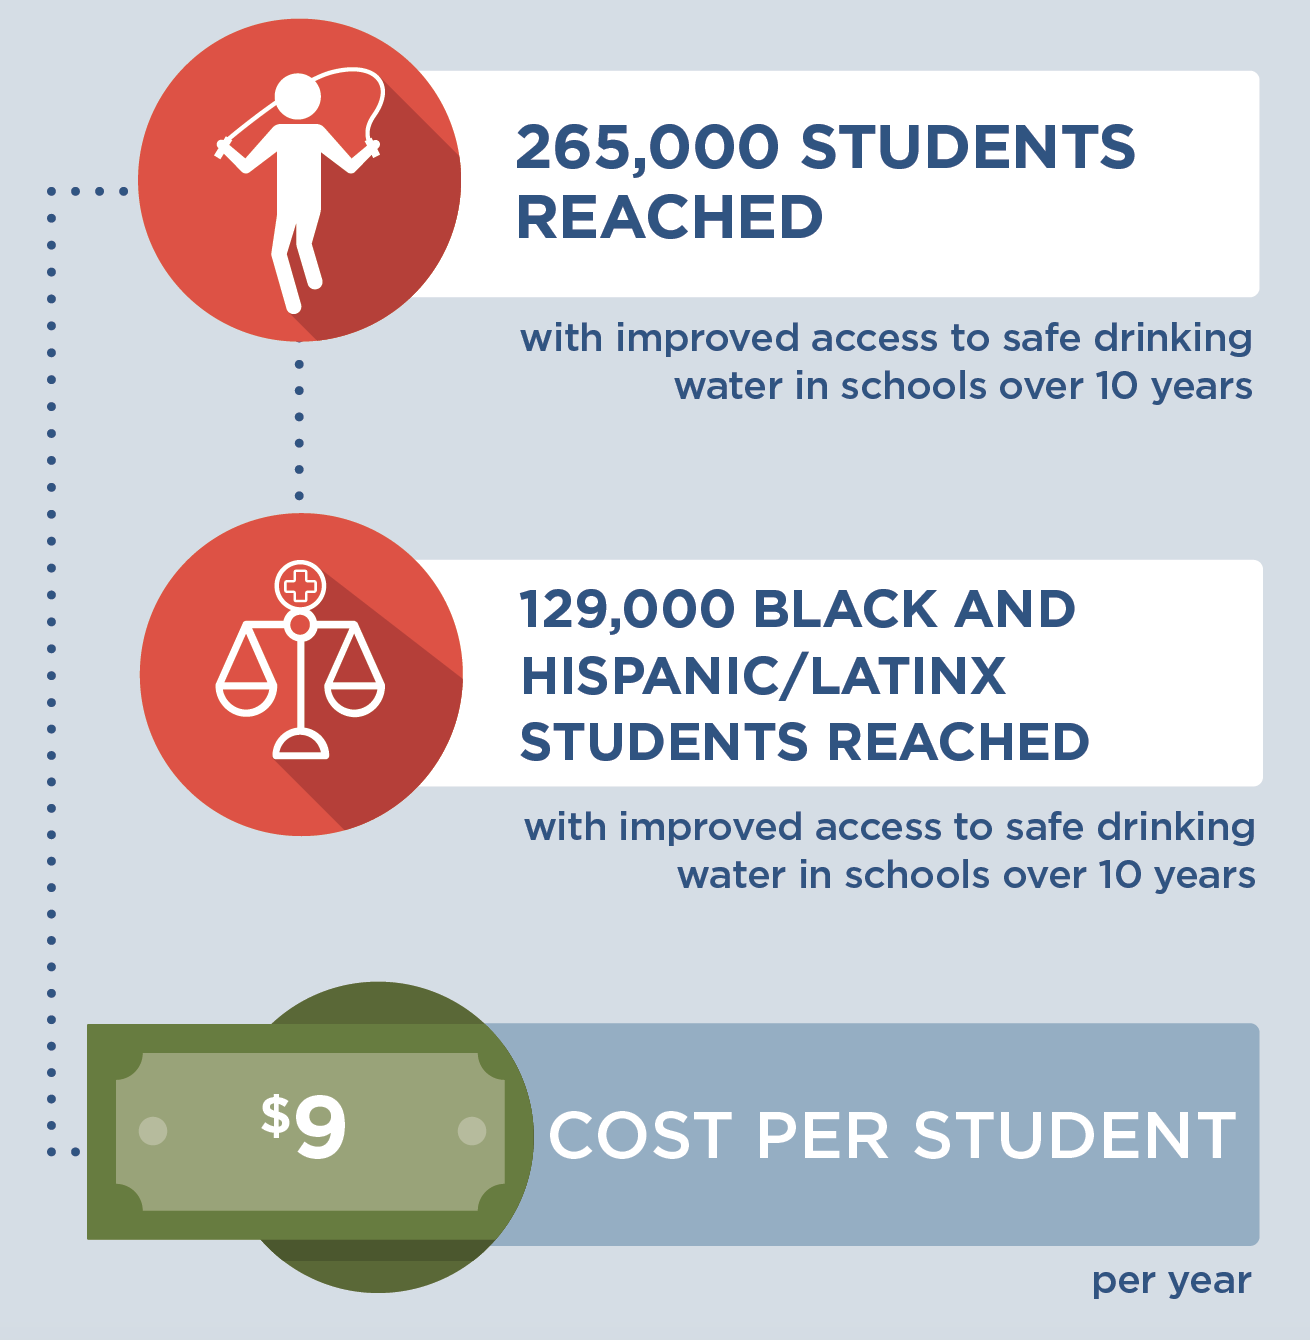 |
Conclusions and Implications
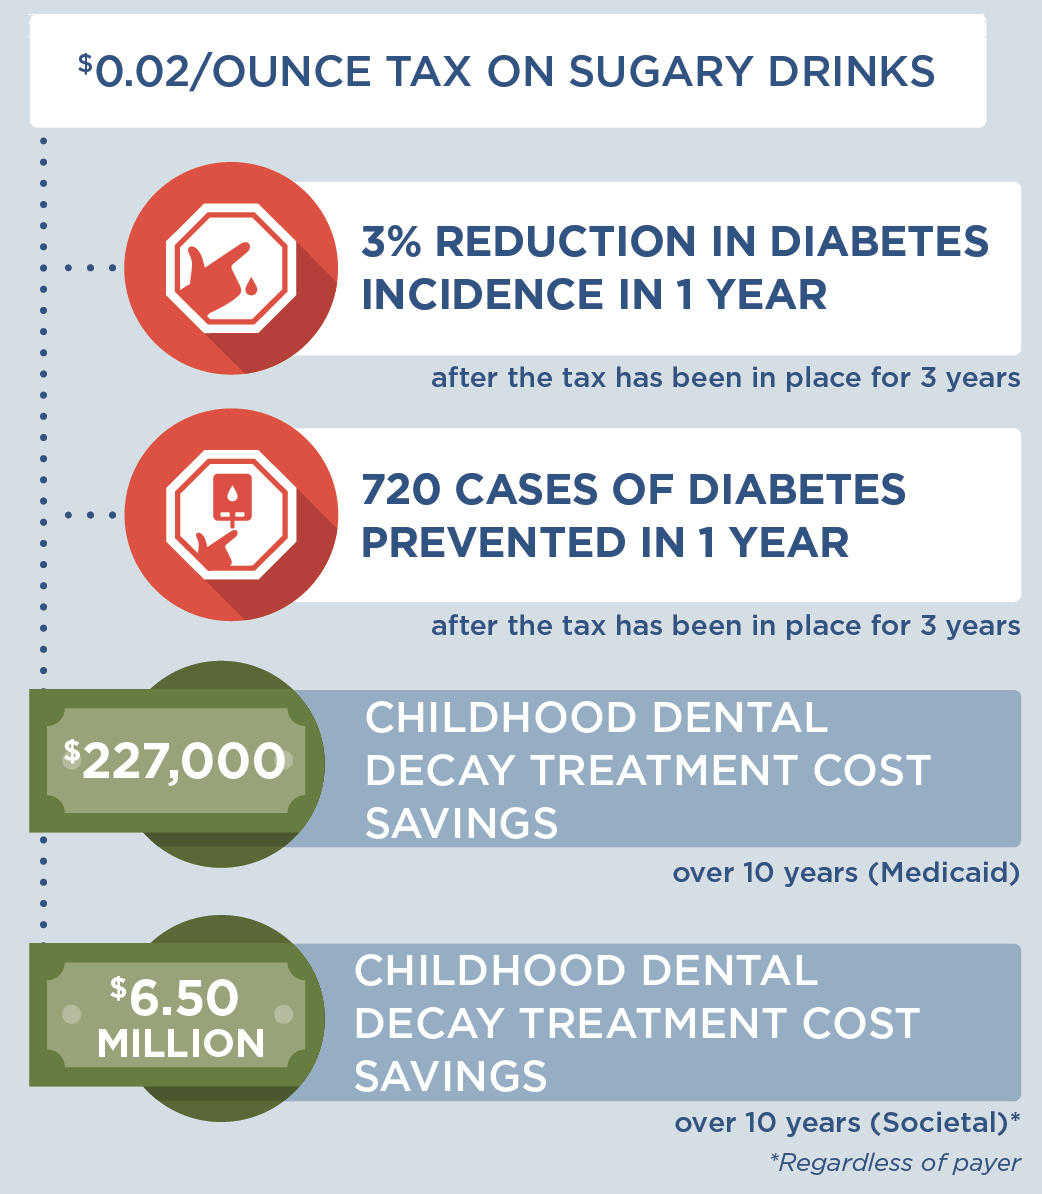
Installing water dispensers in K-8 public schools is an effective strategy for increasing access to clean and appealing drinking water, and over 10 years, it could improve drinking water access for 265,000 students in 304 schools in Massachusetts. Adequate water consumption can support well-being and cognitive function.9 Fluoridated water intake also prevents dental caries.10 Such preventive strategies play a critical role in promoting child health. This strategy is also projected to prevent 525 cases of childhood obesity in 2029 and cost, on average, $9 per child to implement each year. It is likely to be cost-effective at commonly accepted thresholds11 based on net cost per population health improvement related to excess weight, at a cost of $72,700 per quality-adjusted life year gained.
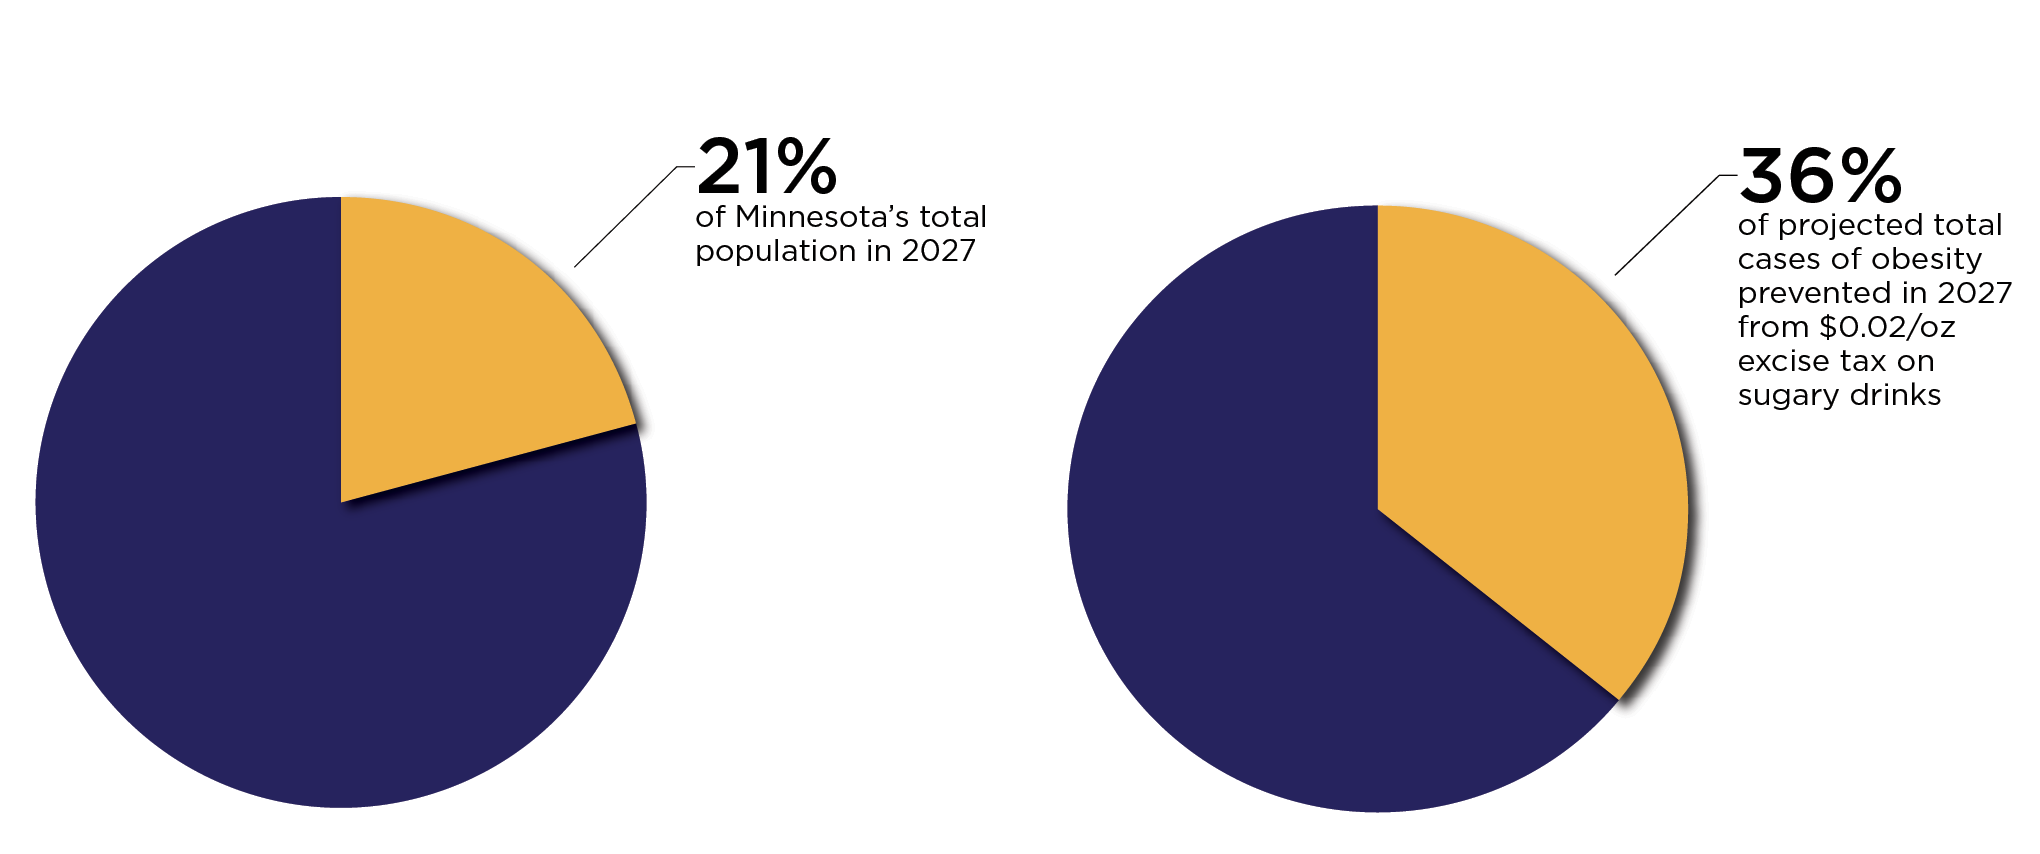
In Massachusetts, schools that participate in the state’s drinking water lead testing program are eligible to receive funding to install water dispensers.12 Expanding participation in this opportunity for drinking water testing and fixture installation would provide students and staff with better access to more appealing drinking water. Additionally, the proposed outreach strategy would prioritize installing water dispensers in schools that identify elevated concentrations of lead in their drinking water and in school districts located in communities meeting criteria for Environmental Justice designation.8 Because these communities have a higher proportion of residents who identify as people of color or households with low income, this strategy could promote health equity. Fifty percent of the students that would gain access to improved drinking water would be Black and Hispanic/Latinx, a higher proportion than the state’s student population overall.13
Though investment is required, every student deserves access to clean, appealing drinking water at school and this strategy would support the health of both students and staff in Massachusetts’ schools.
References
-
MA Executive Office of Energy and Environmental Affairs. Lead and Copper in School Drinking Water Sampling Results. Accessed December 5, 2022. https://www.mass.gov/service-details/lead-and-copper-in-school-drinking-water-sampling-results
-
Massachusetts Department of Elementary and Secondary Education. 2021 Youth Risk Behavior Survey (YRBS) Results. 2021.
-
Malik VS, Pan A, Willett WC , Hu FB. Sugar-sweetened beverages and weight gain in children and adults: a systematic review and meta-analysis. Am J Clin Nutr. 2013;98(4):1084-1102.
-
Chen L, Caballero B, Mitchell DC, et al. Reducing consumption of sugar-sweetened beverages is associated with reduced blood pressure a prospective study among United States adults. Circulation. 2010;121(22):2398-2406.
-
Bogart LM, Babey SH, Patel AI, Want P, Schuster MA. Lunchtime school water availability and water consumption among California adolescents. J Adolesc Health. 2016; 58(1):98-103, doi: 10.1016/j.jadohealth.2015.09.007.
-
Schwartz AE, Leardo M, Aneja S, Elbel B. Effect of a School-Based Water Intervention on Child Body Mass Index and Obesity. JAMA Pediatr. 2016; 170(3):220-226. doi:10.1001/jamapediatrics.2015.3778.
-
Kenney EL, Cradock AL, Long MW, et al. Cost-Effectiveness of Water Promotion Strategies in Schools for preventing Childhood Obesity and Increasing Water Intake. Obesity. 2019;27(12):2037-2045.
-
MA Executive Office of Energy and Environmental Affairs. Environmental Justice Populations in Massachusetts. Accessed April 7, 2023. https://www.mass.gov/info-details/environmental-justice-populations-in-massachusetts
-
Popkin BM, D’Anci KE, Rosenberg IH. Water, hydration, and health. Nutr Rev. 2010 Aug;68(8):439-58.
-
American Dental Association and Centers for Disease Control. Nature’s Way to Prevent Tooth Decay: Water Fluoridation. Published 2006. Accessed July 13, 2021. https://www.cdc.gov/fluoridation/pdf/natures_way.pdf
-
Neumann PJ, Cohen JT, Weinstein MC. Updating cost-effectiveness–the curious resilience of the $50,000-per-QALY threshold. New England Journal of Medicine. 2014 Aug 28;371(9):796-7. doi: 10.1056/NEJMp1405158. PMID: 25162885.
-
The Massachusetts Clean Water Trust. About SWIG. Accessed May 5, 2022. https://www.mass.gov/service-details/about-swig
-
Massachusetts Department of Elementary and Secondary Education. 2022-23 Enrollment By Race/Gender Report (District). Updated December 1, 2022. Accessed April 7, 2023. https://profiles.doe.mass.edu/statereport/enrollmentbyracegender.aspx
Suggested Citation:McCulloch SM, Barrett JL, Reiner JF, Cradock AL, Gortmaker SL. Massachusetts: Water Dispensers in Schools {Issue Brief}. The CHOICES Learning Collaborative Partnership at the Harvard T.H. Chan School of Public Health, Boston, MA; June 2023. For more information, please visit www.choicesproject.org The design for this brief and its graphics were developed by Molly Garrone, MA and partners at Burness. This issue brief was developed at the Harvard T.H. Chan School of Public Health through the Childhood Obesity Intervention Cost-Effectiveness Study (CHOICES) Learning Collaborative Partnership. This brief is intended for educational use only. This work is supported by The JPB Foundation and the Centers for Disease Control and Prevention (U48DP006376). The findings and conclusions are those of the author(s) and do not necessarily represent the official position of the Centers for Disease Control and Prevention or other funders. |