Resource Type: Research Briefs & Reports

Brief: Reducing Screen Time in Early Child Care Settings in Boston, MA

Teacher playing with kids

The information in this brief is intended only to provide educational information.

Versions of this brief were published in September 2021 and January 2023. The January 2023 update was to reflect revised projections for Boston’s population. This brief was updated again in October 2023 to more accurately represent the model period.

This brief summarizes a CHOICES Learning Collaborative Partnership model examining a strategy to reduce screen time in early child care settings in Boston. This strategy provides voluntary training to early child care educators and resources to families to limit noneducational television time at child care and home.

The Issue

Every child should have opportunities to grow up at a healthy weight. Too much screen time in early childhood is linked to overweight and obesity, as it reduces opportunities for children to be active and advertisement exposure can lead children to eat and drink more unhealthy foods.1 The American Academy of Pediatrics recommends limiting screen time to one hour of quality programming per day in child care and at home for children over 2 years old.2 Less than half of children ages 2-5 met this guideline.3

Limiting screen time at child care and home would support children’s healthy growth. In 2017, about three in 10 first graders in Boston had overweight or obesity.4 Reducing young children’s screen time will ensure more children grow up at a healthy weight and enter school ready to learn.

About the Strategy to Reduce Screen Time in Early Child Care Settings

This strategy could support Boston’s efforts to improve early child care quality through the Boston Healthy Child Care Initiative. It would include training opportunities for early child care educators, offering ongoing support and technical assistance, and providing parents with educational materials that may lead to reducing screen time in young children.5,6 Helping educators to implement practices shown to be effective in reducing television time can help the children in Boston’s early education and care settings engage in fewer minutes of screen time.

NOTE: The data that informed these estimates were collected after the program closures prompted by the COVID-19 pandemic. As programs reopen and demand continues to increase, this strategy could reach more children.

Comparing Costs and Outcomes

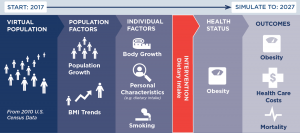
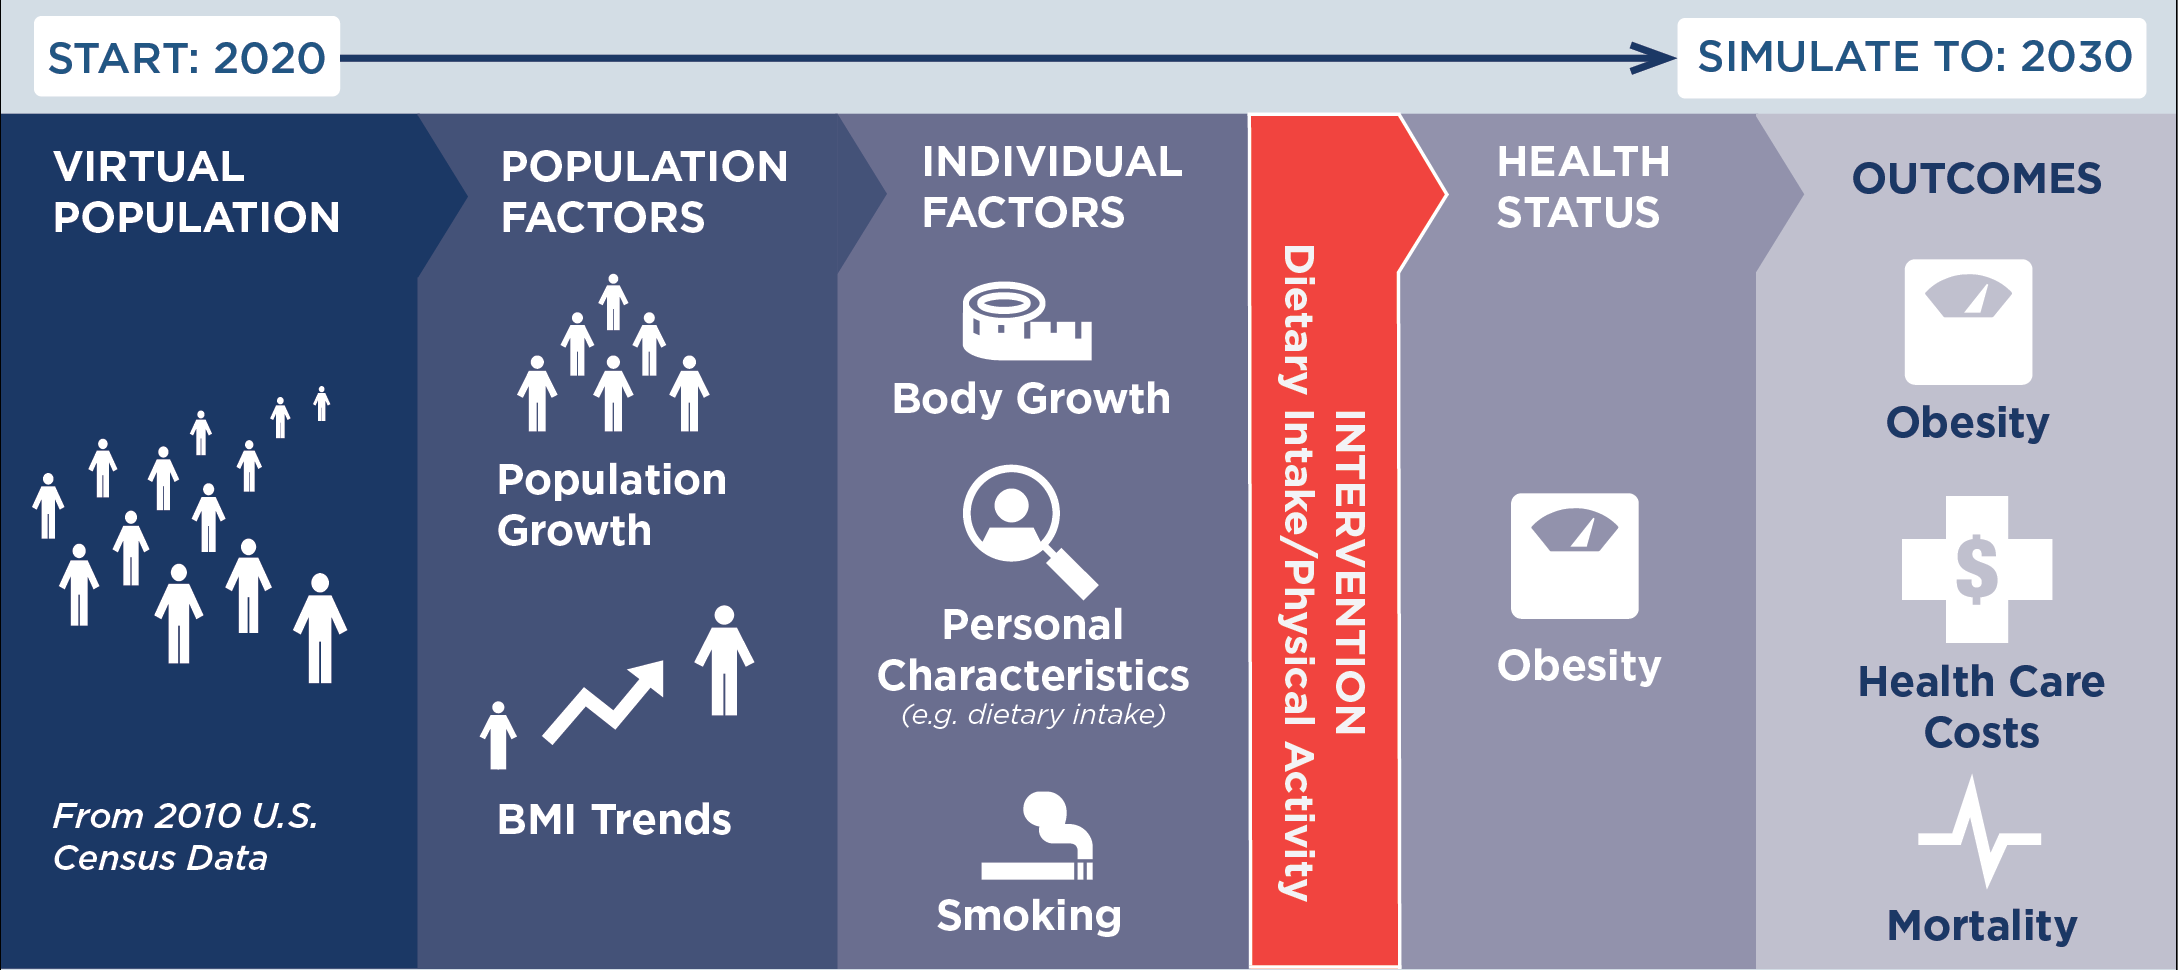
CHOICES cost-effectiveness analysis compared the costs and outcomes of implementing a strategy to reduce screen time in Boston early child care settings with the costs and outcomes associated with not implementing the strategy over 10 years (2020-2029).

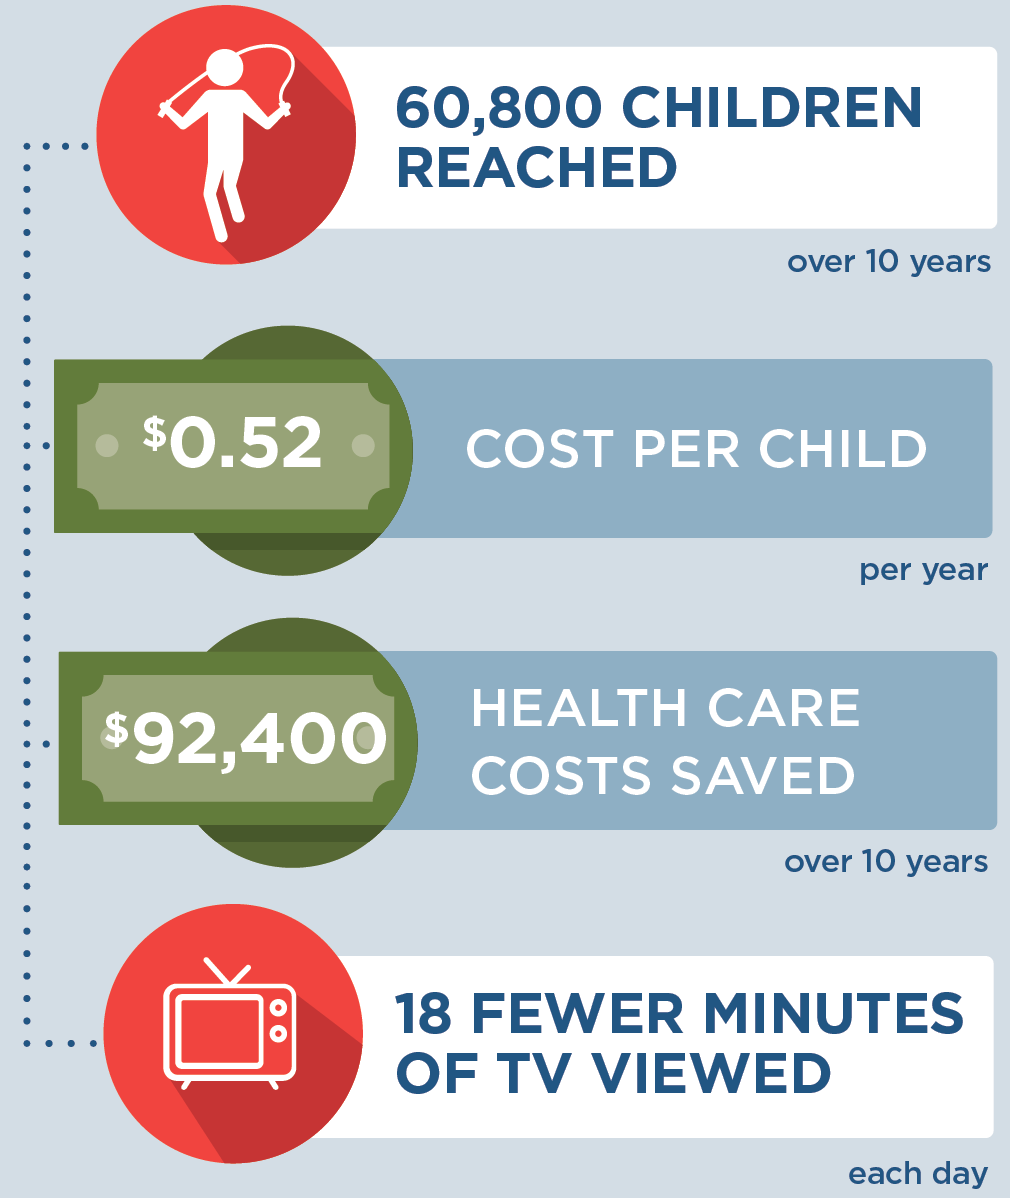
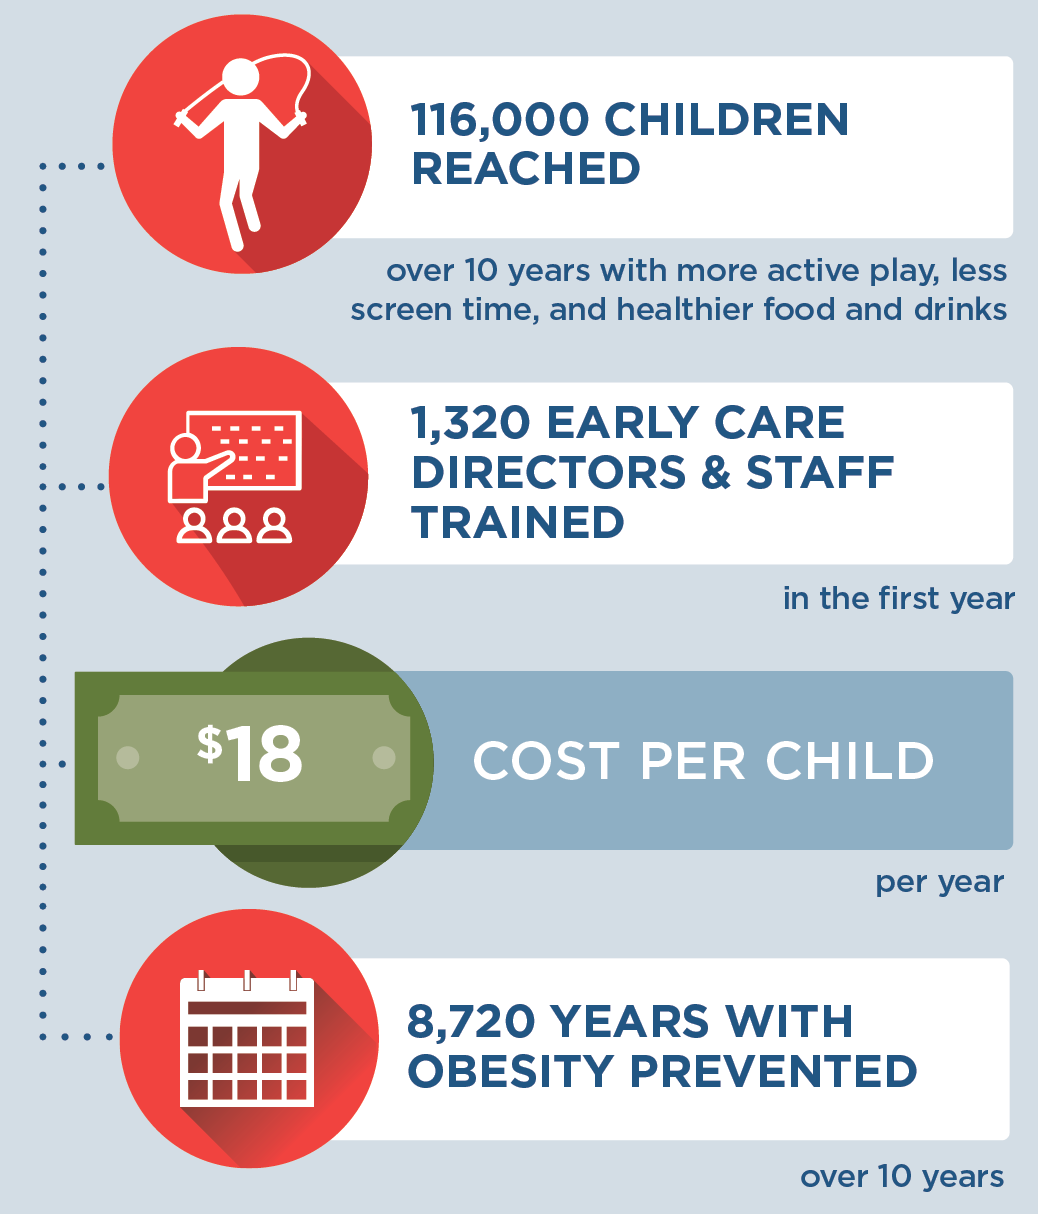
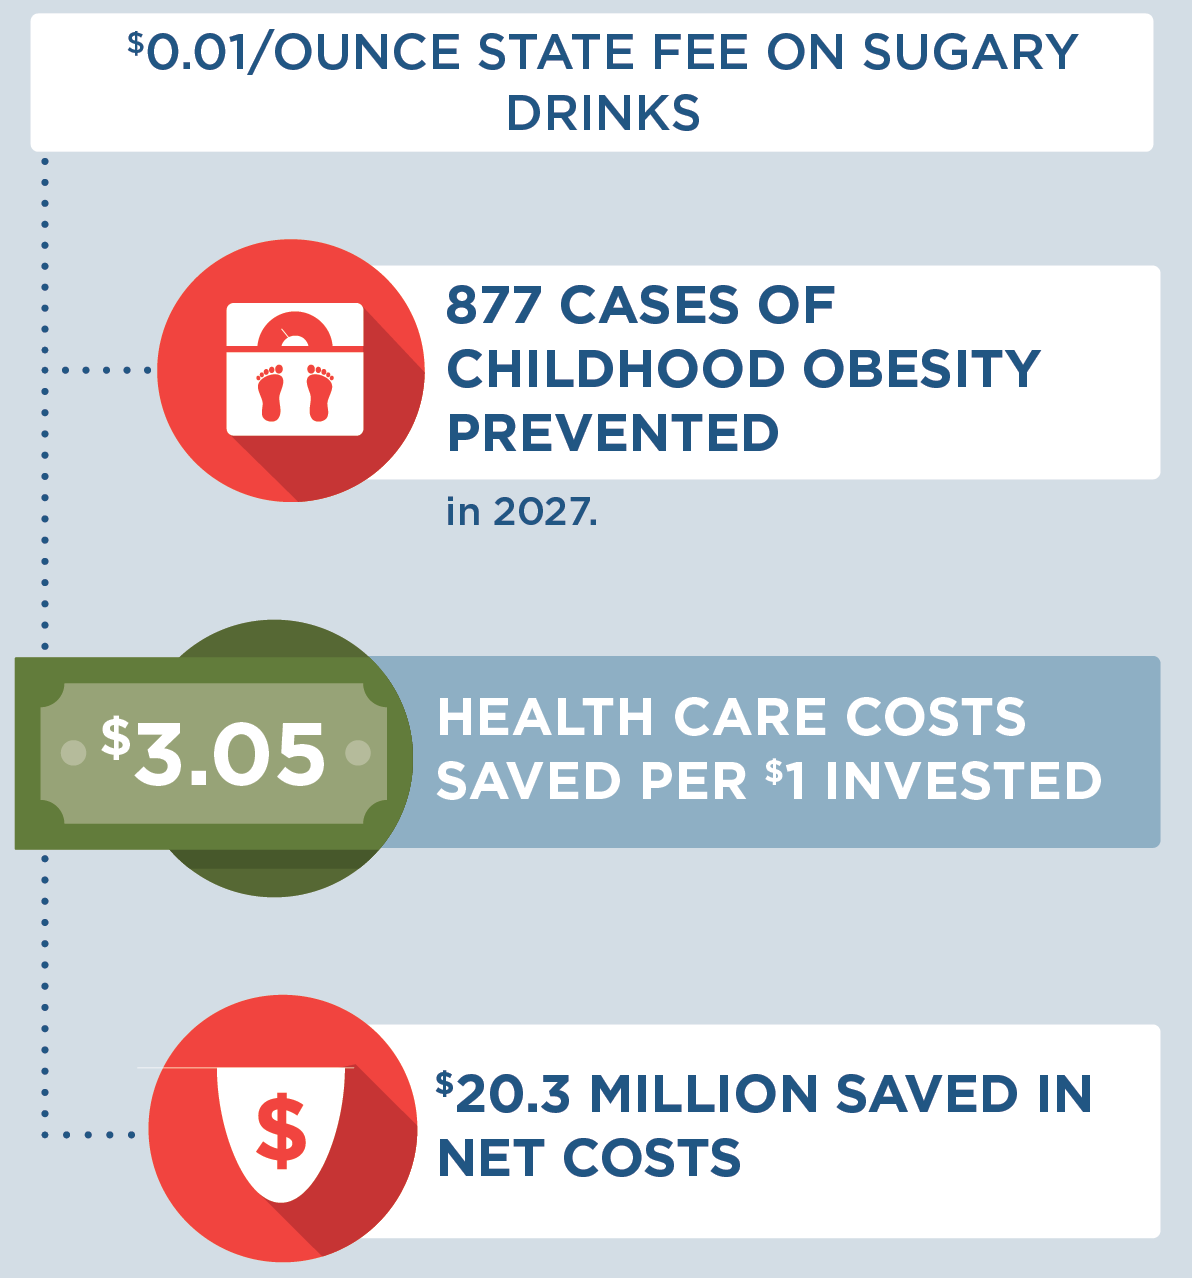
Implementing a strategy to reduce screen time in early child care settings is an investment in the future. By the end of 2029:

18,200 children would be reached over 10 years; 125 cases of childhood obesity would be prevented in 2029; this strategy would cost $16 per child to implement; children reached by this strategy would experience 33 fewer minutes of screen time per child per day

Conclusions and Implications

If the strategy were implemented, we estimate that over 10 years, 18,200 children ages 3-5 would attend programs that support reducing screen time (based on the number of programs open during the COVID-19 pandemic). This strategy would prevent 125 cases of obesity in 2029 alone, saving $138,000 in obesity-related health care costs over 10 years. The average annual cost to implement this strategy would be $161 per program, or $16 per child.

Expanding training opportunities for early child care educators will also help support quality care. Ensuring access to quality care is essential for families and employers.7 In the initial training series, this strategy would provide additional skills training and professional development for 1,380 educators and more opportunities to reduce screen time in 570 (100%) child care programs serving 3-5 year olds.

Besides promoting a healthy weight, viewing less screen time benefits children in other ways. Too much screen use is associated with less sleep and can negatively impact social well-being.1 We estimate that, on average, each child attending a program implementing the strategy would view 33 fewer minutes of screen time per day. This allows more time for developmentally appropriate play activities, helping to form a strong foundation for overall well-being. 

This strategy would train and provide technical assistance to early childhood educators on reducing screen time. As programs reopen post-pandemic and demand for child care continues to increase, the strategy could reach even more children. This strategy would enable early child care programs in Boston to support healthy growth because every child deserves a healthy start. 

References

  1. Li C, Cheng G, Sha T, Cheng W, Yan Y. The Relationships between Screen Use and Health Indicators among Infants, Toddlers, and Preschoolers: A Meta-Analysis and Systematic Review. International Journal of Environmental Research and Public Health. 2020;17(19):7324. 

  2. COUNCIL ON COMMUNICATIONS AND MEDIA. Media and Young Minds. Pediatrics. 2016;138(5):e20162591. 

  3. Healthy People 2030. Increase the proportion of children aged 2 to 5 who get no more than 1 hour of screen time a day – PA-13. Office of Disease Prevention and Health Promotion, Office of the Assistant Secretary for Health, Office of the Secretary, U.S. Department of Health and Human Services. Accessed July 20, 2021. https://health.gov/healthypeople/objectives-and-data/browse-objectives/physical-activity/increase-proportion-children-aged-2-5-years-who-get-no-more-1-hour-screen-time-day-pa-13/data 

  4. School Health Services, Dept of Public Health. Results from the Body Mass Index Screening in Massachusetts Public School Districts, 2017. School Health Services, Dept of Public Health; 2020. Accessed July 23, 2021. https://www.mass.gov/doc/the-status-of-childhood-weight-in-massachusetts-2017

  5. Mendoza JA, Baranowski T, Jaramillo S, et al. Fit 5 Kids TV Reduction Program for Latino Preschoolers: A Cluster Randomized Controlled Trial. American Journal of Preventive Medicine. 2016;50(5):584-592. 

  6. Dennison BA, Russo TJ, Burdick PA, Jenkins PL. An intervention to reduce television viewing by preschool children. Archives of Pediatrics and Adolescent Medicine. 2004;158(2):170-176. 

  7. Campbell F, Patil P, McSwain K. Boston’s Child-Care Supply Crisis: What a Pandemic Reveals. November 2020. https://www.bostonopportunityagenda.org/-/media/boa/early-ed-census-2020-pt-1-202011.pdf

Suggested Citation:

Bovenzi M, Carter S, Sabir M, Bolton AA, Barrett JL, Reiner JF, Cradock AL, Gortmaker SL. Boston, MA: Reducing Screen Time in Early Child Care Settings {Issue Brief}. Boston Public Health Commission and the CHOICES Learning Collaborative Partnership at the Harvard T.H. Chan School of Public Health, Boston, MA; October 2023. For more information, please visit www.choicesproject.org

Versions of this brief were published in September 2021 and January 2023. The January 2023 update was to reflect revised projections for Boston’s population. This brief was updated again in October 2023 to more accurately represent the model period.

The design for this brief and its graphics were developed by Molly Garrone, MA and partners at Burness.

This issue brief was developed at the Harvard T.H. Chan School of Public Health in collaboration with the Boston Public Health Commission through participation in the Childhood Obesity Intervention Cost-Effectiveness Study (CHOICES) Learning Collaborative Partnership. This brief is intended for educational use only. This work is supported by The JPB Foundation and the Centers for Disease Control and Prevention (U48DP006376). The findings and conclusions are those of the author(s) and do not necessarily represent the official position of the Centers for Disease Control and Prevention or other funders.

← Back to Resources

Brief: Women, Infants, and Children (WIC) Television Time Reduction in Arkansas

Mother playing with young child

The information in this brief is intended only to provide educational information.

This brief summarizes the findings from a CHOICES Learning Collaborative Partnership model examining a strategy to incorporate television time counseling into the Special Supplemental Nutrition Program for Women, Infants, and Children (WIC) in Arkansas. WIC staff would be trained to assess children’s television viewing and offer education on modifying television behaviors during WIC certification visits.

The Issue

In Arkansas, three out of 10 kindergarteners entering school in 2018 had overweight or obesity.1 However, limiting children’s television viewing may help them grow up at a healthy weight because product marketing on television can lead children to consume too many unhealthy foods and drinks.2

The American Academy of Pediatrics recommends children view a maximum of one hour per day of quality screen programming.3 Yet, in 2019, many children ages 2-4 participating in Arkansas’ WIC program viewed twice that amount, averaging nearly two hours per day. Just two out of every 10 children viewed the recommended level of daily screen time.4

In Arkansas, the WIC program offers nutrition education, referrals, and supplemental food support to low-income families (in households with income less than 185% of poverty levels). Identifying strategies to help these families achieve the recommended levels of television would support children’s growth and development. Ensuring children are growing up at a healthy weight also increases their likelihood of having a healthy weight in adulthood.

About Women, Infants, and Children (WIC) Television Time Reduction

This evidence-based strategy involves training WIC clinic staff to assess television viewing practices and provide opportunities for counseling to caregivers to reduce the amount of television their child watches.5 This strategy would require a modification within the existing assessment tool used to personalize nutrition education, referrals, and food package tailoring that would prompt staff to ask caregivers questions during recertification visits and provide relevant educational resources and guidance. WIC clinic staff would be trained to ask caregivers how much television their children view and then share ways to reduce it.

Comparing Costs and Outcomes

CHOICES cost-effectiveness analysis compared the costs and outcomes over a 10-year time horizon (2020-2030) of implementing WIC Television Time Reduction with the costs and outcomes associated with not implementing the strategy.

Implementing WIC Television Time Reduction in Arkansas is an investment in the future. By the end of 2030:

If WIC television time reduction was implemented in Arkansas, then 60,800 children would be reached over 10 years. It would cost $0.52 per child per year to implement, and save $92,400 in health care costs over 10 years. Children would view 18 fewer minutes of TV each day.

Conclusions and Implications

A state-level initiative that incorporates television viewing screening assessments and counseling practices into regular WIC visits could reach over 60,800 children and their families in Arkansas over 10 years. We project children would average 18 fewer minutes of television daily if these practices were incorporated. This strategy would prevent 314 cases of childhood obesity in Arkansas in 2030, at an average cost of $0.52 per child per year. Moreover, this investment in child health is estimated to pay off over 10 years. For every $1 spent on implementing this strategy, $1.06 in obesity-related health care costs would be saved over 10 years, saving $92,400 by 2030.

Children participating in WIC in Arkansas are in low-income households and are more likely to be Hispanic or Black than the general population of 2-4 year olds in Arkansas.4 CHOICES projected substantial reductions in cases of obesity among low-income children participating in WIC. Since this strategy is focused on populations with high risk of excess television viewing, and is not expected to impact obesity among higher income households not participating in WIC, it could lead to improvements in disparities in both television viewing and obesity risk.

The WIC program helps safeguard the health of children by providing supplemental foods, referrals, and nutrition education. These preventive strategies can play a critical role in helping children establish healthy habits early. Incorporating opportunities for skill-building to reduce television time into the WIC program is a low-cost and feasible strategy to ensure opportunities for more Arkansas children to grow up a healthy weight.

References

  1. ACHI. Assessment of Childhood and Adolescent Obesity in Arkansas: Year 16 (Fall 2018-Spring 2019). Little Rock, AR: Arkansas Center for Health Improvement; 2019.

  2. Russell SJ, Croker H, Viner RM. The effect of screen advertising on children’s dietary intake: A systematic review and meta-analysis. Obesity Reviews. 2019;20(4):554-568.

  3. Council on Communications and Media. Media and Young Minds. Pediatrics. 2016;138(5):e20162591.

  4. Arkansas Department of Health. WIC program 2019 data, unpublished report; accessed June 2020.

  5. Whaley S, McGregor S, Jiang L, Gomez J, Harrison G, Jenks E. A WIC-Based Intervention to Prevent Early Childhood Overweight. Journal of Nutrition Education and Behavior. 2010 Feb; 52(3S) S47-51

Suggested Citation:

Adams B, Sutphin B, Looney R, Rollins N, Balamurugan A, Kim H, Bolton A, Reiner J, Barrett J, Gortmaker SL, Cradock AL. Arkansas: Women, Infants, and Children (WIC) Television Time Reduction {Issue Brief}. Arkansas Department of Health, Little Rock, AR, and the CHOICES Learning Collaborative Partnership at the Harvard T.H. Chan School of Public Health, Boston, MA; May 2021. For more information, please visit www.choicesproject.org

The design for this brief and its graphics were developed by Molly Garrone, MA and partners at Burness.

This issue brief was developed at the Harvard T.H. Chan School of Public Health in collaboration with the Arkansas Department of Health through participation in the Childhood Obesity Intervention Cost-Effectiveness Study (CHOICES) Learning Collaborative Partnership. This brief is intended for educational use only. This work is supported by The JPB Foundation and the Centers for Disease Control and Prevention (U48DP006376). The findings and conclusions are those of the author(s) and do not necessarily represent the official position of the Centers for Disease Control and Prevention or other funders.

← Back to Resources

Brief: Creating Healthier Child Care Environments: NAPSACC in the Quality Rating Improvement System in Arkansas

Young kids playing in an early care setting

The information in this brief is intended only to provide educational information.

This brief summarizes a CHOICES Learning Collaborative Partnership model examining a strategy incorporating the Nutrition and Physical Activity Self-Assessment for Child Care (NAP SACC) assessment tools into Better Beginnings, Arkansas’ Quality Rating and Improvement System, to support quality early child care program opportunities and promote child health. 

The Issue

In Arkansas, three out of 10 kindergarteners entering school in 2018 had overweight or obesity.1 The majority of today’s children will have obesity at age 35 if we don’t act.2 Making sure children are growing up at a healthy weight from their very first days is a critical way to prevent obesity and future risk for obesity-related diseases like diabetes as adults. Conditions linked to obesity, previously only seen in adults, are appearing in Arkansas’ Medicaid-enrolled children.3 Early child care programs that support healthy nutrition and physical activity habits show great promise in promoting healthy weight.4

In Arkansas, more than half of children ages 2-5 attend a licensed child care program.5 Providing licensed child care programs with training opportunities and resources through Better Beginnings may be an effective strategy to improve the quality of child care programs and to ensure that the majority of children in Arkansas are off to a healthy start.

About NAP SACC

NAP SACC is an evidence-based, trusted strategy enabling child care centers to attain best practices regarding nutrition, active play, and screen time.4 To date, NAP SACC shows the best evidence for reducing childhood obesity risk in children under age 5.6 Early education program directors and staff complete self-assessments and receive training and technical assistance to implement practices, policies, and changes supporting healthy outcomes. Better Beginnings is designed to improve child care environments to support child health and development. Integrating NAP SACC into Better Beginnings can improve the quality of child care programs and ensure more children grow up healthy in Arkansas.

Comparing Costs and Outcomes

A CHOICES cost-effectiveness analysis compared the costs and outcomes over a 10-year time horizon (2020-2030) of implementing NAP SACC with the costs and outcomes of not implementing the program.

Implementing NAP SACC into Better Beginnings in Arkansas is an investment in child health. By the end of 2030:

If NAP SACC was incorporated into Better Beginnings in Arkansas, then 116,000 children would be reached over 10 years with more active play, less screen time, and healthier food and drinks. 1,320 early care directors and staff would be trained in the first year. It would cost $18 per child per year to implement. 8,720 years with obesity would be prevented over 10 years.

Conclusions and Implications

Every child should have opportunities for a healthy start. A state-level initiative integrating NAP SACC into training and quality improvement through Better Beginnings could create healthier nutrition and physical activity environments in child care programs for 116,000 children over 10 years. This strategy would benefit 1,320 early care directors and staff with training and technical assistance to support using nutrition, active play, and screen time best practices at 659 child care programs. Over 10 years, children in Arkansas would have 8,720 more years lived at a healthy weight and 1,130 fewer children would have obesity in 2030 alone.

Many prevention strategies targeting children require an upfront investment because costly obesity-related health conditions generally present later in adulthood.7 While we project this strategy would cost $18 per child per year, shortchanging early prevention efforts may lead to costly and complicated treatment in the future. Already, the total annual costs of having obesity are estimated to be $6 million for the 30,000 25- to 29-year-olds enrolled in Medicaid—inclusive of Arkansas’ expansion population. This represents an excess annual cost of $200 per person due to obesity.3

Early child care programs also play a critical role in supporting healthy child development and children’s academic readiness.8 Investing in a strategy for quality improvement that provides the necessary training, technical assistance, and resources supports early educators in providing high-quality child care that nurtures healthy habits. Enabling early education leaders in Arkansas to use the best available evidence to prevent excess weight gain in children will support children’s healthy growth and development.

References

  1. ACHI. (2019). Assessment of Childhood and Adolescent Obesity in Arkansas: Year 16 (Fall 2018–Spring 2019). Arkansas Center for Health Improvement. Little Rock, AR.

  2. Ward Z, Long M, Resch S, Giles C, Cradock A, Gortmaker S. Simulation of Growth Trajectories of Childhood Obesity into Adulthood. New England Journal of Medicine. 2017; 377(22): 2145-2153.

  3. ACHI, Arkansas Medicaid. Comorbid Conditions and Medicaid Costs Associated with Childhood Obesity in Arkansas. 2019.

  4. Alkon A, Crowley AA, Neelon SE, Hill S, Pan Y, Nguyen V, Rose R, Savage E, Forestieri N, Shipman L, Kotch JB. Nutrition and physical activity randomized control trial in child care centers improves knowledge, policies, and children’s body mass index. BMC Public Health. 2014;14:215.

  5. Arkansas Department of Human Services, Division of Child Care and Early Childhood Education, Child Care Facilities Database. Unpublished data. 2020.

  6. Kenney E, Cradock A, Resch S, Giles C, Gortmaker S. The Cost-Effectiveness of Interventions for Reducing Obesity among Young Children through Healthy Eating, Physical Activity, and Screen Time. Durham, NC: Healthy Eating Research; 2019. Available at: http://healthyeatingresearch.org

  7. Gortmaker SL, Wang YC, Long MW, Giles CM, Ward ZJ, Barrett JL, …Cradock, AL. Three interventions that reduce childhood obesity are projected to save more than they cost to implement. Health Affairs. 2015; 34(11), 1932–1939.

  8. Morrisey T. The Effects of Early Care And Education on Children’s Health. Health Affairs Health Policy Brief. 2019

Suggested Citation:

Adams B, Sutphin B, Betancourt K, Balamurugan A, Kim H, Bolton A, Barrett J, Reiner J, Cradock AL. Arkansas: Creating Healthier Child Care Environments: Nutrition and Physical Activity Self-Assessment for Child Care (NAP SACC) in the Quality Rating Improvement System (QRIS) {Issue Brief}. Arkansas Department of Health, Little Rock, AR, and the CHOICES Learning Collaborative Partnership at the Harvard T.H. Chan School of Public Health, Boston, MA; May 2021. For more information, please visit www.choicesproject.org

The design for this brief and its graphics were developed by Molly Garrone, MA and partners at Burness.

This issue brief was developed at the Harvard T.H. Chan School of Public Health in collaboration with the Arkansas Department of Health through participation in the Childhood Obesity Intervention Cost-Effectiveness Study (CHOICES) Learning Collaborative Partnership. This brief is intended for educational use only. This work is supported by The JPB Foundation and the Centers for Disease Control and Prevention (U48DP006376). The findings and conclusions are those of the author(s) and do not necessarily represent the official position of the Centers for Disease Control and Prevention or other funders.

← Back to Resources

Brief: Safe Routes to School in Wisconsin

Young girl riding bike at the Safe Routes to School Family Fun Night Event in Neenah, Wisconsin in May 2018; orange cone in the background

The information in this brief is intended only to provide educational information.

This brief summarizes a CHOICES Learning Collaborative Partnership model examining the expansion of a regional Safe Routes to School program in K-8 public and private schools in Wisconsin. Safe Routes to School Programs help children safely walk and bike to school by incorporating principles of the six E’s: engagement, encouragement, equity, engineering, education, and evaluation.

The Issue

In Wisconsin, just three out of every 10 children achieve the 60 minutes of physical activity recommended daily for health.1 Over recent decades, the number of students walking and bicycling to school has declined,2 eliminating an important physical activity opportunity. Adopting programs that make it safer and easier to walk or bike to school can increase the number of students using these physically active travel modes and can also allow students to incorporate physical activity into a daily routine.3 Every child should have the opportunity to be healthy, and all kids need opportunities to be physically active, no matter where they live or where they go to school. This study estimates the cost-effectiveness of increasing funding and diversifying funding sources to expand a regional model for Safe Routes to School programs for those schools that have not yet implemented comprehensive Safe Routes to School programs in Wisconsin.

About Safe Routes to School

Safe Routes to School programs that adopt the six E’s, including improvements to local sidewalks and roads around schools, providing pedestrian and bike safety education, and offering encouragement and promotion activities, can increase the number of students walking and bicycling to school.2 This study looked at the scaled expansion of East Central Wisconsin Regional Planning Commission’s Safe Routes to School program to other regional planning commissions across Wisconsin. A state-wide Safe Routes to School Program Coordinator would work with regional SRTS Coordinators and advisory committees, providing oversight and administration of the allocated funding to support projects in their region. Each regional planning commission would coordinate education, encouragement, and promotion activities across funded schools in their region. Local municipalities would lead projects to improve the safety of sidewalks and road infrastructure.

Comparing Costs and Outcomes

A CHOICES cost-effectiveness analysis compared the costs and outcomes of expanding Safe Routes to School in Wisconsin with the costs and outcomes associated with not implementing the program over 10 years (2020-2030).

Implementing Safe Routes to School in Wisconsin is an investment in child health. By the end of 2030:

If Safe Routes to School was expanded in Wisconsin, then by the end of 2030, 151,000 children would attend schools with safer transportation environments, and children who start walking or biking to school would get 48 more active minutes per week. This program would cost $58 per child annually to implement, for those children attending schools that adopt Safe Routes to School programs.

Conclusions and Implications

Every student should be able to walk or bike to school safely. Expanding East Central’s regional Safe Routes to School model in Wisconsin could support safer walking and biking environments and provide programmatic education and encouragement initiatives for 151,000 elementary and middle school students over 10 years. We estimate that the Safe Routes to School program, which includes education and promotion activities, improvements to sidewalks and road infrastructure, and coordination support, would cost $58 per student per year. Over 10 years, these activities to expand the regional SRTS model in Wisconsin would cost about $215,000 per school. At the same time, more than 8,000 students would start walking and biking to school, and they would get 48 more minutes of physical activity per week. This translates to better health outcomes and more kids at a healthy weight in Wisconsin, with 16 fewer cases of obesity in the year 2030 alone.

In addition to getting students more active,4,5 SRTS initiatives may also reduce the risk of pedestrian and bicycle injury, exposure to unsafe traffic, and air pollution.3,6,7 Greater safety, improved health from increased physical activity, and lesser environmental impact from decreased automobile use provide economic benefits to the community.8 In Wisconsin, the costs of implementing SRTS projects could be offset by savings associated with reduced vehicle travel, potentially amounting to $2.19 million in environment-related cost savings over 10 years. Further, families whose students start walking or bicycling would also drive less and could save an average of $1,120 by not driving their students to school. Walking and biking are great ways for kids to be active, and this program invests in ways to ensure that more students can do so safely while developing healthy lifestyle habits that would continue into adulthood.

References

  1. Child and Adolescent Health Measurement Initiative. 2018-2019 National Survey of Children’s Health (NSCH) data query. https://www.nschdata.org/browse/survey/results?q=7700&r=51. Accessed October 29, 2020.

  2. McDonald, NC. Active transportation to school: trends among US schoolchildren, 1969–2001. American Journal of Preventive Medicine. 2007; 32(6), 509-516.

  3. Stewart O, Vernez Moudon A, Claybrooke C. Multistate Evaluation of Safe Routes to School Programs. American Journal of Health Promotion. 2014;28(3);S89-S96.

  4. Cooper, Jago, Southard, Page. Active Travel and Physical Activity across the School Transition: The PEACH Project. Medicine & Science in Sports & Exercise. 2012; 44(13); 1890–1897.

  5. Huang WY, Wong SH, He G. Is change to active travel to school an important source of physical activity for Chinese children? Pediatric Exercise Science. 2017; 29(1):161-168.

  6. DiMaggio, C, & Li, G. Effectiveness of a safe routes to school program in preventing school-aged pedestrian injury. Pediatrics. 2013;131(2);290-296.

  7. DiMaggio C, Chen Q, Muennig PA, Li G. Timing and effect of a safe routes to school program on child pedestrian injury risk during school travel hours: Bayesian changepoint and difference-in-difference analysis. Injury Epidemiol. 2014;1:17.

  8. Jacob V, Chattopadhyay SK, Reynolds JA, et al. Economics of Interventions to Increase Active Travel to School: A Community Guide Systematic Review. American Journal of Preventive Medicine. 2021;60(1):e27-e40.

Suggested Citation:

McCulloch SM, Barrett JL, Reiner JF, Cradock AL. Wisconsin: Safe Routes to School {Issue Brief}. Wisconsin Department of Health Services, Division of Public Health, Madison, WI, & East Central Wisconsin Regional Planning Commission, Menasha, WI and the CHOICES Learning Collaborative Partnership at the Harvard T.H. Chan School of Public Health, Boston, MA; May 2021. For more information, please visit www.choicesproject.org

Funding for the Survey of the Health of Wisconsin (SHOW) was provided by the Wisconsin Partnership Program PERC Award (233 AAG9971). The authors would also like to thank the University of Wisconsin Survey Center, SHOW administrative, field, and scientific staff, as well as all the SHOW participants for their contributions to this study.

The design for this brief and its graphics were developed by Molly Garrone, MA and partners at Burness.

This issue brief was developed at the Harvard T.H. Chan School of Public Health in collaboration with the Wisconsin Department of Health Services through participation in the Childhood Obesity Intervention Cost-Effectiveness Study (CHOICES) Learning Collaborative Partnership. This brief is intended for educational use only. This work is supported by The JPB Foundation and the Centers for Disease Control and Prevention (U48DP006376). The findings and conclusions are those of the author(s) and do not necessarily represent the official position of the Centers for Disease Control and Prevention or other funders.

← Back to Resources

Brief: Supporting Healthy Beverage Choices in Out-of-School Time Programs in Wisconsin

Kids drinking water

The information in this brief is intended only to provide educational information.

This brief summarizes a CHOICES Learning Collaborative Partnership model examining a policy to promote healthy beverage choices in licensed out-of-school time (OST) programs in Wisconsin.

The Issue

All children should have opportunities to grow up at a healthy weight. However, consuming sugary drinks, like sports drinks, soda, and fruit drinks sweetened with sugar, poses a health risk to children. In 2012, almost one in four (23.1%) adolescents in Wisconsin drank a sugary drink at least once a day.1

In Wisconsin, more than 120,000 children attend OST programs.2 These educational settings can provide essential opportunities for children to learn healthy eating habits. However, many OST programs in Wisconsin do not provide guidance to children or their families about the types of beverages that should be brought in to drink while children participate in program activities. Many programs must meet high national nutrition standards for the foods and beverages they serve to kids. However, when children bring in their own drinks, they can be less healthy than options served by the programs they attend.3 Promoting only healthy beverage choices in OST programs may improve children’s health by reducing sugary drink consumption.4,5

About the Healthy Beverage Policy

We looked at a strategy that would support OST programs in adopting a healthy beverage policy. Programs that participate in YoungStar, Wisconsin’s childcare quality rating and improvement system, and receive their snacks through meal programs that meet national nutrition standards, were considered the subset of eligible sites. A healthy beverage policy would set nutritional standards for the beverages that could be brought into the OST programs, ensuring that all beverages available in these programs meet national standards that support good nutrition.3 Implementation would include training and informing OST program directors about the need for policy change and ways to incorporate the new policy into their program handbooks. YoungStar Technical Consultants would provide technical assistance to support policy adoption, and program staff would complete surveys annually to monitor policy implementation.

Comparing Costs and Outcomes

A CHOICES cost-effectiveness analysis compared the costs and outcomes of implementing a healthy beverage policy in OST programs with the costs and outcomes associated with not implementing the healthy beverage policy over 10 years (2020-2030).

Implementing a healthy beverage policy in programs in Wisconsin could support good nutrition and save families money. By the end of 2030:

If a healthy beverage policy was implemented in OST programs in Wisconsin, then by the end of 2030, 2,060 children would consume fewer sugary drinks, and children who would no longer bring in sugary drinks would drink 10 fewer ounces of sugary drinks per day. To adopt a healthy beverage policy at OST programs in Wisconsin, it would cost $0.76 per child annually.

Conclusions and Implications

Adopting a healthy beverage policy in OST programs in Wisconsin could promote better health for children and save families money. Over 10 years, this strategy could support 145 programs in creating healthier environments for the more than 33,000 children they will serve. This would cost less than a dollar per child participating in these OST programs per year. Over 10 years, 2,060 children would be consuming 10 fewer ounces of sugary drinks per day on the days they attend the OST program. Over 10 years, this could amount to $555,000 in savings for families who no longer buy sugary beverages for their children to bring into OST programs. Consuming fewer sugary drinks can promote better oral health,6 and prevent more children from having obesity.4 In 2030 alone, it is expected there will be 15 fewer cases of obesity if Wisconsin OST programs implemented healthy beverage policies.

OST programs can play a critical role in helping children establish healthy nutritional habits early on in life. Many providers want to offer an environment that nurtures healthy children, but some programs may need support to integrate new nutrition standards. YoungStar can provide training and resources to help OST program providers adopt nutrition standards that reinforce healthy nutrition habits.7 With training on nutritional standards, OST program directors and program staff would also have the opportunity to learn about and adopt healthier eating habits as well.8 A healthy beverage policy could support OST providers in providing healthier program settings for children in the hours outside of school.

References

  1. CDC, Division of Nutrition, Physical Activity and Obesity. Wisconsin: State Nutrition, Physical Activity, and Obesity Profile. Published September 2012. https://www.cdc.gov/obesity/stateprograms/fundedstates/pdf/wisconsin-state-profile.pdf

  2. Marshfield Clinic Center for Community Outreach. Afterschool in Wisconsin: Building Our Children’s Future, One Program at a Time. https://www.ncsl.org/Portals/1/Documents/educ/Wisconsin_infographic.pdf. Accessed December 18, 2020.

  3. Kenney EL, Austin SB, Cradock AL, Giles CM, Lee RM, Davison KK, Gortmaker SL. Identifying sources of children’s consumption of junk food in Boston afterschool programs, April-May 2011. Preventing Chronic Disease. 2014 Nov 20;11:E205.

  4. Malik VS, Schulze MB, Hu FB. Intake of sugar-sweetened beverages and weight gain: a systematic review. American Journal of Clinical Nutrition. 2006;84(2):274– 88.

  5. Khan LK, Sobush K, Keener D, Goodman K, Lowry A, Kakietek J, et al. Recommended community strategies and measurements to prevent obesity in the United States. MMWR Recommendations and Reports. 2009;58(RR-7):1–26.

  6. Sheiham A, James WPT. A new understanding of the relationship between sugars, dental caries and fluoride use: implications for limits on sugars consumption. Public Health Nutrition. 2014;17(10):2176-2184.

  7. Wisconsin Department of Children and Families. YoungStar Training and Professional Development. https://dcf.wisconsin.gov/youngstar/providers/training. Accessed January 6, 2021.

  8. Weaver RG, Beets MV, Saunders RP, Beighle A, Webster C. A Comprehensive Professional Development Training’s Effect on Afterschool Program Staff Behaviors to Promote Healthy Eating and Physical Activity. Journal of Public Health Management & Practice. 2014;20(4):E6-E14.

Suggested Citation:

Salas TM, Meinen A, Kim H, McCulloch S, Reiner J, Barrett J, Cradock AL. Wisconsin: Supporting Healthy Beverage Choices in Out-of-School Time Programs {Issue Brief}. Wisconsin Department of Health Services & University of Wisconsin-Madison, Madison, WI, and the CHOICES Learning Collaborative Partnership at the Harvard T.H. Chan School of Public Health, Boston, MA; May 2021. For more information, please visit www.choicesproject.org

Funding for the Survey of the Health of Wisconsin (SHOW) was provided by the Wisconsin Partnership Program PERC Award (233 AAG9971). The authors would also like to thank the University of Wisconsin Survey Center, SHOW administrative, field, and scientific staff, as well as all the SHOW participants for their contributions to this study.

The design for this brief and its graphics were developed by Molly Garrone, MA and partners at Burness.

This issue brief was developed at the Harvard T.H. Chan School of Public Health in collaboration with the Wisconsin Department of Health Services through participation in the Childhood Obesity Intervention Cost-Effectiveness Study (CHOICES) Learning Collaborative Partnership. This brief is intended for educational use only. This work is supported by The JPB Foundation and the Centers for Disease Control and Prevention (U48DP006376). The findings and conclusions are those of the author(s) and do not necessarily represent the official position of the Centers for Disease Control and Prevention or other funders.

← Back to Resources

Brief: Active Physical Education (PE) in Iowa

PE class at Carver Elementary, Des Moines Public School System

The information in this brief is intended only to provide educational information.

This brief summarizes the findings from a CHOICES Learning Collaborative Partnership model examining a strategy supporting the implementation of a guideline that 50% of physical education (PE) class time be spent in moderate-to-vigorous physical activity, consistent with best practice guidelines in quality physical education programs.

The Issue

In Iowa, only three out of every 10 children meet the national recommendation for participating in 60 minutes or more of moderate-to-vigorous physical activity each day.1 Evidence shows that physical activity helps kids grow up at a healthy weight, preventing diseases like diabetes and heart disease. Physical activity also has important brain health benefits for students, such as promoting cognition and reducing symptoms of depression.2 High-quality physical education programs in schools can help students get the recommended amount of daily physical activity.2 However, research shows that some children may spend less than half of the PE class being physically active.3

About Active PE

Active PE would support educators’ equipment, curricular, and training needs to ensure that their students can participate in high-quality physical education. Curriculum training specialists would train physical education teachers in Iowa schools in an evidence-based, standards-aligned curriculum and training program that can increase the quality of the existing physical education program and the proportion of time students are active while in PE class.4 This strategy would support the implementation of Iowa’s Physical Education standards and aligns with Iowa Department of Public Health’s goal to ensure students have the opportunity to engage in one hour of physical activity each day.5 Implementation of Active PE would include a two-day training workshop for PE teachers, providing the necessary curriculum and equipment materials for schools, and include state-level coordination.6,7

Comparing Costs and Outcomes

A CHOICES cost-effectiveness analysis compared the costs and outcomes over 10 years (2020-2030) of implementing Active PE with the costs and outcomes associated with not implementing the strategy.

Implementing Active PE in Iowa is an investment in the future. By the end of 2030:
If Active PE was implemented in Iowa, then by the end of 2030, 495,000 children would be reach over 10 years. It would cost $8 per child to implement Active PE. Each child would get 7 more active minutes per week.

Conclusions and Implications

Implementation of Active PE strategies is projected to increase physical activity and improve the health of 495,000 elementary and middle school students in Iowa over 10 years. On average, each student would participate in seven more minutes of moderate-to-vigorous physical activity during each school week. We also estimate there will be 137 fewer cases of obesity in Iowa in 2030 alone just by implementing these strategies to increase the active time during existing physical education classes.

This strategy also provides professional development opportunities for 912 teachers annually at 1,033 schools, enabling them to learn new instructional strategies to foster a fun and enjoyable environment where children can gain standards-based skills that support lifelong physical activity.4 Implementing the Active PE best practice guideline would ensure that most students in Iowa could benefit from high-quality PE time without requiring changes to staffing or school schedules. This could be incorporated into a comprehensive plan to help support healthy growth and development at an average cost of under $8 per student per year.

Strategies to ensure that students have access to high-quality physical education classes where more time is spent in active movement can help children get more physical activity.2 In addition to promoting a healthy weight, physical activity benefits students in other ways. Regular physical activity builds strong bones and muscles, reduces symptoms of anxiety and depression, and improves cognition.2 Additionally, evidence shows that when children are physically active, they tend to perform better in the classroom, have higher school attendance, and have fewer disciplinary problems.8 These other benefits are not quantified in this analysis but are key for children’s education and well-being.

References

  1. Child and Adolescent Health Measurement Initiative. 2018-2019 National Survey of Children’s Health (NSCH) data query. https://www.nschdata.org/browse/survey/results?q=7700&r=17. Accessed October 29, 2020.

  2. 2018 Physical Activity Guidelines Advisory Committee. 2018 Physical Activity Guidelines Advisory Committee Scientific Report. Washington, DC: U.S. Department of Health and Human Services, 2018.

  3. Institute of Medicine. Educating the Student Body: Taking Physical Activity and Physical Education to School. Washington, DC: National Academies Press, 2013.

  4. Lonsdale C, Rosenkranz RR, Peralta LR, Bennie A, Fahey P, Lubans DR. A systematic review and meta-analysis of interventions designed to increase moderate-to-vigorous physical activity in school physical education lessons. Preventive Medicine. 2013;56(2):152-161.

  5. Iowa Department of Public Health. Play Your Way. https://idph.iowa.gov/inn/play-your-way. Accessed November 30, 2020.

  6. Barrett JL, Gortmaker SL, Long MW, et al. Cost Effectiveness of an Elementary School Active Physical Education Policy. American Journal of Preventive Medicine. 2015;49(1);148-159.

  7. Cradock AL, Barrett JL, Kenney EL, et al. Using cost-effectiveness analysis to prioritize policy and programmatic approaches to physical activity promotion and obesity prevention in childhood. Preventive Medicine. 2017; 95;S17-S27.

  8. Centers for Disease Control and Prevention, Division of Population Health, National Center for Chronic Disease Prevention and Health Promotion. Physical Education. April 21, 2020. https://www.cdc.gov/healthyschools/physicalactivity/physical-education.htm. Accessed December 15, 2020.

Suggested Citation:

Hopkins H, Lange J, Olson E, Taylor-Watts S, Jenkins L, McCulloch S, Barrett J, Reiner J, and Cradock AL. Iowa: Active Physical Education (PE) {Issue Brief}. Iowa Department of Public Health, Iowa Department of Education, Des Moines, IA, and the CHOICES Learning Collaborative Partnership at the Harvard T.H. Chan School of Public Health, Boston, MA; April 2021. For more information, please visit www.choicesproject.org

The design for this brief and its graphics were developed by Molly Garrone, MA and partners at Burness.

This issue brief was developed at the Harvard T.H. Chan School of Public Health in collaboration with the Iowa Department of Public Health through participation in the Childhood Obesity Intervention Cost-Effectiveness Study (CHOICES) Learning Collaborative Partnership. This brief is intended for educational use only. This work is supported by The JPB Foundation and the Centers for Disease Control and Prevention (U48DP006376). The findings and conclusions are those of the author(s) and do not necessarily represent the official position of the Centers for Disease Control and Prevention or other funders.

← Back to Resources

Report: Hawaii: Sugary Drink Fee

Kids in Hawaii holding water bottles

The information in this report is intended to provide educational information on the cost-effectiveness of sugary drink excise fees.

Executive Summary

Continually rising rates of obesity represent one of the greatest public health threats facing the United States. Obesity has been linked to excess consumption of sugary drinks. Federal, state, and local governments have considered implementing taxes on sugary drinks to reduce consumption, reduce obesity, and provide a new source of government revenue.1-3 A fee on sugary drinks is a similar strategy to increase the price of sugary drinks, improve health, and provide revenue.

We modeled implementation of a state fee on sugary drinks at fees of $0.03/ounce, $0.02/ounce, and $0.01/ounce. This report summarizes the results of the $0.01/ounce fee. Results for additional fee rates can be found in Appendices 1 and 2 (please see pages 15 and 16 in the PDF of the report).

The $0.01/ounce fee is projected to be cost-saving and result in lower levels of sugary drink consumption, thousands of cases of obesity prevented, and tens of millions of dollars in health care cost savings. The fee is projected to save $3.05 in health care costs per dollar invested.

Background 

Although consumption of sugary drinks (defined as all drinks with added caloric sweeteners) has declined in recent years, adolescents and young adults in the United States consume more sugar than the Dietary Guidelines for Americans 2020-2025 recommend, with persistent racial/ethnic disparities.4-6 According to recent estimates, 56% of adults and 63% of youth in Hawaii report drinking soda.7-8 The percentage of adults in Hawaii who report drinking soda varies by racial and ethnic group, with more consumption reported by Native Hawaiian, Other Pacific Islander, and Black residents and less consumption reported by Chinese, Japanese, Filipino, and White residents.7 On average, teenagers in Hawaii consume more sugary drinks than other age groups, and nearly half of Hawaii teens (46%) drink one or more sugary drinks per day.9 Public health researchers have suggested that excess intake of sugary drinks may be one of the single largest drivers of the obesity epidemic in the U.S.10 An estimated 57% of adults and 28% of youth in Hawaii have overweight or obesity.8,10

Targeted marketing contributes to differences in consumption levels by income level. People who live in low-income areas are more exposed to advertisements for sugary drinks than those who live in high-income areas.11 Exposure to advertisements may influence sugary drink consumption levels in these communities, as low-income consumers on average consume more sugary drinks than higher income consumers.12

Consumption of sugary drinks increases the risk of chronic diseases through changes in body mass index (BMI), insulin regulation, and other metabolic processes.13-14 Randomized intervention trials and longitudinal studies have linked increases in sugary drink consumption to excess weight gain, diabetes, cardiovascular disease, and other health risks.13-14 There are persistent racial and ethnic disparities across both sugary drink consumption levels and rates of obesity and chronic disease.4-6 In light of this evidence, the Dietary Guidelines for Americans 2020-202515 recommend that individuals limit their sugary drink intake in order to manage body weight and reduce risk of chronic disease.

Targeted pricing strategies have emerged as one recommended strategy to reduce consumption of sugary drinks.16 This strategy has been studied by public health experts, who have drawn on the success of tobacco taxation and decades of economic research to model the estimated financial and health impact of a sugary drink tax.17-20 In Hawaii, rising costs of health care and insurance premiums are impacting businesses under Hawaii’s Prepaid Health Care Act.21 Passage of a sugary drink fee has been discussed as an effective strategy to reduce Hawaii’s health care costs.21-22 Public poll results in Hawaii show that there is support of a sugary drink fee as an approach to reduce obesity.22

This report aims to model the projected effect of a Hawaii sugary drink fee on health and disease outcomes over a decade. All drinks with added caloric sweeteners were considered subject to the fee, while 100% juice and milk products were considered exempt. The fee would be reflected in the posted price of sugary drinks, similar to an excise tax.

Key Terms
  • Fee: a consumption fee collected from retailers or distributors and is reflected in the posted price, like an excise tax; a sales tax in contrast is applied after purchase of the item

  • Pass-through rate: how much of the fee on distributors is passed on to consumers as an increase in shelf price; a percent ranging from 0% (none of the fee) to 100% (all of the fee)

  • Price elasticity of demand: how much consumer purchasing behavior changes following a change in price of an item

How would a fee work?

How would a fee work? A fee on distributors is passed through and leads to an increase in price. Price elasticity of demand leads to a decrease in demand. *Why is the fee structured like an excise tax rather than sales tax? Since an excise tax is mostly or entirely included in the price consumers see, it is more likely to affect consumer purchase behavior than a sales tax, which is added at the register.

MODELING FRAMEWORK: How fees on sugary drinks can lead to better health

A state fee is linked to change in BMI through change in sugary drink price and consumption   

Logic model: Sugary drink fee - Distributors are affected. Leads to an increase in sugary drink price, and consumers are affected. This leads to a decrease in sugary drink consumption, and consumers are affected. This finally leads to a decrease in BMI, and consumers are affected.

How does a fee on distributors affect the price paid by consumers?

Sugary drink fee affects distributors. This raises the price of sugary drinks, affecting the consumer.Since the cost of a sugary drink fee is incorporated directly into the beverage’s sticker price, a fee structured like an excise tax will likely influence consumer purchasing decisions more than a comparable sales tax that is added onto the item at the register. We assume 100% pass-through of the fee over 10 years and assume the fee would be adjusted annually for inflation. Our pass-through rate estimate is supported by empirical studies of excise taxes in Mexico and France that demonstrate near-complete pass-through rates to consumers.23 Short-term studies for the local tax in Berkeley indicate imperfect, or less than 100%, pass-through.2,24-25 The Hawaii Department of Health used an existing tool26 to collect beverage price data from 257 venues in Hawaii, including 74 supermarkets, 74 grocery stores, 90 limited-service venues, 18 fast food restaurants, and one gas station/convenience store. Retail prices were weighted by national share of purchase and consumption.26 The weighted price of sugary drinks in Hawaii was $0.07 per ounce. For example, a $0.01/ounce fee would raise the price of a 12-ounce can of soda from $0.84/can to $0.96/can.

An increase in sugary drink price affects consumers, and leads to a decrease in sugary drink consumption among consumers.

How does increasing the price of sugary drinks change individual sugary drink consumption?

To estimate current sugary drink consumption levels in Hawaii, we adjusted national estimates from the National Health and Nutrition Examination Survey (NHANES) 2011-2014 by race and ethnicity group using reported adult sugary drink consumption from the 2014 Hawaii Behavioral Risk Factor Surveillance System27 and youth sugary drink consumption from the 2012, 2013, and 2017 Hawaii Rethink Your Drink Study.28 How much consumers will change their purchases in response to price changes is called price elasticity for demand. We assume for every 10% increase in the price of sugary drinks, there will be a 12% reduction in purchases (a mean own-price elasticity of demand of -1.21).29 Recent research on the Berkeley, CA $0.01/ounce tax found a 21% reduction in sugary drink intake among low-income populations consistent with this estimate.24,30-33

A decrease in sugary drink consumption among consumers leads to a decrease in BMI among consumers.

What are the individual health effects of decreasing sugary drink consumption?

Research has shown that decreasing sugary drink consumption can have positive effects on health in adults and youth. We estimated the impact of a change in sugary drink intake on body mass index (BMI), accounting for dietary compensation, based on rigorous studies identified in evidence reviews.20 The relationship among adults was modeled based on the range of estimated effects from four large, multi-year longitudinal studies, which indicated that a one-serving reduction in sugary drinks was associated with a BMI decrease of 0.21 kg/m2 to 0.57 kg/m2 in adults over a 3-year period.14,34-36 Among youth, we used evidence from a double-blind randomized controlled trial conducted over 18 months, which found that an additional 8-ounce serving of sugary drinks led to a 2.2 pound greater weight gain.37

Reach

This strategy applies to all youth and adults in Hawaii. However, the model only looks at the effects on those 2 years of age and older.*

*BMI z-scores were used in our analyses, which are not defined for children under 2 years of age.

Cost

We assume the fee will incur start up and ongoing labor costs for fee administrators in the Hawaii Department of Health. To implement the strategy, the Hawaii Department of Health would need to process fee statements and conduct audits. Businesses would also need to prepare fee statements and participate in audits, which would require labor from private fee accountants. Cost information was drawn from the Hawaii state bottle recycling program and localities with planned or implemented fees on soft drinks.20,38 The cost and benefit estimates do not include expected revenue from the fee.

CHOICES Microsimulation Model

The CHOICES microsimulation model for Hawaii was used to calculate the costs and effectiveness over 10 years (2017–27). Cases of obesity prevented were calculated at the end of the model period in 2027. The model was based on prior CHOICES work,20,39 and created a virtual population of Hawaii residents using data from: the U.S. Census, American Community Survey, Behavioral Risk Factor Surveillance System,40 NHANES, National Survey of Children’s Health,41 the Medical Expenditure Panel Survey, multiple national longitudinal studies, and obesity prevalence data provided by the Hawaii Department of Health. Using peer-reviewed methodology, we forecasted what would happen to this virtual population with and without a sugary drink fee to model changes in disease and mortality rates and health care costs due to the fee.

CHOICES microsimulation model: start in 2027 and simulate to 2027. Start with a virtual population using data from the 2010 U.S. census. Then take into account population factors, such as population growth and BMI trends. Then take into account individual factors, such as body growth, personal characteristics (e.g. dietary intake), and smoking. Then, input the intervention (dietary intake/physical activity). Then, look at health status (obesity) and outcomes (obesity, health care costs, and mortality).


Results: $0.01/ounce State Fee on Sugary Drinks

Overall, the model shows that a sugary drink fee is cost-saving. Compared to the simulated natural history without a fee, the fee is projected to result in lower levels of sugary drink consumption, fewer cases of obesity, fewer deaths, and health care cost savings greater than $30 million over the 10-year period under consideration.

The estimated reduction in obesity attributable to the fee leads to lower projected health care costs, offsetting fee implementation costs and resulting in net cost savings. The difference between total health care costs with no strategy and lower health care costs with a strategy represent health care costs saved; these savings can be compared to the cost of implementing the fee to arrive at the metric of health care costs saved per $1 invested.

Results for additional fee rates can be found in Appendix 1 ($0.02/ounce fee) and Appendix 2 ($0.03/ounce fee). Please see pages 15 and 16 in the PDF of the report.

An infographic of results after the 1 cent state fee on sugary drinks.


Outcome $0.01/ounce fee
Mean
(95% uncertainty interval)
10 Year Reach* 1,690,000
(1,690,000; 1,690,000)
First Year Reach* 1,440,000
(1,440,000; 1,440,000)
Decrease in 12-oz Servings of Sugary Drinks per Person in the First Year* 55
(32; 117)
Mean Reduction in BMI Units per Person* -0.155
(-0.288; -0.040)
10 Year Intervention Implementation Cost per Person $5.86
($5.85; $5.87)
Total Intervention Implementation Cost Over 10 Years $9,900,000
($9,900,000; $9,900,000)
Annual Intervention Implementation Cost $990,000
($990,000; $990,000)
Health Care Costs Saved Over 10 Years $30,200,000
($10,500,000; $74,300,000)
Net Costs Difference Over 10 Years -$20,300,000
(-$64,400,000; -$581,000)
Quality Adjusted Life Years (QALYs) Gained Over 10 Years 1,790
(608; 4,530)
Years of Life Gained Over 10 Years 505
(157; 1,300)
Deaths Prevented Over 10 Years* 142
(38; 313)
Years with Obesity Prevented Over 10 Years 43,300
(14,900; 109,000)
Health Care Costs Saved per $1 Invested Over 10 Years $3.05
($1.06; $7.51)
Cases of Obesity Prevented in 2027* 6,040
(2,160; 15,100)
Cases of Childhood Obesity Prevented in 2027* 877
(321; 2,280)
Cost per Year with Obesity Prevented Over 10 Years Cost-saving
Cost per QALY Gained Over 10 Years Cost-saving
Cost per YL Gained Over 10 Years Cost-saving
Cost per Death Averted Over 10 Years Cost-saving

Uncertainty intervals are estimated by running the model 1,000 times, taking into account both uncertainty from data sources and virtual population projections, and calculating a central range in which 95 percent of the model results fell.
All metrics reported for the population over a 10-year period and discounted at 3% per year, unless otherwise noted.
*Not discounted.


There are differences in sugary drink consumption and obesity prevalence by race and ethnicity in Hawaii. The CHOICES model used Hawaii data to build a virtual Hawaii population. Without any strategy:

Sugary drink consumption is highest in the Native Hawaiian and Other Pacific Islander populations

White residents drink 271 12 ounce servings of sugary drinks per year per person; Native Hawaiian residents drink 356 12 ounce servings of sugary drinks per year per person; Filipino residents drink 337 12 ounce servings of sugary drinks per year per person; Japanese residents drink 262 12 ounce servings of sugary drinks per year per person; Other Asian residents drink 319 12 ounce servings of sugary drinks per year per person; Other Pacific Islander residents drink 524 12 ounce servings of sugary drinks per year per person; Residents of Other races drink 325 12 ounce servings of sugary drinks per year per person; The average resident drinks 319 12 ounce servings of sugary drinks per year per person

Obesity prevalence is highest in the Native Hawaiian and Other Pacific Islander populations

14% of White residents have obesity; 30% of Native Hawaiian residents have obesity; 20% of Filipino residents have obesity; 13% of Japanese residents have obesity; 9% of Other Asian residents have obesity; 49% of Pacific Islander residents have obesity; 21% of residents of Other races have obesity; On average, 20% of Hawaii residents have obesity

Results: $0.01/ounce State Fee on Sugary Drinks By Race and Ethnicity Groups

Outcome White
Mean
(95% uncertainty interval)
Native Hawaiian
Mean
(95% uncertainty interval)
Filipino
Mean
(95% uncertainty interval)
Japanese
Mean
(95% uncertainty interval)
Other Asian
Mean
(95% uncertainty interval)
Other Pacific Islander 
Mean
(95% uncertainty interval)
Other
Mean
(95% uncertainty interval)
Decrease in 12-oz Serving of Sugary Drinks per Person in the First Year* 47
(27; 99)
62
(36; 132)
58
(34; 123)
45
(26; 97)
55
(32; 118)
91
(53; 192)
56
(33; 120)
QALYS Gained Over 10 Years 318
(91; 976)
491
(144; 1,350)
336
(98; 953)
197
(55; 548)
104
(28; 296)
153
(40; 440)
189
(54; 535)
Years of Life Gained Over 10 Years 88
(13; 276)
127
(27; 356)
111
(22; 327)
64
(8; 192)
33
(2; 99)
40
(3; 133)
41
(7; 127)
Years with Obesity Prevented Over 10 Years 6,720
(2,010; 20,800)
13,160
(3,930; 37,100)
6,900
(2,110; 19,200)
3,580
(1,080; 9,950)
1,970
(611; 5,470)
5,260
(1,670; 14,400)
5,730
(1,750; 16,050)
Cases of Obesity Prevented in 2027* 977
(293; 2,950)
1,790
(536; 4,980)
969
(296; 2,710)
542
(161; 1,530)
290
(87; 799)
671
(202; 1,880)
803
(248; 2,260)
Cases of Childhood Obesity Prevented in 2027* 136
(38; 450)
396
(121; 1,100)
158
(47; 443)
52
(14; 150)
28
(7; 80)
22
(70; 608)
197
(58; 551)

Uncertainty intervals are estimated by running the model 1,000 times, taking into account both uncertainty from data sources and virtual population projections, and calculating a central range in which 95 percent of the model results fell.
All metrics reported for the population over a 10-year period and discounted at 3% per year, unless otherwise noted.
*Not discounted.

SNAPSHOT IN 2027

Cases of obesity prevented in Hawaii from a $0.01/ounce state fee on sugary drinks by race and ethnicity group*

In 2027, 977 cases of obesity would be prevented among White residents; 1,790 cases of obesity would be prevented among Native Hawaiian residents; 969 cases of obesity would be prevented among Filipino residents; 542 cases of obesity would be prevented among Japanese residents; 290 cases of obesity would be prevented among Other Asians residents; 671 cases of obesity would be prevented among Other Pacific Islander residents; and 803 cases of obesity would be prevented among residents of other races

Some groups are projected to experience larger declines in consumption of servings* of sugary drinks per person in Hawaii in the first year of fee implementation

In the first year of fee implementation, White residents would drink 47 fewer 12 ounce servings of sugary drinks per person; Native Hawaiian residents would drink 62 fewer 12 ounce servings of sugary drinks per person; Filipino residents would drink 58 fewer 12 ounce servings of sugary drinks per person; Japanese residents would drink 45 fewer 12 ounce servings of sugary drinks per person; Other Asian residents would drink 55 fewer 12 ounce servings of sugary drinks per person; Other Pacific Islander residents would drink 91 fewer 12 ounce servings of sugary drinks per person; and Residents of Other races would drink 56 fewer 12 ounce servings of sugary drinks per person

Impact on Diabetes

We estimated the impact of the fee-induced reduction in sugary drink intake on diabetes incidence for adults ages 18-79 years using a published meta-analysis of the relative risk of developing diabetes due to a one-serving change in sugary drink consumption42 as well as state-level estimates of diabetes incidence43 and prevalence.44 On average, each 8.5 ounce serving of sugary drinks per day increases the risk of diabetes by 18%.42$0.01 per ounce state fee on sugary drinks would lead to a 6% reduction in diabetes incidence and 390 cases of diabetes would be prevented; in addition, there would be $1.15 million in dental decay treatment total cost savings over 10 years (societal), and $173,000 in dental decay treatment total cost savings over 10 years (Medicaid)

In Hawaii, we estimated that the proposed sugary drink fee would lead to a 6% reduction in diabetes incidence in the sugary drink fee models. Impact on diabetes incidence was calculated over a one-year period once the fee reaches its full effect. Impact on diabetes was calculated based on summary results from the model, not directly via microsimulation.

Impact on Tooth Decay

We estimated the impact of a sugary drink fee on tooth decay cost using a longitudinal analysis of the relationship between intake of sugars and tooth decay in adults. On average, for every 10 grams higher intake of sugar per day, there is an increase in decayed, missing, and filled teeth (i.e. tooth decay) of approximately 0.10 over 10 years.45 There are many studies showing a similar relationship between higher intake of sugars and tooth decay in children and youth46 and thus we assume the same relationship as found in adults.

We used 2018 Hawaii Department of Human Services Med-Quest procedure code47 data to estimate a Medicaid cost of treating tooth decay as: $234 for a permanent crown on Oahu or $562 on neighboring islands, and $39 for a filling on Oahu or $55 on neighboring islands. These codes reflect treatment for one surface and do not reflect higher reimbursement rates for multi-surface treatment, temporary crowns, or potential flat fee schedules. Based on analysis of data on tooth decay, fillings, and crowns for the U.S. population from NHANES 1988-1994 (the last year crowns and fillings were separately reported),48 we estimate that 78.9% of tooth decay in children and 43.5% of tooth decay in adults are treated. Using this same data set, we estimate that 97% of treatment for children is fillings and 82.5% of treatment for adults is fillings.

To estimate Medicaid-specific savings in costs of dental treatment, we used state estimates of the numbers of people enrolled in Medicaid and CHIP and the proportion receiving Medicaid dental services. Because of limited Medicaid dental coverage for adults in Hawaii, only children are included in the Medicaid-specific calculations. In Hawaii, we estimated that a $0.01/ounce fee would lead to a total of $173,000 in Medicaid savings over a period of 10 years due to a reduction in treatment of tooth decay. The Medicaid reimbursement fee estimates may underestimate the total cost savings of tooth decay treatment projected here as dental providers may charge higher amounts to patients.

Expected Yearly Sugary Drink Fee Revenue

The annual revenue from a state fee on sugary drinks is likely to be substantial. According to the Rudd Center Revenue Calculator for Sugary Drink Taxes49 a $0.01/ounce fee in Hawaii could raise as much as $42.9 million in 2020.

Actual fee revenue may be lower than these projected estimates due to several factors. The Rudd Center Revenue estimates are based on regional sales data adjusted for state or city specific demographics;50 sales data for specific states and/or cities within those regions may vary from the regional average. Retailers may have inventories of sugary drinks obtained before the fee was implemented. There may also be some distributors/manufacturers that are non-compliant with the fee. The Rudd Center notes that their revenue projections “should be adjusted downward by 10% – 30%.”49

Rudd Center Revenue Projections (2020)

$0.01/oz fee on sugary drinks

$0.02/oz fee on sugary drinks

$0.03/oz fee on sugary drinks

Assuming 100% of Rudd Center projections

$42.9 million

$65.8 million

$68.8 million

Assuming 90% of Rudd Center projections

$38.6 million

$59.2 million

$62.0 million

Assuming 70% of Rudd Center projections

$30.0 million

$46.1 million

$48.2 million

Considerations for Health Equity

Concerns have been raised regarding the impact of the fee on households with low-income, because lower-income populations tend to consume more sugary drinks.12 Economic studies indicate that with a sugary drink tax, consumers will buy less of these products.29 This change in purchasing is substantial, so that consumers can be expected to spend less on sugary drinks after a fee is implemented. Using sales data from the Rudd Center Revenue Calculator for Sugary Drink Taxes,49 along with local price data,26,28 we project that individuals and households in Hawaii will spend less money on sugary drinks after a $0.02 per oz fee: about $104 less per year per person, and $314 per year less for an average household. This would free up disposable income for other consumer purchases. A typical consumer in Hawaii who continues to consume these beverages after the fee is in place would be expected to pay fees of about $2.50 per week, or $129/year.

In addition to these changes in spending, health benefits are projected to be greatest among low-income individuals. We project that more health benefits from this policy will accrue to low-income consumers; the same is true for a number of racial and ethnic groups. As noted above, in Hawaii, the percentage of adults who drink one or more soda per day varies by racial and ethnic group.7 Under the proposed fee, we project that Native Hawaiian, Other Pacific Islander, and Filipino Hawaii residents would see more cases of obesity prevented than expected for the average Hawaii resident. On that basis, the proposed fee should decrease disparities in obesity outcomes and improve health equity.

These expected changes in consumption and health outcomes have led economists to conclude that low-income populations benefit substantially from sugary drink taxes.51

Savings Per Year

$0.01/oz fee on sugary drinks

$0.02/oz fee on sugary drinks

$0.03/oz fee on sugary drinks

Individual savings on sugary drinks

$36

$104

$203

Household savings on sugary drinks

$109

$314

$614

Total Hawaii savings on sugary drinks

$20.6 million

$59.4 million

$116 million

Implementation Considerations

Revenue raised from a sugary drink fee can be reinvested in low-income communities. For instance, in Berkeley, CA, sugary drink fee revenue has been allocated for spending on school and community programs, many serving low-income populations or communities of color, to promote healthy eating and diabetes and obesity preventions.52 Public support for such fees generally increases with earmarking for preventive health activities.53

There is opposition from the food and beverage industry, which spends billions of dollars promoting their products.54 Relatively small beverage excise taxes are currently applied across many states. The proposed fee is likely to be sustainable if implemented based on the successful history of tobacco cigarette stamp excise taxes. There is potential for a shift in social norms of sugary drink consumption based on evidence from tobacco control tax and regulatory efforts.55 This shift in norms can be facilitated by assessing sugary drinks, which reduces the attractiveness of non-caloric beverages and discourages consumers from selecting any sugary drink options when making beverage decisions.

Conclusion

We project that the proposed fee policy will prevent thousands of cases of childhood and adult obesity, prevent new cases of diabetes, increase healthy life years, and save more in future health care costs than it costs to implement. Savings in future health care costs would lead to a slowing of rising health care premium costs for employers and individuals across Hawaii. Revenue from the fee can be used for education and health promotion efforts. Implementing the fee could also serve as a powerful social signal to reduce sugar consumption.

Citation

Irvin L, Inoue K, Bowie A, Ching L, Starr R, Ryan J, White BS, La Chica T, Gortmaker SL, Long MW, Ward  ZJ, Giles CM, Barrett JL, Resch SC, Greatsinger A, Garrone ME, Tao H, Flax CN, Cradock AL. Hawaii: Sugary Drink Fee [Report]. Hawaii Department of Health, Hawaii Public Health Institute, Honolulu, HI, and the CHOICES Learning Collaborative Partnership at the Harvard T.H. Chan School of Public Health, Boston, MA; March 2021. For more information, please visit www.choicesproject.org

The design for this report and its graphics were developed by Molly Garrone, MA and partners at Burness.

Funding

Funded by The JPB Foundation. Results are those of the authors and not the funders.

For further information, contact choicesproject@hsph.harvard.edu

Appendices

Results for additional fee rates can be found in Appendix 1 ($0.02/ounce fee) and Appendix 2 ($0.03/ounce fee). Please see pages 15 and 16 in the PDF of the report.

← Back to Resources

References
  1. American Public Health Association Taxes on Sugar-Sweetened Beverages. 2012.
  2. Falbe J, Rojas N, Grummon AH, Madsen KA. Higher Retail Prices of Sugar-Sweetened Beverages 3 Months After Implementation of an Excise Tax in Berkeley, California. American Journal of Public Health. 2015;105(11):2194-2201.
  3. World Health Organization. Global action plan for the prevention and control of noncommunicable diseases 2013–2020 [Internet]. Geneva: WHO. Updated appendix 3, “Best buys” and other recommended interventions for the prevention and control of noncommunicable diseases; [updated 2017; cited 2019 Sep 17]. Available from: http://www.who.int/ncds/management/WHO_Appendix_BestBuys.pdf
  4. Kit BK, Fakhouri THI, Park S, Nielsen SJ, Ogden CL. Trends in sugar-sweetened beverage consumption among youth and adults in the United States: 1999-2010. American Journal of Clinical Nutrition. 2013;98(1):180-188.
  5. Bleich SN, Vercammen KA, Koma JW, Li ZH. Trends in Beverage Consumption Among Children and Adults, 2003-2014. Obesity. 2018;26(2):432-441.
  6. Vercammen KA, Moran AJ, Soto MJ, Kennedy-Shaffer L, Bleich SN (2020). Decreasing Trends in Heavy Sugar-Sweetened Beverage Consumption in the United States, 2003-2016. Journal of the Academy of Nutrition and Dietetics. 2020 Dec;120(12):1974-1985.e5.
  7. Hawaii Health Data Warehouse, Hawaii State Department of Health. Behavioral Risk Factor Surveillance System. 2017.
  8. Hawaii Health Data Warehouse, State of Hawaii. Hawaii School Health Survey: Youth Risk Behavior Survey Module. 2017.
  9. Hawaii State Department of Health. (2013). State Department of Health Releases Data on Teen-Focused Obesity Prevention Campaign [Press release]. Retrieved from http://health.hawaii.gov/news/files/2013/05/13-063-DOH-Releases-Data-on-Teen-Focused-Obesity-Prevention-Campaign.pdf
  10. Hawaii Health Data Warehouse, Hawaii State Department of Health. Behavioral Risk Factor Surveillance System. 2011-2016.
  11. Yancey AK, Cole BL, Brown R, et al. A cross-sectional prevalence study of ethnically targeted and general audience outdoor obesity-related advertising. Milbank Quarterly. 2009;87(1):155-184.
  12. Han E, Powell LM. Consumption patterns of sugar-sweetened beverages in the United States. Journal of the Academy of Nutrition and Dietetics. 2013;113(1):43-53.
  13. Malik VS, Pan A, Willett WC, Hu FB. Sugar-sweetened beverages and weight gain in children and adults: a systematic review and meta-analysis. American Journal of Clinical Nutrition. 2013;98(4):1084-1102.
  14. Chen L, Caballero B, Mitchell DC, et al. Reducing Consumption of Sugar-Sweetened Beverages Is Associated with Reduced Blood Pressure: A Prospective Study among U.S. Adults. Circulation. 2010;121(22):2398-2406.
  15. U.S. Department of Health and Human Services, U.S. Department of Agriculture. 2020 – 2025 Dietary Guidelines for Americans. December 2020.
  16. IOM (Institute of Medicine), National Research Council. Local Government Actions to Prevent Childhood Obesity. Washington, DC: The National Academies Press; 2009.
  17. Chaloupka F, Powell L, Chriqui J. Sugar-sweetened beverage taxes and public health: A Research Brief. Minneapolis, MN2009.
  18. Brownell KD, Farley T, Willett WC, et al. The Public Health and Economic Benefits of Taxing Sugar-Sweetened Beverages. New England Journal of Medicine. 2009;361(16):1599-1605.
  19. Long M, Gortmaker S, Ward Z, et al. Cost Effectiveness of a Sugar-Sweetened Beverage Excise Tax in the U.S. American Journal of Preventive Medicine. 2015;49(1):112-123.
  20. Gortmaker SL, Wang YC, Long MW, et al. Three Interventions That Reduce Childhood Obesity Are Projected To Save More Than They Cost To Implement. Health Affairs. 2015;34(11):1932-1939.
  21. Health Care Concerns. Honolulu Star-Advertiser. Jan 14, 2018.
  22. New Poll Shows Strong Support For Policies That Reduce Sugary Drink Consumption by Keiki [press release]. 2018.
  23. Colchero MA, Salgado JC, Unar-Munguia M, Molina M, Ng SW, Rivera-Dommarco JA. Changes in Prices After an Excise Tax to Sweetened Sugar Beverages Was Implemented in Mexico: Evidence from Urban Areas. PLOS One. 2015;10(12):11.
  24. Falbe J, Thompson HR, Becker CM, Rojas N, McCulloch CE, Madsen KA. Impact of the Berkeley Excise Tax on Sugar-Sweetened Beverage Consumption. American Journal of Public Health. 2016;106(10):1865-1871.
  25. Ng S, Silver L, Ryan-Ibarra S, et al. Berkeley Evaluation of Soda Tax (BEST) Study Preliminary Findings. Presentation at the annual meeting of the  American Public Health Association. Paper presented at: Presentation at the annual meeting of the  American Public Health Association; November, 2015; Chicago, IL.
  26. Powell L, Isgor z, Rimkus L, Chaloupka F. Sugar-sweetened beverage prices: Estimates from a national sample of food outlets. Chicago, IL: Bridging the Gap Program, Health Policy Center, Institute for Health Research and Policy, University of Illinois at Chicago; 2014.
  27. Centers for Disease Control and Prevention (CDC), Hawaii State Department of Health. Hawaii Behavioral Risk Factor Surveillance System Survey Data. Atlanta, Georgia: U.S Department of Health and Human Services, National Center for Chronic Disease Prevention and Health Promotion, Division of Population Health; 2014.
  28. Hawaii State Department of Health, personal communication, 2018.
  29. Powell LM, Chriqui JF, Khan T, Wada R, Chaloupka FJ. Assessing the Potential Effectiveness of Food and Beverage Taxes and Subsidies for Improving Public Health: A Systematic Review of Prices, Demand and Body Weight Outcomes. Obesity Reviews. 2013;14(2):110-128.
  30. Cawley J, Frisvold D, Hill A, Jones D. The impact of the Philadelphia beverage tax on purchases and consumption by adults and children. Journal of Health Economics. 2019;67:102225.
  31. Lee MM, Falbe J, Schillinger D, Basu S, McCulloch CE, Madsen KA. Sugar-Sweetened Beverage Consumption 3 Years After the Berkeley, California, Sugar-Sweetened Beverage Tax. American Journal of Public Health. 2019;109(4):637-639.
  32. Zhong Y, Auchincloss AH, Lee BK, Kanter GP. The Short-Term Impacts of the Philadelphia Beverage Tax on Beverage Consumption. American Journal of Preventive Medicine. 2018;55(1):26-34.
  33. Silver LD, Ng SW, Ryan-Ibarra S, et al. Changes in prices, sales, consumer spending, and beverage consumption one year after a tax on sugar-sweetened beverages in Berkeley, California, US: A before-and-after study. PLoS Medicine. 2017;14(4):e1002283
  34. Mozaffarian D, Hao T, Rimm EB, Willett WC, Hu FB. Changes in Diet and Lifestyle and Long-Term Weight Gain in Women and Men. New England Journal of Medicine. 2011;364(25):2392-2404.
  35. Palmer JR, Boggs DA, Krishnan S, Hu FB, Singer M, Rosenberg L. Sugar-Sweetened Beverages and Incidence of Type 2 Diabetes Mellitus in African American Women. Archives of Internal Medicine. 2008;168(14):1487-1492.
  36. Schulze MB, Manson JE, Ludwig DS, et al. Sugar-sweetened beverages, weight gain, and incidence of type 2 diabetes in young and middle-aged women. Journal of the American Medical Association. 2004;292(8):927-934.
  37. de Ruyter JC, Olthof MR, Seidell JC, Katan MB. A trial of sugar-free or sugar-sweetened beverages and body weight in children. New England Journal of Medicine. 2012;367(15):1397-1406.
  38. Healthy Food America. Implementing Sugary Drink Taxes: Outreach, Collection, and Fighting Industry Litigation. [Webinar]. 2017; http://www.healthyfoodamerica.org/webinars
  39. Ward ZJ, Long MW, Resch SC, Giles CM, Cradock AL, Gortmaker SL. Simulation of Growth Trajectories of Childhood Obesity into Adulthood. New England Journal of Medicine. 2017;377(22):2145-2153.
  40. Ward ZJ, Long MW, Resch SC, et al. Redrawing the US Obesity Landscape: Bias-Corrected Estimates of State-Specific Adult Obesity Prevalence. PLoS One. 2016;11(3):13.
  41. Long MW, Ward Z, Resch SC, et al. State-level estimates of childhood obesity prevalence in the United States corrected for report bias. International Journal of Obesity. 2016;40(10):1523-1528.
  42. Imamura F, O’Connor L, Ye Z, Mursu J, Hayashino Y, Bhupathiraju SN, Forouhi NG. Consumption of sugar sweetened beverages, artificially sweetened beverages, and fruit juice and incidence of type 2 diabetes. British Journal of Sports Medicine. 2016 Apr;50(8):496-504
  43. Hawaii Department of Health, 2011-2016 Hawaii Behavioral Risk Factor Surveillance System (BRFSS), personal communication, 2018.
  44. Hawaii Department of Health, Hawaii Health Data Warehouse, Behavioral Risk Factor Surveillance System (BRFSS), 2011-2014.
  45. Bernabe E, Vehkalahti MM, Sheiham A, Lundqvist A, Suominen AL. The Shape of the Dose-Response Relationship between Sugars and Caries in Adults. Journal of Dental Research. 2016;95(2):167-172.
  46. Sheiham A, James WPT. A new understanding of the relationship between sugars, dental caries and fluoride use: implications for limits on sugars consumption. Public Health Nutrition. 2014;17(10):2176-2184.
  47. Hawaii Department of Human Services. Dental Fee Schedule. 2018.
  48. Ward Z, et al. NHANES III Dental Examination: An Incisive Report. Unpublished report; 2018.
  49. UConn Rudd Center for Food Policy & Obesity. Sugary Drink Tax Calculator. https://uconnruddcenter.org/tax-calculator. Accessed February 2021.
  50. UCONN Rudd Center. Data and Assumptions (Tax Calculator Revision, March 2017). 2017.
  51. Allcott H, Lockwood BB, Taubinsky D. Should We Tax Sugar-Sweetened Beverages? An Overview of Theory and Evidence. Journal of Economic Perspectives. 2019; 33 no 3: 202–27.
  52. Lynn J. City Council votes to allocate ‘soda tax’ revenue to school district, city organizations. The Daily Californian. Jan. 20, 2016.
  53. Friedman R. Public Opinion Data, 2013. In. New Haven, CT: Yale Rudd Center for Food Policy & Obesity; 2013.
  54. Federal Trade Commission. A review of food marketing to children and adolescents: follow-up report. Washington, DC Dec 2012.
  55. Frieden TR, Mostashari F, Kerker BD, Miller N, Hajat A, Frankel M. Adult tobacco use levels after intensive tobacco control measures: New York City, 2002-2003. American Journal of Public Health. 2005;95(6):1016-1023.

Report: California: A Sugary Drink Excise Tax

The information in this report is intended to provide educational information on the cost-effectiveness of sugary drink excise taxes.

Executive Summary

Health impact of a $0.02 per ounce state excise tax on sugary drinks; 69 fewer 12 ounce sugary drinks servings per person in the first year; 198,000 cases of obesity prevent in 2030; 13,900 cases of diabetes prevented; 502,000 reduction in decayed, missing, or filled teeth over 10 years (Medi-Cal); Cost impact of a $0.02 per ounce state excise tax on sugary drinks; $46.89 health care costs saved per $1 invested; $1.79 billion saved in net costs; decrease in spending on sugary drinks per household in the first year is $142; $395.million saved in dental decay treatment costs over 10 years (Medi-Cal)In California, health disparities and inequities persist for specific subsets of the population – the reasons for this are deep-seated and multi-faceted. Sugary drink consumption is one health behavior for which disparities exist, and it has been linked to excess weight gain, obesity, and the incidence of type 2 diabetes, heart disease, and cancer. Federal, state, and local governments have considered excise taxes on sugary drinks to reduce consumption, reduce obesity and associated chronic disease, and provide a new source of government revenue.1,2,3 In California, statewide legislative measures to introduce sugary drink excise taxes have been proposed for a number of years in efforts to improve the health of Californians and reduce inequities, but none have passed.4

We modeled the implementation of a state excise tax on sugary drinks in California at a tax rate of $0.02/ounce. CHOICES cost-effectiveness analysis compared the costs and outcomes over a 10-year time horizon (2020-2030) of implementing a tax with the costs and outcomes associated with not implementing a tax.

The tax modeled is projected to be cost-saving (that is, the tax saves more in future health care costs than it costs to implement even absent the potential revenues). The tax is projected to decrease sugary drink consumption among California residents, prevent nearly 200,000 cases of obesity, and save more than 1.8 billion dollars in health care costs. People who consume sugary drinks are expected to spend less on these drinks with the tax in place. We also project that non-Latino Black/African American and Latino California residents will experience even greater health benefits than the average resident after the tax is implemented. These results are summarized below and in the complete report.


Background 

In California, health disparities and inequities persist for specific subsets of the population – the reasons for this are deep-seated and multi-faceted including systems that perpetuate the unequal distribution of power and resources along racial lines.5 Overconsumption of added sugars is common, with more than half of the United States population ages two years and older exceeding the daily recommended limit for added sugars put forth in the 2015-2020 Dietary Guidelines for Americans.6 Sugary drinks (defined as all drinks with added caloric sweeteners) are the number one source of added sugars that Americans consume.6In this report, Asian, Black/African American, White, and Other race/ethnicity groups refer to people of non-Latino ethnicity. Other includes people of Native Hawaiian and Pacific Islander, American Indian and Alaska Native, and two or more races.

According to recent estimates, 40% of California residents drink at least one serving of sugary drinks daily.7 Higher than average sugary drink consumption levels are common among Latino and Black/African American Californians.7 In 2018, the beverage industry spent $1 billion to advertise sugary drinks in television, digital platforms (internet and mobile), radio, magazines, newspapers, coupons, and outdoor venues in order to drive preferences and purchases of unhealthy beverages.8 Beverage companies frequently target their sugary drink advertising towards youth, and are more likely to target Black/African American and Latino youth. Additionally, Black/African American and Latino populations are less likely to be the audience for marketing of healthy drinks like water.8

Strong evidence links increased consumption of sugary drinks to higher risk for obesity and other diseases that are tied to what people eat, such as type 2 diabetes,9,10 and the prevalence of these diseases is higher among people with lower income and Latino and Black/African American Californians.7,11 An estimated 37% of adults11 and 21% of youth12 in California have obesity. If current trends continue, 42% of adults in the state will have obesity by 2030.11

Taxes have emerged as a promising strategy to reduce consumption of sugary drinks. In addition to the potential of a sugary drink tax to reduce obesity, it has cost implications as well. This report models the projected effect of a sugary drink excise tax on health, disease outcomes, and health care cost savings over the next decade.

Key Terms
  • Cost-saving: saves more in future health care costs than it costs to implement (not considering the potential revenues)

  • Excise tax: a consumption tax collected from retailers or distributors; it is reflected in the posted price (a sales tax in contrast is applied after purchase of the item)

  • Pass-through rate: how much of the excise tax on distributors is passed on to consumers as an increase in shelf price; a percent ranging from 0% (none of the tax) to 100% (all the tax), or even greater than 100% (more than the amount of the tax)

  • Price elasticity of demand: how much consumer purchasing behavior changes following a change in price of an item

Projected Impact of a Sugary Drink Excise Tax in California

We modeled implementation of a California excise tax on sugary drinks, at a tax rate of $0.02/ounce. All drinks with added caloric sweeteners were considered to be taxed, while 100% juice, milk products, and beverages with fewer than 25 kcals per 12 fluid ounces were considered exempt.


Results: What did we find?

We project that implementation of a state excise tax on sugary drinks only, at a tax rate of $0.02/ounce, has a 100% likelihood of being cost-saving. It will prevent more than 195,000 cases of childhood and adult obesity, prevent new cases of diabetes, increase healthy life years, improve health equity, and save more in future health care costs than it will cost to implement. Implementing the tax could also serve as a powerful social signal to reduce sugar consumption. Model results are presented as the most likely estimate as well as a likely range. The likely range is an uncertainty interval that is estimated by considering uncertainty from data sources and population projections and calculating a central range in which 95 percent of these model results fell.


How many people would be affected by the tax?

This can be thought of as reach or the number of people affected by the strategy. Based on our modeling, the table below presents the estimated number of people affected by the tax in the first year and the number of people affected by the tax over ten years.

Number of people affected by the tax

Likely Range

First Year Population Reach

38.0 million

37.9 million; 38.1 million

Ten Year Population Reach

42.2 million

42.0 million; 42.5 million

The Likely Range is a 95% uncertainty interval estimated by running the model 1,000 times, taking into account uncertainty from data sources and population projections, and calculating a central range in which 95 percent of these model results fell.

What effect would the tax have on sugary drink consumption and spending?

Compared to projections of sugary drink consumption without a tax, the tax is projected to result in lower levels of sugary drink consumption. We project a 90% likelihood that individuals and households who purchase sugary drinks will spend less on sugary drinks after the tax is implemented, even though sugary drink prices will be higher with the tax. 

Impact of the tax on sugary drink consumption & spending

Likely Range

Decrease in 12-oz Servings of Sugary Drinks per Person in the First Year

69

42; 125

Decrease in Spending on Sugary Drinks in the First Year per Person Consuming Sugary Drinks

$48

-$10; $170

90% likelihood of decrease in spending

Decrease in Spending on Sugary Drinks in the First Year per Household

$142

-$29; $502

90% likelihood of decrease in spending

Decrease in Spending on Sugary Drinks in the First Year Overall in California

$1.09 billion

-$220 million; $3.88 billion

90% likelihood of decrease in spending

The Likely Range is a 95% uncertainty interval estimated by running the model 1,000 times, taking into account uncertainty from data sources and population projections, and calculating a central range in which 95 percent of these model results fell.

Average Annual Pre-Tax Sugary Drink Consumption Per Person in California by Race/Ethnicity

While Californians, on average, consume 251 servings of sugary drinks each in a year, higher than average sugary drink consumption levels are common among Latino and Black/African American Californians. Asian Californians drink an average of 162 12 ounce servings of sugary drinks per person per year; Black/African American Californians drink an average of 372 12 ounce servings of sugary drinks per person per year; Latino Californians drink an average of 312 12 ounce servings of sugary drinks per person per year; White Californians drink an average of 191 12 ounce servings of sugary drinks per person per year; and Californians of Other races drink an average of 254 12 ounce servings of sugary drinks per person per year
DATA SOURCES: California Health Interview Survey 2011-2017, NHANES 2011-2016, UConn Rudd Center for Food Policy & Obesity Sugary Drink Tax Calculator 2020; Analysis by CHOICES Project, 2020.
Each serving is 12 ounces.

While Californians, on average, consume 251 servings of sugary drinks each in a year, higher than average sugary drink consumption levels are common among Latino and Black/African American Californians.

Post-Tax Decrease in Sugary Drink Consumption Per Person in California by Race/Ethnicity*

With a tax, sugary drink consumption would decrease the most among Latino and Black/African American Californians. On average, each Latino Californian would reduce consumption by 85 servings per year and each Black/African American Californian would reduce consumption by 102 servings per year. Asian Californians would reduce consumption an average of 44 12 ounce servings of sugary drinks per person per year; Black/African American Californians would reduce consumption an average of 102 12 ounce servings of sugary drinks per person per year; Latino Californians would reduce consumption an average of 85 12 ounce servings of sugary drinks per person per year; White Californians would reduce consumption an average of 52 12 ounce servings of sugary drinks per person per year; and Californians of Other races would reduce consumption an average of 69 12 ounce servings of sugary drinks per person per year

*In the first year following an excise tax of $0.02/ounce on sugary drinks.

Each serving is 12 ounces.

With a tax, sugary drink consumption would decrease the most among Latino and Black/African American Californians. On average, each Latino Californian would reduce consumption by 85 servings per year and each Black/African American Californian would reduce consumption by 102 servings per year.

Impact of the tax on sugary drink consumption, by race and ethnicity

Outcome

Asian

Mean

Likely Range

Black/African American

Mean

Likely Range

Latino

Mean

Likely Range

White

Mean

Likely Range

Other*

Mean

Likely Range

Decrease in 12-oz Servings of Sugary Drinks per Person in the First Year

44

27; 81

102

62; 186

85

52; 154

52

32; 98

69

42; 124

The Likely Range is a 95% uncertainty interval estimated by running the model 1,000 times, taking into account uncertainty from data sources and population projections, and calculating a central range in which 95 percent of these model results fell.
*Other includes people of Native Hawaiian and Pacific Islander, American Indian and Alaska Native, and two or more races.

What effect would the tax have on obesity and related health outcomes, overall and by race/ethnicity?

Compared to projections of obesity and related health outcomes without a tax, the tax is projected to result in fewer cases of obesity and fewer deaths over the 10-year period under consideration. Under the proposed tax, Black/African American Californians will experience a 39% higher than average reduction in obesity prevalence, and Latino Californians will experience a 33% higher than average reduction in obesity prevalence.

Impact of the tax on obesity and related health outcomes

Likely Range

Quality Adjusted Life Years (QALYs) Gained Over 10 Years

58,200

25,000; 130,000

Years of Life Gained Over 10 Years

14,600

5,410; 34,500

Deaths Prevented Over 10 Years*

4,280

1,680; 10,000

Years with Obesity Prevented Over 10 Years

1,410,000

696,000; 2,770,000

Cases of Obesity Prevented in 2030*

198,000

96,700; 394,000

Cases of Childhood Obesity Prevented in 2030*

33,700

12,500; 74,800

The Likely Range is a 95% uncertainty interval estimated by running the model 1,000 times, taking into account uncertainty from data sources and population projections, and calculating a central range in which 95 percent of these model results fell.
Costs and health outcomes are discounted at 3% per year, unless otherwise noted. Discounting estimates the present value of costs and health outcomes that are spent or received in the future, given that they are worth more today than they would be tomorrow.
*Not discounted.

$0.02 per ounce state excise tax on sugary drinks would lead to 198,000 cases of obesity prevented in 2030 and 33,700 cases of childhood obesity prevented in 2030


Pre-Tax Obesity Prevalence in California by Race/Ethnicity

Nearly half of Latino (43.5%) and Black/African American (43.6%) Californians have obesity, while smaller percentages of Asian (16.1%), White (33.2%), and Californians of another race (33.9%) have obesity.
DATA SOURCES: California FitnessGram 2013-2017, NHANES 2011-2016, NSCH 2003-2018; Analysis by CDPH and the CHOICES Project, 2020.

Nearly half of Latino (43.5%) and Black/African American (43.6%) Californians have obesity, while smaller percentages of Asian (16.1%), White (33.2%), and Californians of another race (33.9%) have obesity.

Post-Tax Cases of Obesity Prevented in 2030 in California by Race/Ethnicity*

A tax in California could prevent 198,000 cases of obesity in 2030. 58% of prevented obesity cases will be among Latino Californians, while they represent 42% of the population. 8% of prevented obesity cases will be among Black/African American Californians, while they represent 6% of the population.


*With an excise tax of $0.02/ounce on sugary drinks.

A tax in California could prevent 198,000 cases of obesity in 2030. 58% of prevented obesity cases will be among Latino Californians, while they represent 42% of the population. 8% of prevented obesity cases will be among Black/African American Californians, while they represent 6% of the population.

Impact of the tax on behavior and health, by race/ethnicity

Outcome

Asian

Mean

Likely Range

Black/African American

Mean

Likely Range

Latino

Mean

Likely Range

White

Mean

Likely Range

Other

Mean

Likely Range

QALYS Gained Over 10 Years

3,560

1,490; 8,160

5,100

1,990; 11,300

28,700

12,600; 64,200

18,900

7,810; 42,600

1,910

818; 4,230

Years of Life Gained Over 10 Years

893

128; 2,400

1,820

381; 4,470

5,330

1,720; 12,800

6,020

2,040; 14,900

506

0; 1,490

Years with Obesity Prevented Over 10 Years

80,800

39,800; 159,000

110,000

53,300; 218,000

820,000

407,000; 1.6 million

354,000

159,000; 751,000

47,100

23,300; 89,700

Cases of Obesity Prevented in 2030*

12,700

5,960; 26,500

15,100

7,130; 30,700

114,000

56,300; 218,000

49,800

22,400; 106,000

7,050

3,430; 13,500

Cases of Childhood Obesity Prevented in 2030*

1,700

571; 3,980

2,920

1,060; 6,560

24,200

8,920; 52,900

3,610

1,240; 8,740

1,260

428; 2,920

The Likely Range is a 95% uncertainty interval estimated by running the model 1,000 times, taking into account uncertainty from data sources and population projections, and calculating a central range in which 95 percent of these model results fell.
Costs and health outcomes are discounted at 3% per year, unless otherwise noted. Discounting estimates the present value of costs and health outcomes that are spent or received in the future, given that they are worth more today than they would be tomorrow.
*Not discounted.
Other includes people of non-Latino ethnicity and Native Hawaiian and Pacific Islander, American Indian and Alaska Native, and two or more races.

How much would the tax cost to implement?

There are initial and ongoing costs to implementing the tax. To implement the strategy, the California Department of Tax and Fee Administration would perform several administrative activities, including identifying and notifying taxpayers, revising manuals and tax return documents and systems, processing tax statements, and conducting audits. Businesses would also need to prepare tax statements and participate in audits, which would require labor from private tax accountants. Cost information was drawn from tax programs that were previously implemented in California13 and from planned or implemented excise taxes on sugary drinks in other states and localities.14 The cost and benefit estimates do not include expected tax revenue (discussed below). Below we include annual and 10-year implementation costs.

Costs

Likely Range

Annual Implementation Cost

$3.9 million

$2.69 million; $4.99 million

Annual Implementation Cost per Person

$0.10

$0.07; $0.13

Total Intervention Implementation Cost Over 10 Years

$39.0 million

$26.9 million; $49.9 million

The Likely Range is a 95% uncertainty interval estimated by running the model 1,000 times, taking into account uncertainty from data sources and population projections, and calculating a central range in which 95 percent of these model results fell.
Costs and health outcomes are discounted at 3% per year, unless otherwise noted. Discounting estimates the present value of costs and health outcomes that are spent or received in the future, given that they are worth more today than they would be tomorrow.

How much would the tax save in health care costs compared to what it costs to implement?

The estimated reduction in obesity attributable to the tax leads to lower projected health care costs, offsetting tax implementation costs and resulting in a net cost savings. The difference between total health care costs with no strategy and lower health care costs with a strategy represents health care costs saved; these savings can be compared to the cost of implementing the tax to arrive at the metric of health care costs saved per $1 invested.

Costs

Likely Range

Health Care Costs Saved Over 10 Years

$1.83 billion

$783 million; $4.06 billion

Net Costs Difference Over 10 Years

-$1.79 billion

-$4.03 billion; -$740 million

Health Care Costs Saved per $1 Invested Over 10 Years

$46.89

$19.82; $118.76

The Likely Range is a 95% uncertainty interval estimated by running the model 1,000 times, taking into account uncertainty from data sources and population projections, and calculating a central range in which 95 percent of these model results fell.
Costs and health outcomes are discounted at 3% per year, unless otherwise noted. Discounting estimates the present value of costs and health outcomes that are spent or received in the future, given that they are worth more today than they would be tomorrow.

What would the impact of the tax be on Medi-Cal* spending?

Based on the projected reduction in adult obesity prevalence due to the tax (compared to what prevalence would be without the tax), adult obesity-related Medi-Cal expenditures in California are estimated to decrease. This does not include potential reductions in child obesity-related expenditures, and may be an underestimate if adults utilizing Medi-Cal have higher than average health care costs of obesity.15 A previous analysis found that 12.2% of adult Medi-Cal expenditures were due to obesity.16 We estimate that, in California, obesity accounted for $8.9 billion of $73.3 billion total adult Medi-Cal expenditures in 2019.16,17 This assumes that 74% of all Medi-Cal payments are for adults.18 The state paid 37% of total Medi-Cal expenditures in 2019,17 so we estimate that the state paid $3.3 billion in adult obesity-related Medi-Cal expenditures.

*Medi-Cal is California’s Medicaid program

Medi-Cal Spending

Likely Range

Reduction in Annual Adult Obesity-Related Medi-Cal Expenditures (Paid by State)

$17.9 million

$8.19 million; $38.5 million

Reduction in Total Annual Adult Obesity-Related Medi-Cal Expenditures (Paid by State and Federal)

$48.3 million

$22.1 million; $104 million

The Likely Range is a 95% uncertainty interval estimated by running the model 1,000 times, taking into account uncertainty from data sources and population projections, and calculating a central range in which 95 percent of these model results fell.
Costs and health outcomes are discounted at 3% per year, unless otherwise noted. Discounting estimates the present value of costs and health outcomes that are spent or received in the future, given that they are worth more today than they would be tomorrow.

What are the key cost-effectiveness metrics?

Since we project that the tax saves more in future health care costs than it costs to implement, there is a 100% likelihood that the tax would be cost-saving. 

Cost-effectiveness metrics

Cost per Year with Obesity Prevented Over 10 Years

Cost-saving*

Cost per QALY Gained Over 10 Years

Cost-saving*

Cost per YL Gained Over 10 Years

Cost-saving*

Cost per Death Averted Over 10 Years

Cost-saving*

Costs and health outcomes are discounted at 3% per year, unless otherwise noted. Discounting estimates the present value of costs and health outcomes that are spent or received in the future, given that they are worth more today than they would be tomorrow.
*There is a 100% likelihood that these metrics are cost-saving.

What effect would the tax have on diabetes?

Economic studies indicate that with a sugary drink tax, consumers will buy less of these products.19 A $0.02/ounce tax will decrease the consumption of sugary drinks and this has other health implications that we can estimate. In California, the proposed sugary drink excise tax would lead to a 7% reduction in diabetes incidence over one year once the tax reaches full effect. We calculated this impact on diabetes incidence using projected declines in sugary drink consumption, not directly via microsimulation.$0.02 per ounce state excise tax on sugary drinks would lead to a 7% reduction in diabetes incidence and 13,900 cases of diabetes prevented

What effect would the tax have on tooth decay?

In California, we estimated that a $0.02/ounce tax would lead to a reduction of 502,000 decayed, missing, and filled teeth among Medi-Cal* recipients and $39.5 million in savings to Medi-Cal over 10 years due to a reduction in treatment of tooth decay. For the entire California population, we estimated the tax would lead to a reduction of 1,620,000 decayed, missing, and filled teeth and $135 million in savings for all payers due to a reduction in treatment of tooth decay. The Medi-Cal reimbursement tax estimates may underestimate the total cost savings of tooth decay treatment projected here as dental providers may charge higher amounts to patients. Impact on tooth decay was calculated using projected declines in sugary drink consumption, not directly via microsimulation.

*Medi-Cal is California’s Medicaid program

$0.02 per ounce state excise tax on sugary drinks would lead to $39.5 million in dental decay treatment cost savings over 10 years (Medi-Cal) and $135 million in dental decay treatment total cost savings over 10 years (Societal)

Key Considerations for Health Equity

Concerns have been raised regarding the impact of the tax on low-income households, because lower-income populations tend to consume more sugary drinks.20 Economic studies indicate that with a sugary drink tax, consumers will buy less of these products.19 This change in purchasing is substantial, so that consumers can be expected to spend less on sugary drinks after a tax is implemented. Using sales data from the Rudd Center Revenue Calculator for Sugary Drink Taxes,21 we project that individuals and households in California will spend less money on sugary drinks after a $0.02 per ounce tax: about $48 less per year per person, and $142 per year less for an average household. This would free up disposable income for other consumer purchases. A typical consumer in California who continues to consume these beverages after the tax is in place would be expected to pay tax of about $1.40 per week, or $73/year.

In addition to these changes in spending, health benefits are projected to be greatest among low-income individuals. We also project that greater health benefits will accrue among Latino and Black/African American California residents compared with White and Asian residents. Using data on sugary drink consumption in the CHOICES model, the average daily consumption of sugary drinks among people in California varies by race/ethnicity group (see pre-tax figures on pages 4 and 6). Under the proposed tax, we project that Black/African American Californians would see a 39% greater reduction in obesity prevalence than average, and Latino Californians would see a 33% greater reduction in obesity prevalence than average. On that basis, the proposed tax could decrease disparities in obesity outcomes and improve health equity.

These expected changes in consumption and health outcomes have led economists to conclude that low-income populations benefit substantially from sugary drink taxes.22

Implementation Considerations

A $0.02/ounce statewide excise tax on sugary drinks in California could raise as much as $1.3 to $1.8 billion in annual revenue.21 Revenue raised from a sugary drink tax could be reinvested in communities with low-income. For instance, in Berkeley, CA, revenue from a municipal sugary drink tax has been allocated for spending on school and community programs, many serving families with low-income or communities of color, to promote healthy eating, diabetes, and obesity prevention.23,24 Public support for such taxes generally increases with earmarking for preventive health activities.24

There is opposition from the food and beverage industry, which spends billions of dollars promoting their products.25 Relatively small beverage excise taxes are currently applied across many states. The proposed tax is likely to be sustainable if implemented based on the successful history of tobacco excise taxes. There is potential for a shift in social norms of sugary drink consumption based on evidence from tobacco control tax and regulatory efforts.26 


Modeling Assumptions and Summary of the CHOICES Microsimulation Model


How does an excise tax on distributors affect the price paid by consumers?

An excise tax is incorporated directly into a beverage’s shelf price. We assume 100% pass-through of the tax over 10 years and assume the tax rate would be adjusted annually for inflation. Our pass-through rate estimate is supported by empirical studies of excise taxes in Mexico and France that demonstrate near-complete pass-through rates to consumers27 and consistent evidence in the U.S. indicating that beverage taxes increase prices, although there is some variation by store type.28-31   

The expected change in sugary drink price was estimated based on national sugary drink prices32 and regional sales data for several categories of sugary drinks (i.e., soda, sports drinks, fruit drinks, energy drinks, sweetened teas, sweetened coffees, and enhanced water).21 In California, we assume the average price of sugary drinks is almost $0.09/ounce, so a $0.02/ounce tax would raise prices by 23%. This means that, for example, the price of a 12-ounce can of soda would increase from $1.06 to $1.30/can post-tax.

How does increasing the price of sugary drinks change individual sugary drink consumption?

How much consumers will change their purchases in response to price changes is called price elasticity for demand. We assume for every 10% increase in the price of sugary drinks, there will be a 12% reduction in purchases (a mean own-price elasticity of demand of -1.21).19 Recent research on the Berkeley, CA $0.01/ounce tax found a 21% reduction in sugary drink intake among populations with low-income consistent with this estimate.33-37 In California, we assume a $0.02/ounce tax that raises prices by 23% would reduce purchases by 27%. We assume this 27% reduction in purchases results in a 27% reduction in consumption.

To estimate current sugary drink consumption levels in California, we used national estimates of sugary drink consumption from NHANES 2011-2016 adjusted to race- and ethnicity-specific estimates of sugary drink consumption among children, teens, and adults from the California Health Interview Survey38 and estimates of sugary drink sales in California from the UConn Rudd Center for Food Policy & Obesity.21

What are the health effects of decreasing sugary drink consumption?

Research has shown that decreasing sugary drink consumption can have positive effects on health in youth and adults.

Assumptions about sugary drinks and obesity risk

We estimated the impact of a change in sugary drink intake on body mass index (BMI), accounting for dietary compensation, based on rigorous studies identified in evidence reviews.14 The relationship among adults was modeled based on the range of estimated effects from four large, multi-year longitudinal studies, which indicated that a one-serving reduction in sugary drinks was associated with a BMI decrease of 0.21 kg/m2 to 0.57 kg/m2 in adults over a 3-year period.39-42 Among youth, we used evidence from a double-blind randomized controlled trial conducted over 18 months, which found that an additional 8-ounce serving of sugary drinks led to a 2.2 pound greater weight gain.43

Assumptions about sugary drinks and diabetes risk

We estimated the impact of the tax-induced reduction in sugary drink intake on diabetes incidence for adults ages 18-79 years using a published meta-analysis of the relative risk of developing diabetes due to a one-serving change in sugary drink consumption44 as well as state-level estimates of diabetes incidence from the CDC Atlas 201645 and prevalence from the California Health Interview Survey 2017-2018.46 On average, each 8.5-ounce serving of sugary drinks per day increases the risk of diabetes by 18%.44

Assumptions about sugary drinks and tooth decay

We estimated the impact of a sugary drink excise tax on tooth decay and tooth decay treatment costs using a longitudinal analysis of the relationship between intake of sugars and tooth decay in adults. On average, for every 10 grams higher intake of sugar per day, there is an increase in decayed, missing and filled teeth (i.e., tooth decay) of approximately 0.10 over 10 years.47 There are many studies showing a similar relationship between higher intake of sugars and tooth decay in children and youth48 and thus we assume the same relationship as found in adults. We used the Medi-Cal Dental Provider Handbook 201949 to estimate a Medi-Cal cost of treating tooth decay as: $278 for a permanent crown and $58 for a filling. These codes reflect treatment for one to four surfaces but do not reflect the actual frequency of multi-surface treatment among Medi-Cal recipients or for higher reimbursement rates due to temporary crowns or potential flat tax schedules. Based on analysis of data on tooth decay, fillings and crowns for the U.S. population from NHANES 1988-1994 (the last year crowns and fillings were separately reported),50 we estimate that 78.9% of tooth decay in children and 43.5% of tooth decay in adults is treated. Using this same data set, we estimate that 97% of treatment for children is fillings and 82.5% of treatment for adults is fillings. To estimate Medi-Cal-specific savings in costs of dental treatment, we used estimates of the number of people enrolled in the Medi-Cal Dental Program in 2018.51

CHOICES Microsimulation Model

The CHOICES microsimulation model was used to calculate the costs and effectiveness of a tax in California over 10 years (2020-2030). We forecasted what would happen to a virtual population of residents in California with and without a sugary drink tax to model changes in disease and mortality rates and health care costs due to the tax. Cases of obesity prevented were calculated at the end of the model period in 2030. The model was based on peer-reviewed CHOICES methodology.14,52-54 We created a virtual population of residents in California using data from: the U.S. Census, American Community Survey, Behavioral Risk Factor Surveillance System, NHANES, National Survey of Children’s Health,52 the Medical Expenditure Panel Survey, multiple national longitudinal studies, and obesity prevalence data provided by California Department of Public Health. Impacts on diabetes, tooth decay, Medicaid spending, and household spending on sugary drinks were calculated based on summary results from the model, not directly via microsimulation.

Of note, the CHOICES microsimulation model does not include annual revenue generation from a state excise tax on sugary drinks in any of the cost-effectiveness calculations. The Rudd Center Revenue Calculator for Sugary Drink Taxes estimates potential annual revenues from excise taxes on sugary drinks and is “intended to provide a rough estimate” for municipalities to consider.21 According to the Rudd Center,21 a $0.02/ounce excise tax in California could raise as much as $1.8 billion in 2020. Accounting for 10-30% non-compliance as the Rudd Center advises, annual revenue estimates range between $1.3 – $1.8 billion.CHOICES microsimulation model: start in 2020 and simulate to 2030. Start with a virtual population using data from the 2010 U.S. census. Then take into account population factors, such as population growth and BMI trends. Then take into account individual factors, such as body growth, personal characteristics (e.g. dietary intake), and smoking. Then, input the intervention (dietary intake/physical activity). Then, look at health status (obesity) and outcomes (obesity, health care costs, and mortality).

Citation

Gouck J, Whetstone L, Walter C, Pugliese J, Kurtz C, Seavey-Hultquist J, Barrett J, McCulloch S, Reiner J, Garrone M, Cradock A, Gortmaker, S. California: A Sugary Drink Excise Tax. California Department of Public Health, Sacramento, CA, the County of Santa Clara Public Health Department, San Jose, CA, and the CHOICES Learning Collaborative Partnership at the Harvard T.H. Chan School of Public Health, Boston, MA; March 2021. For more information, please visit www.choicesproject.org

The design for this brief and its graphics were developed by Molly Garrone, MA and partners at Burness.

Funding

This work is supported by The JPB Foundation and the Centers for Disease Control and Prevention (U48DP006376). The findings and conclusions are those of the author(s) and do not necessarily represent the official position of the Centers for Disease Control and Prevention or other funders.

For further information, contact choicesproject@hsph.harvard.edu

← Back to Resources

References

  1. American Public Health Association Taxes on Sugar-Sweetened Beverages. 2012.
  2. Falbe J, Rojas N, Grummon AH, Madsen KA. Higher Retail Prices of Sugar-Sweetened Beverages 3 Months After Implementation of an Excise Tax in Berkeley, California. American Journal of Public Health. 2015;105(11):2194-2201.
  3. World Health Organization. Global action plan for the prevention and control of noncommunicable diseases 2013–2020 [Internet]. Geneva: WHO. Updated appendix 3, “Best buys” and other recommended interventions for the prevention and control of noncommunicable diseases; [updated 2017; cited 2019 Sep 17]. Available from: http://www.who.int/ncds/management/WHO_Appendix_BestBuys.pdf
  4. Hart A. New coalition calls for statewide soda tax in California. Politico. July 17, 2019. Accessed October 15, 2020 at: https://www.politico.com/states/california/story/2019/07/17/new-coalition-calls-for-statewide-soda-tax-in-california-1104414
  5. National Academies of Sciences, Engineering, and Medicine; Health and Medicine Division; Board on Population Health and Public Health Practice; Committee on Community-Based Solutions to Promote Health Equity in the United States; Baciu A, Negussie Y, Geller A, et al., editors. Communities in Action: Pathways to Health Equity. Washington (DC): National Academies Press (US); 2017 Jan 11. 3, The Root Causes of Health Inequity. Available from: https://www.ncbi.nlm.nih.gov/books/NBK425845
  6. U.S. Dept of Health and Human Services & U.S. Dept of Agriculture, 2015-2020 Dietary Guidelines for Americans, 8th Edition, 2015.
  7. UCLA Center for Health Policy Research. AskCHIS. 2017 Health Interview Survey. Available at: https://ask.chis.ucla.edu
  8. Harris JL, Fleming-Milici F, Kibwana-Jaff A, Phaneuf L. Sugary Drink FACTS 2020: Sugary drink advertising to youth: Continued barrier to public health progress. UConn Rudd Center for Food Policy & Obesity, June 2020. Accessed January 7, 2021 at http://sugarydrinkfacts.org/resources/Sugary%20Drink%20FACTS%202020/Sugary_Drink_FACTS_Full%20Report_final.pdf
  9. Malik VS, Pan A, Willett WC, Hu FB. Sugar-sweetened beverages and weight gain in children and adults: a systematic review and meta-analysis. American Journal of Clinical Nutrition. 2013;98(4):1084-1102. 16.
  10. Chen L, Caballero B, Mitchell DC, et al. Reducing Consumption of Sugar-Sweetened Beverages Is Associated with Reduced Blood Pressure: A Prospective Study among U.S. Adults. Circulation. 2010;121(22):2398-2406.
  11. Ward ZJ, Bleich SN, Cradock AL, Barrett JL, Giles CM, Flax CN, Long MW, Gortmaker SL. Projected U.S. State-Level Prevalence of Adult Obesity and Severe Obesity. New England Journal of  Medicine. 2019;381:2440-50. doi: 10.1056/NEJMsa1909301.
  12. California Department of Public Health, analysis of 2017 FitnessGram data provided by the California Department of Education.
  13. California Department of Tax and Fee Administration, personal communication to the California Department of Public Health, March 6, 2020.
  14. Gortmaker SL, Wang YC, Long MW, et al. Three Interventions That Reduce Childhood Obesity Are Projected To Save More Than They Cost To Implement. Health Affairs. 2015;34(11):1932-1939.
  15. Wang YC, Pamplin J, Long MW, Ward ZJ, Gortmaker SL, Andreyeva T. Severe Obesity In Adults Cost State Medicaid Programs Nearly $8 Billion In 2013. Health Affairs (Millwood). 2015 Nov;34(11):1923-31.
  16. Trogdon JG, Finkelstein EA, Feagan CW, Cohen JW. State- and payer-specific estimates of annual medical expenditures attributable to obesity. Obesity (Silver Spring). 2012 Jan;20(1):214-20.
  17. California Health Care Foundation. California Health Care Almanac, Medi-Cal Facts and Figures: Crucial Coverage for Low-Income Californians, February 2019. Accessed October 22, 2020 at: https://www.chcf.org/wp-content/uploads/2019/02/MediCalFactsFiguresAlmanac2019.pdf
  18. Lassman D, Hartman M, Washington B, Andrews K, Catlin A. US health spending trends by age and gender: selected years 2002-10. Health Affairs (Millwood). 2014 May;33(5):815-22.
  19. Powell LM, Chriqui JF, Khan T, Wada R, Chaloupka FJ. Assessing the Potential Effectiveness of Food and Beverage Taxes and Subsidies for Improving Public Health: A Systematic Review of Prices, Demand and Body Weight Outcomes. Obesity Reviews. 2013;14(2):110-128.
  20. Han E, Powell LM. Consumption patterns of sugar-sweetened beverages in the United States. Journal of the Academy of Nutrition and Dietetics. 2013;113(1):43-53.
  21. UConn Rudd Center for Food Policy & Obesity. Sugary Drink Tax Calculator. https://uconnruddcenter.org/tax-calculator. Accessed February 2021.
  22. Allcott H, Lockwood BB, Taubinsky D. Should We Tax Sugar-Sweetened Beverages? An Overview of Theory and Evidence. Journal of Economic Perspectives. 2019; 33 no 3: 202–27.
  23. Lynn J. City Council votes to allocate ‘soda tax’ revenue to school district, city organizations. The Daily Californian. Jan. 20, 2016; 2016.
  24. Berkeley City Council. (2016, June 14). Berkeley City Council meeting. [Annotated Agenda]. Retrieved from https://www.cityofberkeley.info/Clerk/City_Council/2016/06_June/City_Council__06-14-2016_-_Meeting_Info.aspx
  25. Federal Trade Commission. A review of food marketing to children and adolescents: follow-up report. Washington, DC; Dec 2012.
  26. Frieden TR, Mostashari F, Kerker BD, Miller N, Hajat A, Frankel M. Adult tobacco use levels after intensive tobacco control measures: New York City, 2002-2003. American Journal of Public Health. 2005;95(6):1016-1023
  27. Colchero MA, Salgado JC, Unar-Munguia M, Molina M, Ng SW, Rivera-Dommarco JA. Changes in Prices After an Excise Tax to Sweetened Sugar Beverages Was Implemented in Mexico: Evidence from Urban Areas. PLoS One. 2015;10(12):11.
  28. Cawley J, Frisvold D, Hill A, Jones D. The Impact of the Philadelphia Beverage Tax on Prices and Product Availability. NBER Working Paper. 2018(24990).
  29. Bleich SN, Lawman HG, LeVasseur MT, et al. The association of a sweetened beverage tax with changes in beverage prices and purchases at independent stores. Health Affairs (Millwood). 2020;39(7):1130-1139.
  30. Marinello S, Pipito AA, Leider J, Pugach O, Powell LM. The impact of the Oakland sugar-sweetened beverage tax on bottled soda and fountain drink prices in fast-food restaurants. Preventive Medicine Reports. 2020;17:101034.
  31. Ng S, Silver L, Ryan-Ibarra S, et al. Berkeley Evaluation of Soda Tax (BEST) Study Preliminary Findings. Presentation at the annual meeting of the American Public Health Association. Paper presented at: Presentation at the annual meeting of the American Public Health Association; November, 2015; Chicago, IL.
  32. Powell L, Isgor z, Rimkus L, Chaloupka F. Sugar-sweetened beverage prices: Estimates from a national sample of food outlets. Chicago, IL: Bridging the Gap Program, Health Policy Center, Institute for Health Research and Policy, University of Illinois at Chicago; 2014.
  33. Falbe J, Thompson HR, Becker CM, Rojas N, McCulloch CE, Madsen KA. Impact of the Berkeley Excise Tax on Sugar-Sweetened Beverage Consumption. American Journal of Public Health. 2016;106(10):1865-1871.
  34. Cawley J, Frisvold D, Hill A, Jones D. The impact of the Philadelphia beverage tax on purchases and consumption by adults and children. Journal of Health Economics. 2019;67:102225.
  35. Lee MM, Falbe J, Schillinger D, Basu S, McCulloch CE, Madsen KA. Sugar-Sweetened Beverage Consumption 3 Years After the Berkeley, California, Sugar-Sweetened Beverage Tax. American Journal of Public Health. 2019;109(4):637-639.
  36. Zhong Y, Auchincloss AH, Lee BK, Kanter GP. The Short-Term Impacts of the Philadelphia Beverage Tax on Beverage Consumption. American Journal of Preventive Medicine. 2018;55(1):26-34.
  37. Silver LD, Ng SW, Ryan-Ibarra S, et al. Changes in prices, sales, consumer spending, and beverage consumption one year after a tax on sugar-sweetened beverages in Berkeley, California, US: A before-and-after study. PLoS Medicine. 2017;14(4):e1002283
  38. 2011-2017 California Health Interview Survey data, analysis by the Harvard T.H. Chan School of Public Health, data provided by the UCLA Center for Health Policy Research, available at: http://healthpolicy.ucla.edu/chis/Pages/default.aspx
  39. Chen L, Caballero B, Mitchell DC, et al. Reducing Consumption of Sugar-Sweetened Beverages Is Associated with Reduced Blood Pressure: A Prospective Study among U.S. Adults. Circulation. 2010;121(22):2398-2406.
  40. Mozaffarian D, Hao T, Rimm EB, Willett WC, Hu FB. Changes in Diet and Lifestyle and Long-Term Weight Gain in Women and Men. New England Journal of Medicine. 2011;364(25):2392-2404.
  41. Palmer JR, Boggs DA, Krishnan S, Hu FB, Singer M, Rosenberg L. Sugar-Sweetened Beverages and Incidence of Type 2 Diabetes Mellitus in African American Women. Archives of Internal Medicine. 2008;168(14):1487-1492.
  42. Schulze MB, Manson JE, Ludwig DS, et al. Sugar-sweetened beverages, weight gain, and incidence of type 2 diabetes in young and middle-aged women. Journal of the American Medical Association. 2004;292(8):927-934.
  43. de Ruyter JC, Olthof MR, Seidell JC, Katan MB. A trial of sugar-free or sugar-sweetened beverages and body weight in children. New England Journal of Medicine. 2012;367(15):1397-1406.
  44. Imamura F, O’Connor L, Ye Z, et al. Consumption of sugar sweetened beverages, artificially sweetened beverages, and fruit juice and incidence of type 2 diabetes: systematic review, meta-analysis, and estimation of population attributable fraction. British Journal of Sports Medicine. 2016;50(8):496-U484.
  45. Centers for Disease Control and Prevention. Diabetes Atlas. Accessed 10/21/20 at: https://gis.cdc.gov/grasp/diabetes/DiabetesAtlas.html#
  46. 2017-2018 California Health Interview Survey data, analysis by the Harvard T.H. Chan School of Public Health, data provided by the UCLA Center for Health Policy Research, available at: http://healthpolicy.ucla.edu/chis/Pages/default.aspx
  47. Bernabe E, Vehkalahti MM, Sheiham A, Lundqvist A, Suominen AL. The Shape of the Dose-Response Relationship between Sugars and Caries in Adults. Journal of Dental Research. 2016;95(2):167-172.
  48. Sheiham A, James WPT. A new understanding of the relationship between sugars, dental caries and fluoride use: implications for limits on sugars consumption. Public Health Nutrition. 2014;17(10):2176-2184.
  49. California Department of Health Care Services, Medi-Cal Dental Provider Handbook 2019. Accessed October 19, 2020 at: https://dental.dhcs.ca.gov/Dental_Providers/Denti-Cal/Provider_Handbook
  50. Ward Z, et al. NHANES III Dental Examination: An Incisive Report. unpublished report; 2018.
  51. California Department of Health Care Services, Multi Year Medi-Cal Dental Measures Data by Age Groups Calendar Year 2013 to 2018. Accessed October 19, 2020 at: https://data.chhs.ca.gov/dataset/test-dhcs-multi-year-dental-measures-data-by-age-groups-calendar-year-2013-to-2015
  52. Ward ZJ, Long MW, Resch SC, Giles CM, Cradock AL, Gortmaker SL. Simulation of Growth Trajectories of Childhood Obesity into Adulthood. New England Journal of Medicine. 2017;377(22):2145-2153.
  53. Ward ZJ, Long MW, Resch SC, et al. Redrawing the US Obesity Landscape: Bias-Corrected Estimates of State-Specific Adult Obesity Prevalence. PLoS One. 2016;11(3):13.
  54. Long MW, Ward Z, Resch SC, et al. State-level estimates of childhood obesity prevalence in the United States corrected for report bias. International Journal of Obesity. 2016;40(10):1523-1528.

Brief: Supporting Healthy Food and Beverage Choices in Afterschool Programs in Allegheny County, Pennsylvania

Young boy eating a green apple

The information in this brief is intended only to provide educational information.

This brief summarizes a CHOICES Learning Collaborative Partnership model examining the potential impacts of a healthy snack policy in afterschool programs that already provide snacks through the National School Lunch Program or the Child and Adult Care Food Program.

The Issue

All children deserve the opportunity to grow up at a healthy weight. If current trends in childhood obesity continue, most of today’s children will have obesity at age 35.1 The health care costs of treating obesity-related conditions in adulthood were $147 billion in 2008.2 Snacks account for 25% of total calorie intake among most U.S. children and are frequently composed of sweet foods and sugar-sweetened drinks,3 beverages that increase the risk of excess weight gain.4 Promoting healthy food and beverage choices in afterschool programs is one opportunity to improve children’s diets and potentially reduce childhood obesity.5

In Allegheny County, nearly 10,000 children attend an afterschool program that typically allows participants to bring in snacks that they can consume during the program. When children bring in their own snacks to afterschool programs, those snacks are often less healthy than snacks served within federal reimbursable meal programs.6

About a Healthy Snack Policy

A policy that does not allow children to bring in their own snacks to afterschool programs and only offers healthy food and/or beverage choices that are part of federal reimbursable meal programs could support good nutrition. Snacks refer to both foods and beverages. In Allegheny County, UPMC Children’s Hospital of Pittsburgh, and Allegheny Partners for Out-of-School Time work with 120 sites across the county through Healthy Out-of-School Time and Quality Campaign. The majority of these sites (117) serve snacks though federal reimbursable meal programs, but allow children to bring in their own snacks. These sites could benefit from adopting a healthy snack policy. Activities to support adoption of this policy would include training site directors, who would in turn train program staff. During the academic year, Healthy Out-of-School Time and Quality Campaign site coordinators would provide technical assistance to support policy adoption.

Comparing Costs and Outcomes

CHOICES cost-effectiveness analysis compared the costs and outcomes of adopting a healthy snack policy in 117 Healthy Out-of-School Time and Quality Campaign afterschool programs over 10 years. Programs could adopt either a policy that does not allow children to bring in sugary drinks or a policy that does not allow children to bring in either sugary drinks or their own food to afterschool programs.

Implementing a healthy snack policy could support good nutrition and save families money. By the end of 2027:
An infographic about the healthy snack policy results. The bottom of the graphic shows increased numbers for a food and drink plan instead of only a drink plan. The food and drink results are: 4, 510 children would consume fewer unhealthy snacks; 50 cases of childhood obesity prevented; $1,690,000 saved by families.

Conclusions and Implications

Adopting a healthy snack policy could promote better health for children in afterschool programs and save families money. For some programs, it may be more feasible to adopt a policy addressing sugary drinks only. Clear evidence links sugary drink consumption to excess weight gain.4

We estimate that providing the training, technical assistance, communication, coordination, and monitoring in afterschool programs to support the adoption of a healthy snack policy that only addresses sugary drinks would cost $53,500 over 10 years. It could also result in $965,000 in savings for families ($243 per child) who are no longer purchasing beverages for their children to bring to afterschool. Those children who regularly bring sugary drinks to afterschool programs and attend Healthy Out-of-School Time and Quality Campaign afterschool programs that adopt a healthy snack policy could reduce sugary drink consumption by 10 ounces per day on those days they attend programming. In addition, 27 cases of childhood obesity could be prevented in 2027 and $53,900 in obesity-related health care costs could be saved. Afterschool programs adopting a healthy snack policy can support healthy nutrition habits for children and lay a foundation for better health.

References

  1. Ward Z, Long M, Resch S, Giles C, Cradock A, Gortmaker S. Simulation of Growth Trajectories of Childhood Obesity into Adulthood. New England Journal of Medicine. 2017 Nov 30;377(22):2145-2153.
  2. Finkelstein EA, Trogdon JG, Cohen JW, Dietz W. Annual Medical Spending Attributable To Obesity: Payer-And Service-Specific Estimates. Health Affairs. 2009;28(5).
  3. Wang D, van der Horst K, Jacquier E & Eldridge AL. Snacking among US children: patterns differ by time of day. Journal of Nutrition Education and Behavior. 2016; 48(6), 369-375.
  4. Malik VS, Schulze MB, Hu FB. Intake of sugar-sweetened beverages and weight gain: a systematic review. American Journal of Clinical Nutrition. 2006;84(2):274–88.
  5. Khan LK, Sobush K, Keener D, Goodman K, Lowry A, Kakietek J, et al. Recommended community strategies and measurements to prevent obesity in the United States. MMWR Recomm Rep 2009;58(RR-7):1–26.
  6. Kenney EL, Austin SB, Cradock AL, Giles CM, Lee RM, Davison KK, Gortmaker SL. Identifying sources of children’s consumption of junk food in Boston after-school programs, April-May 2011. Preventing Chronic Disease. 2014 Nov 20;11:E205
Suggested Citation:

Pagnotta M, Hardy H, Burry K, Flax C, Barrett J, Cradock A. Allegheny County: Supporting Healthy Food and Beverage Choices in Afterschool Programs [Issue Brief]. Allegheny County Health Department, Pittsburgh, PA, and the CHOICES Learning Collaborative Partnership at the Harvard T.H. Chan School of Public Health, Boston, MA; November 2019.

This issue brief was developed at the Harvard T.H. Chan School of Public Health in collaboration with the Allegheny County Health Department (ACHD) through participation in the Childhood Obesity Intervention Cost-Effectiveness Study (CHOICES) Learning Collaborative Partnership. This brief is intended for educational use only.

← Back to Resources