The information in this report is intended to provide educational information on the cost-effectiveness of sugary drink excise taxes.
Executive Summary
Continually rising rates of obesity represent one of the greatest public health threats facing the United States. Obesity has been linked to excess consumption of sugary drinks. Federal, state, and local governments have considered implementing excise taxes on sugary drinks to reduce consumption, reduce obesity, and provide a new source of government revenue.1-4 Seven cities in the United States have implemented sugary drink taxes.
We modeled potential implementation of a state excise tax in Minnesota, a tax on sugary drinks only, at a tax rate of $0.02/ounce. Powdered drink mixes were modeled at a tax rate of $0.0025 per reconstituted fluid ounce according to the package instructions.
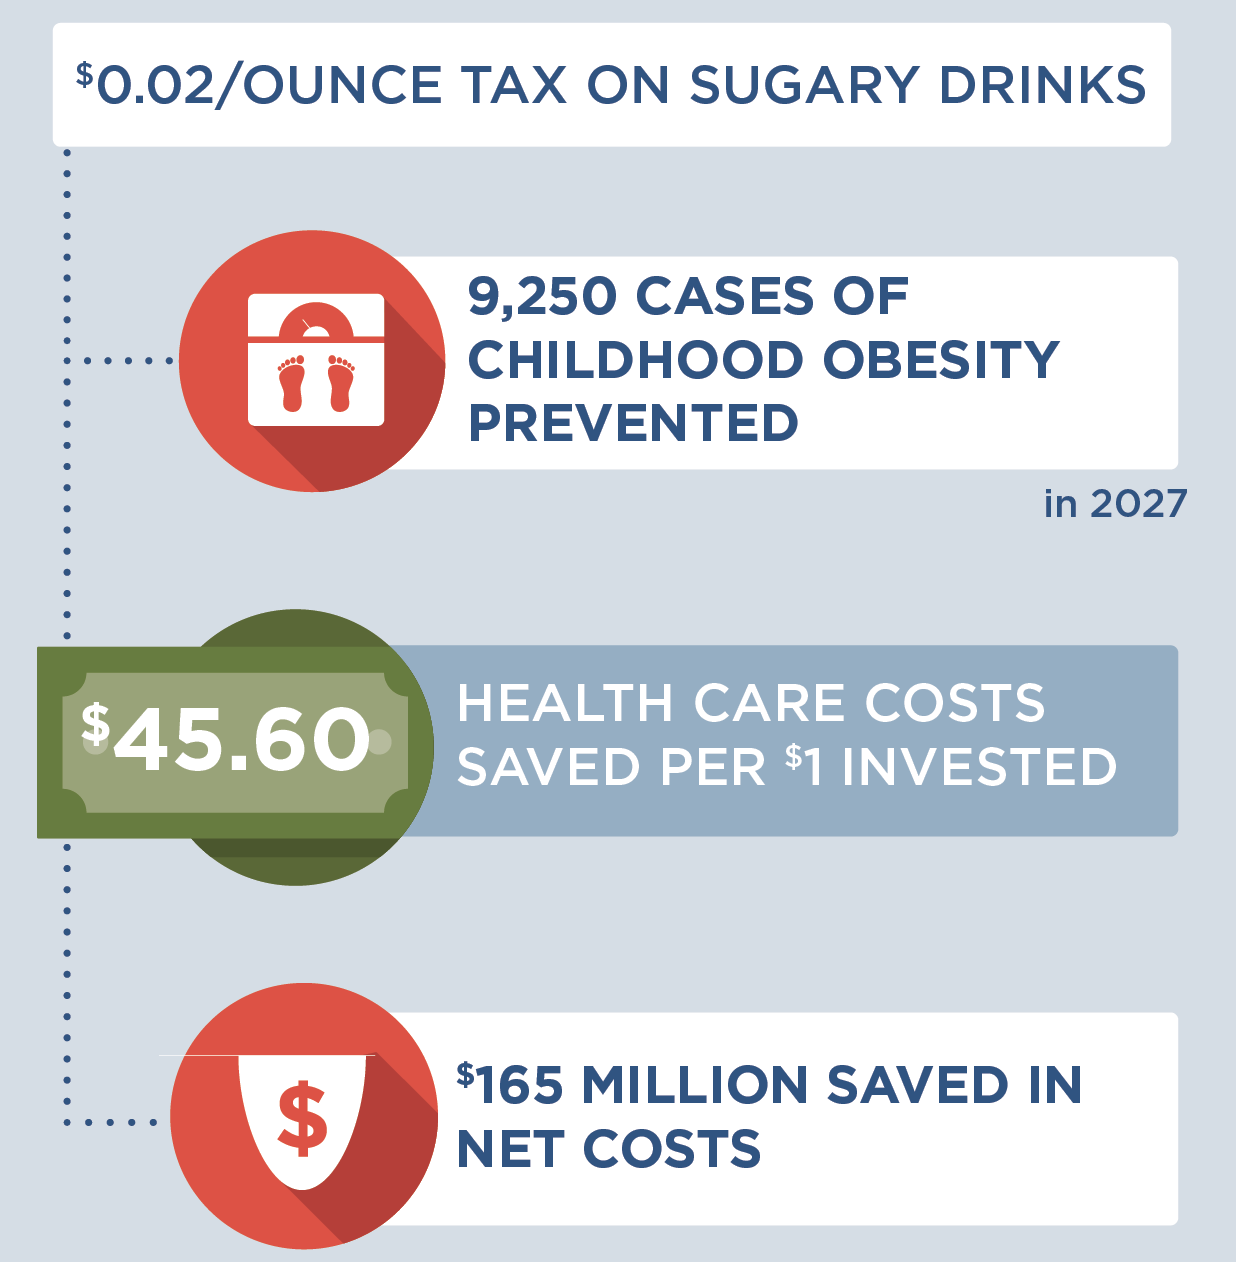
The tax is projected to be cost-saving and result in lower levels of sugary drink consumption, thousands of cases of obesity prevented, more than $160 million dollars in health care cost savings, and improved health equity. The tax is projected to save $45.60 in health care costs per dollar invested.
Background
Although consumption of sugary drinks (defined as all drinks with added caloric sweeteners) has declined in recent years, adolescents and young adults in the United States consume more sugar than the Dietary Guidelines for Americans 2020-2025 recommend, with persistent racial/ethnic disparities.5-8 According to recent estimates, 22% of adults in Minnesota drink at least one soda or other sugary drink per day.9 The Minnesota Student Survey of sixth, ninth and twelfth graders found that three out of four students reported consuming a sugary drink a day.10 Public health researchers have suggested that excess intake of sugary drinks may be one of the single largest drivers of the obesity epidemic in the U.S.11 An estimated 63% of adults and 22% of youth in Minnesota have overweight or obesity.10,12
Targeted marketing contributes to differences in consumption by race/ethnicity group. Non-Hispanic Black youth are twice as likely as non-Hispanic White youth to see TV ads for sugary drinks.13 Non-Hispanic Black and Hispanic youth are less likely to be the audience for marketing of more healthy beverages, like water.14 Consumption of sugary drinks increases the risk of chronic diseases through changes in body mass index (BMI), insulin regulation, and other metabolic processes.15-17 Randomized intervention trials and longitudinal studies have linked increases in sugary drink consumption to excess weight gain, diabetes, cardiovascular disease, and other health risks.15,16 There are persistent racial and ethnic disparities across rates of obesity and chronic disease.5-7 In light of this evidence, the Dietary Guidelines for Americans 2020-20258 recommends that individuals limit sugary drink intake in order to manage body weight and reduce risk of chronic disease.
Taxation has emerged as one recommended strategy to reduce consumption of sugary drinks.18 This strategy has been studied by public health experts, who have drawn on the success of tobacco taxation and decades of economic research to model the estimated financial and health impact of a sugary drink excise tax.19-22 This report provides information on a model of the projected effect of sugary drink excise taxes on health and disease outcomes over 10 years. For the purposes of this model, sugary drinks include all drinks with added caloric sweeteners; beverages with less than two calories per ounce were exempt from the model. Proposed and enacted sugary drink excise taxes typically do not apply to 100% juice or milk products and these are exempt from the modeled tax.
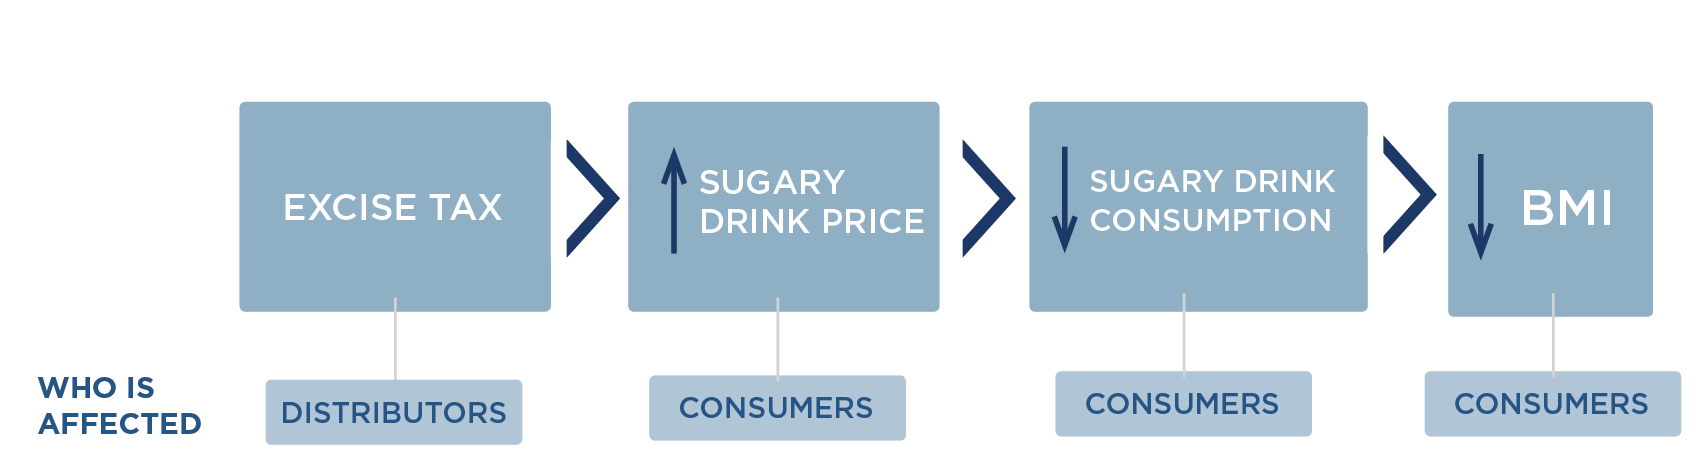
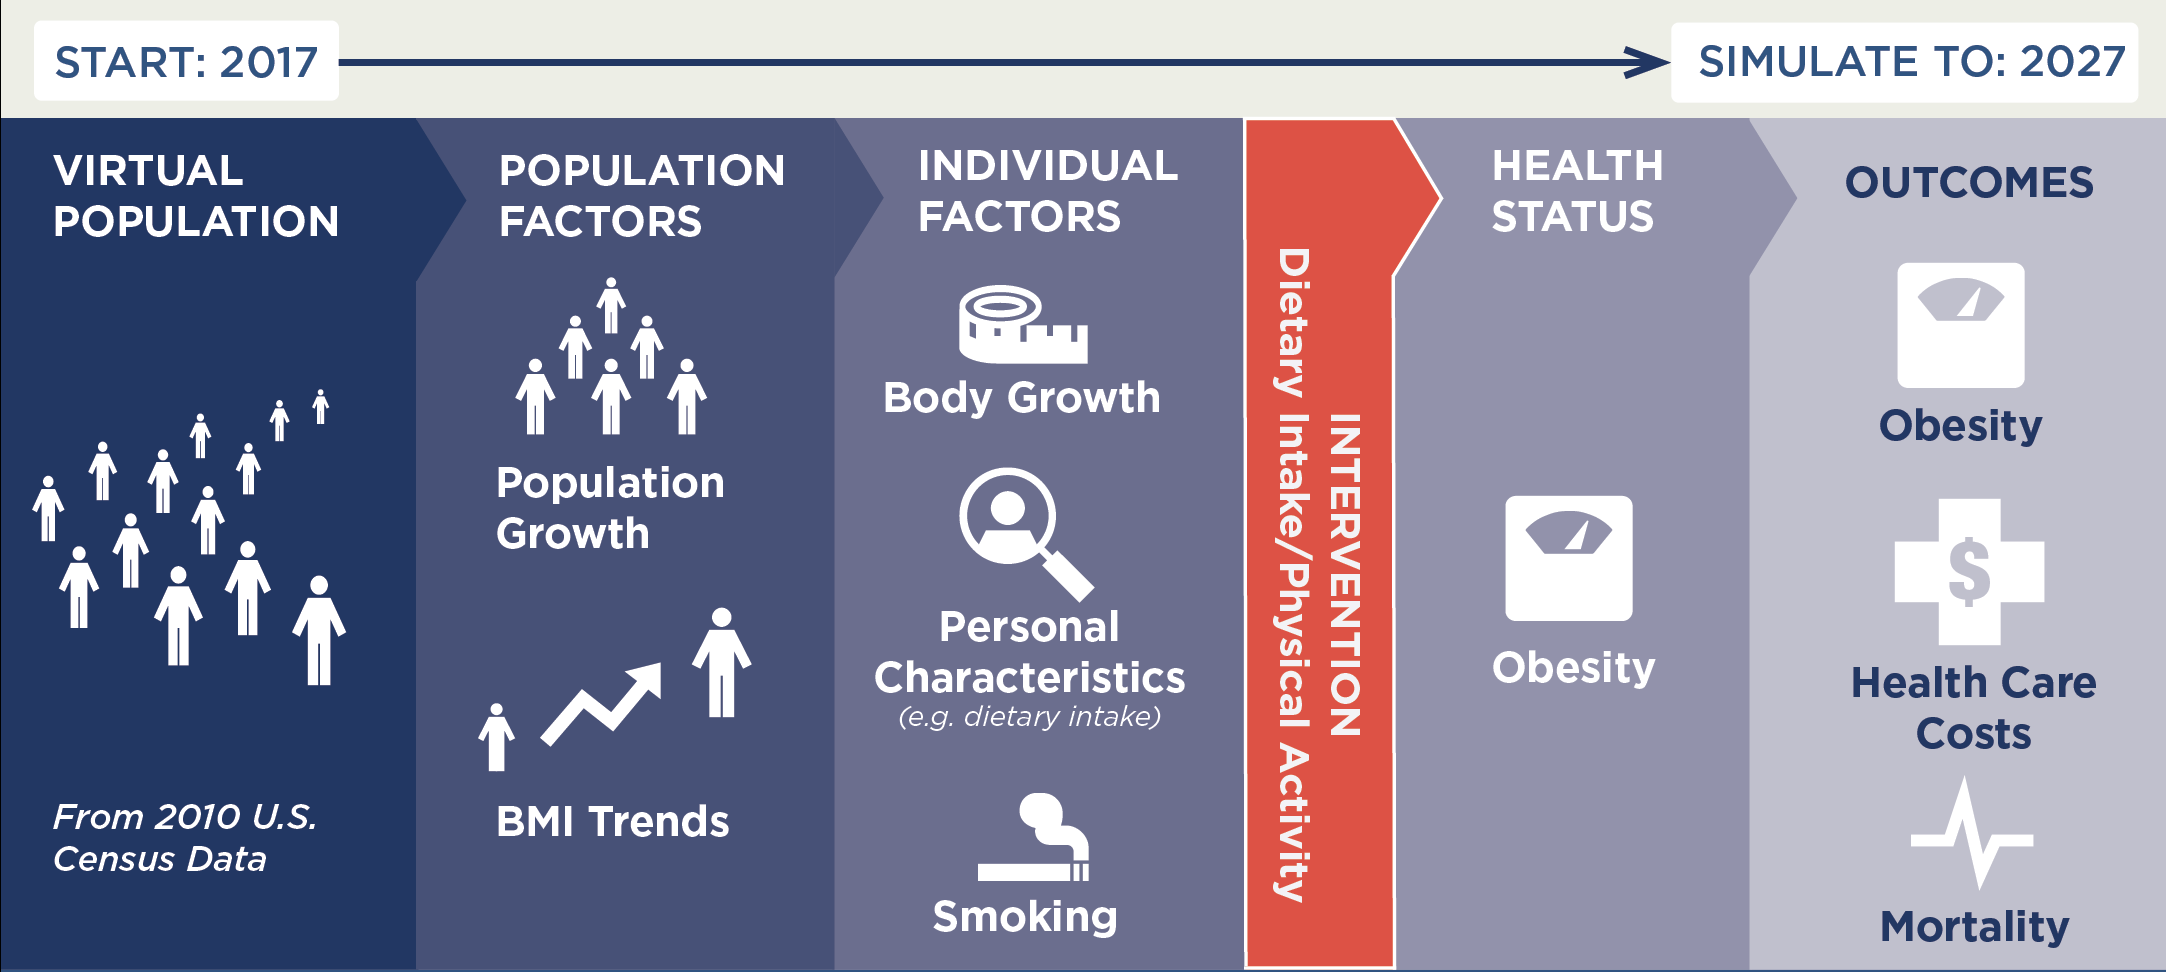
Modeling Framework: How excise taxes can lead to better health
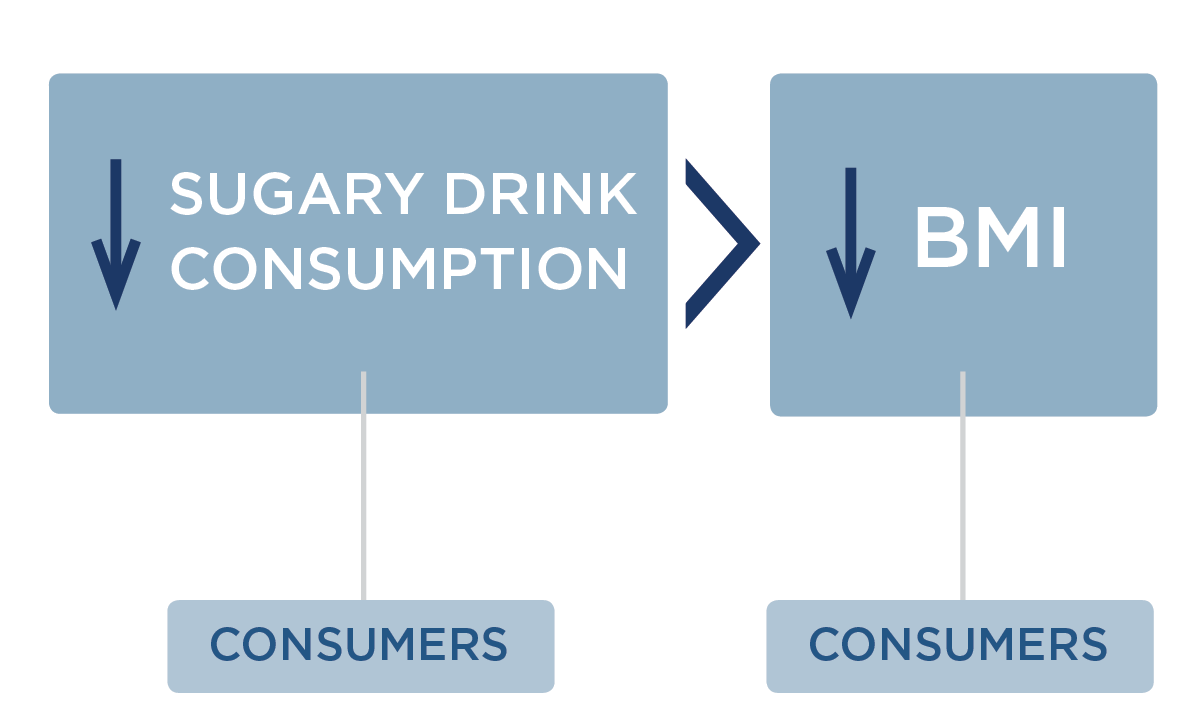
State excise tax is linked to change in BMI through change in sugary drink price and consumption
Key Terms
|
How does an excise tax work?
|
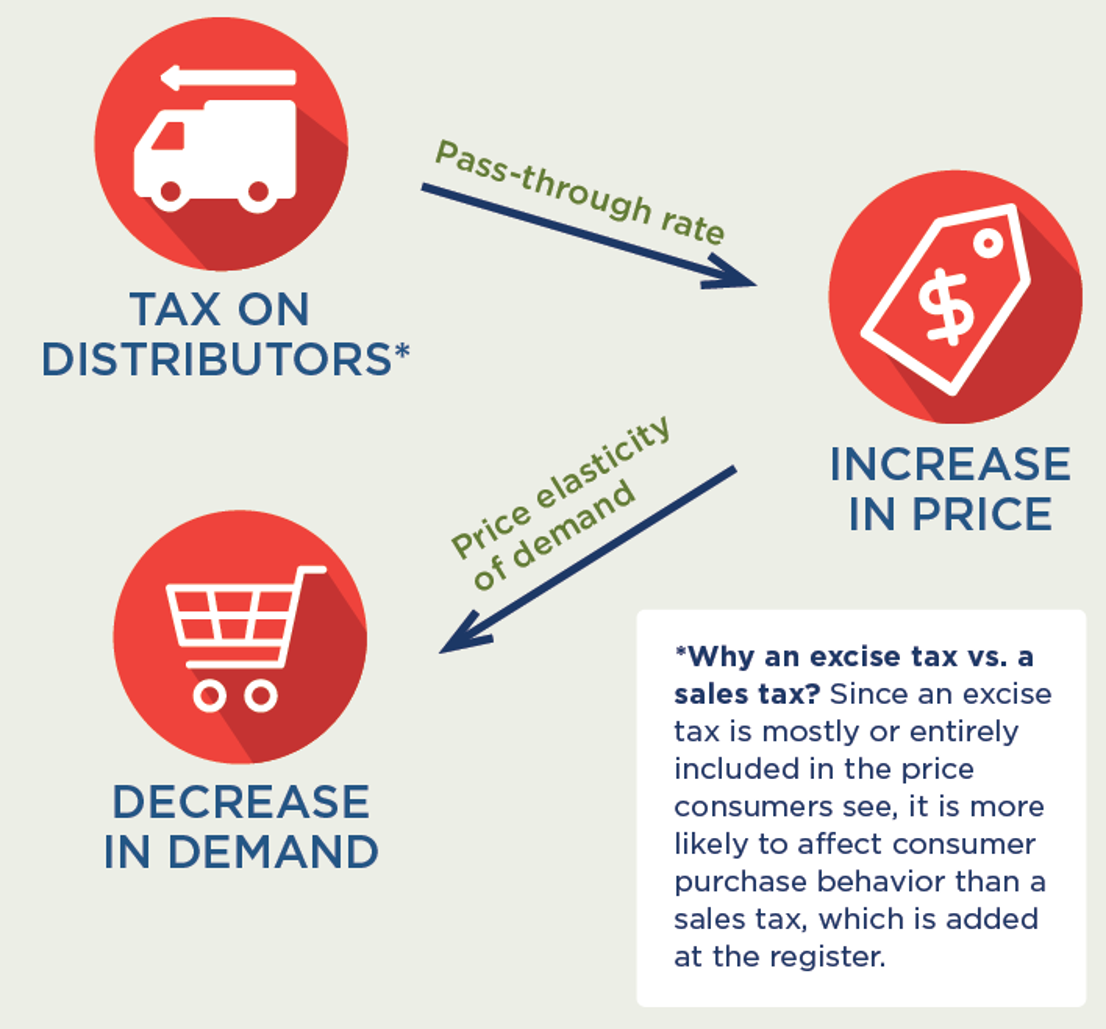
How does an excise tax on distributors affect the price paid by consumers?
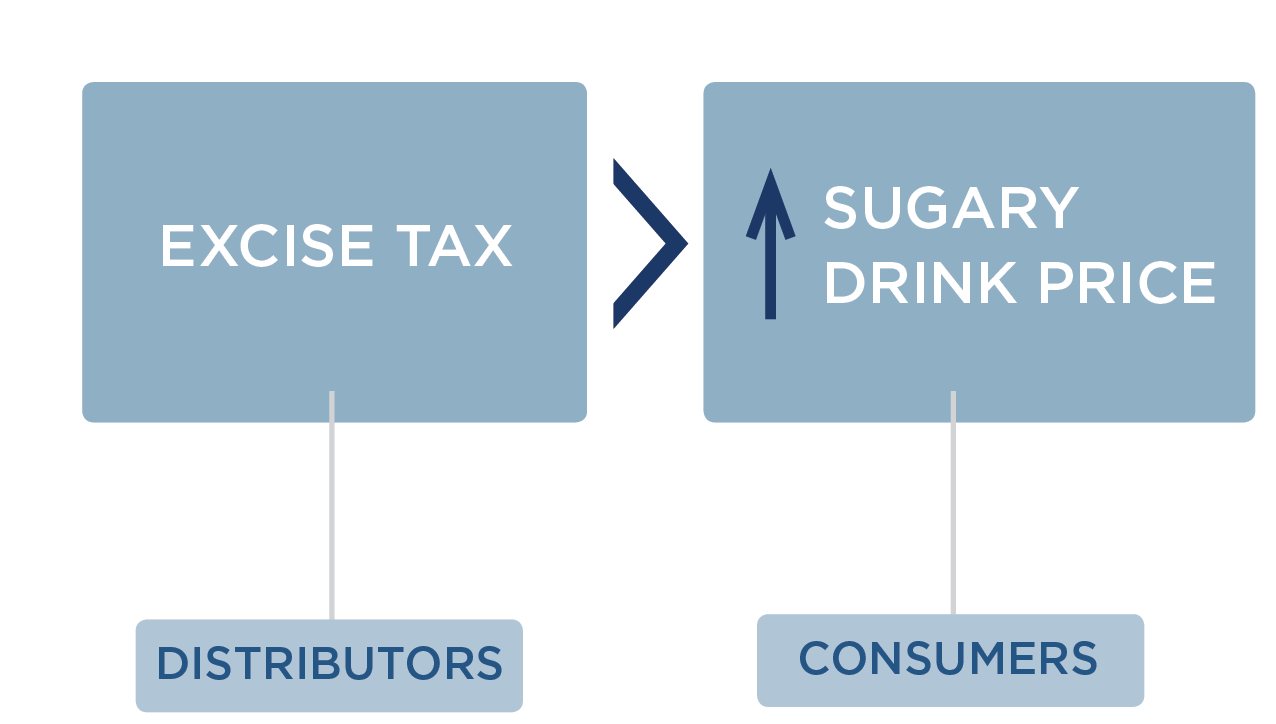
Since the cost of a sugary drink excise tax is incorporated directly into the beverage’s sticker price, an excise tax will likely influence consumer purchasing decisions more than a comparable sales tax that is added onto the item at the register. We assume 100% pass-through of the tax over 10 years and assume the tax rate would be adjusted annually for inflation. Our pass-through rate estimate is supported by empirical studies of excise taxes in Mexico and France that demonstrate near-complete pass through rates to consumers.23 Short term studies for the local tax in Berkeley indicate imperfect, or less than 100%, pass-through.3,24,25 The expected change in sugary drink price was estimated using an average of $0.06/ounce based on national sugary drink prices.26 The price per ounce in this study was based on a weighted average of sugary drink consumption across stores, restaurants and other sources according to the estimates from the National Health and Nutrition Examination Survey (NHANES) 2009-2010. The price per ounce of sugary drinks purchased in stores was calculated using weighted averages of two-liter bottles, 12-can cases, and single-serve containers based on 2010 Nielsen Homescan data.26 For example, a $0.02/ounce tax would raise the price of a 12-ounce can of soda from $0.72 to $0.96/can post-tax.
How does increasing the price of sugary drinks change individual sugary drink consumption?
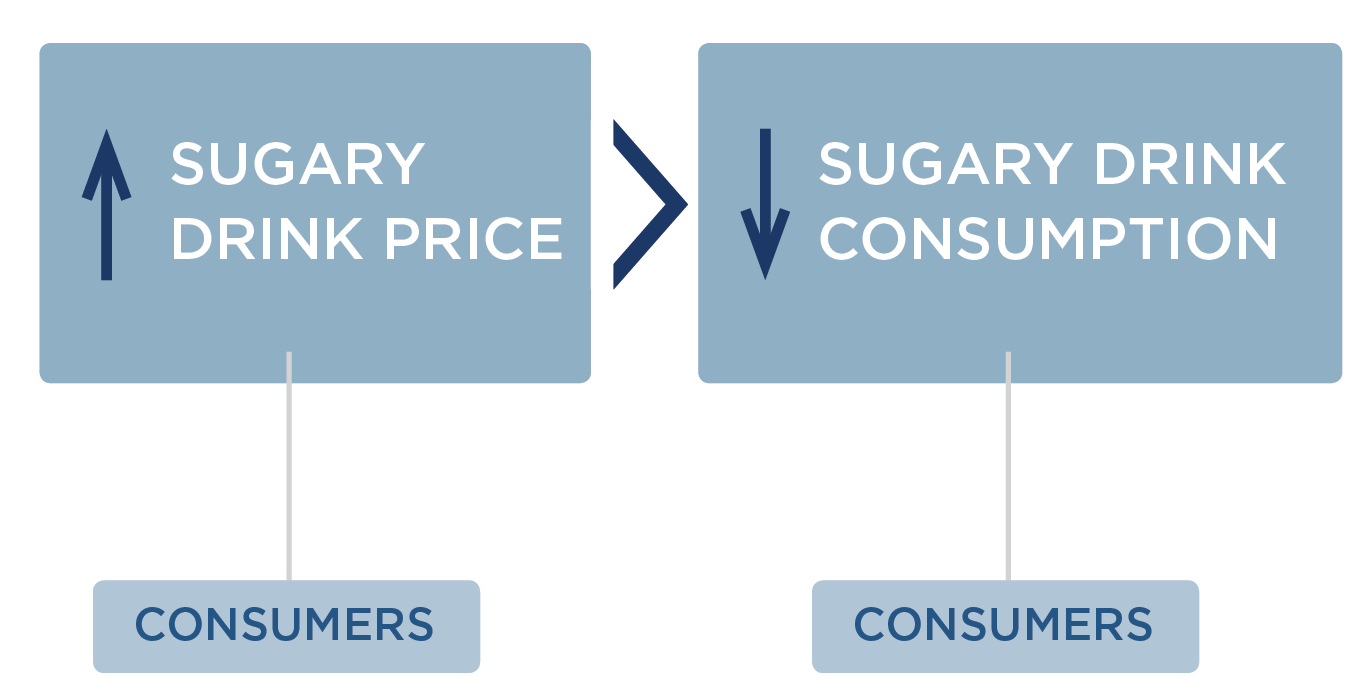
To estimate current sugary drink consumption levels in Minnesota, we used local estimates of adult sugary drink consumption from the Minnesota Behavioral Risk Factor Surveillance System12 and child sugary drink consumption from the Minnesota Student Survey27 based on race/ethnicity to adjust national estimates of sugary drink consumption from NHANES 2011-2014. How much consumers will change their purchases in response to price changes is called price elasticity for demand. We assume for every 10% increase in the price of sugary drinks, there will be a 12% reduction in purchases (a mean own-price elasticity of demand of -1.21).28 Recent research on the Berkeley, CA $0.01/ounce tax found a 21% reduction in sugary drink intake among populations experiencing low income, consistent with this estimate.24,29-32 More recent data before and after the sugary drink tax in Philadelphia indicate a larger own-price elasticity for sugary drinks.30
What are the individual health effects of decreasing sugary drink consumption?
Research has shown that decreasing sugary drink consumption can have positive effects on health in adults and youth. We estimated the impact of a change in sugary drink intake on body mass index (BMI), accounting for dietary compensation, based on rigorous studies identified in evidence reviews.22 The relationship among adults was modeled based on the range of estimated effects from four large, multi-year longitudinal studies, which indicated that a one-serving reduction in sugary drinks was associated with a BMI decrease of 0.21 kg/m2 to 0.57 kg/m2 in adults over a three-year period.16,33-35 Among youth, we used evidence from a double-blind randomized controlled trial conducted over 18 months, which found that reducing sugary drinks by eight ounces per day led to less weight gain (2.2 fewer pounds).36
Reach
The intervention applies to all children and adults in Minnesota. However, the model only looks at the effects on those 2 years of age and older.*
*BMI z-scores were used in our analyses, which are not defined for children under 2 years of age.
Cost
We assume the tax would incur start up and ongoing labor costs for tax administrators in the Minnesota Department of Revenue. To implement the intervention, the Minnesota Department of Revenue would need to process tax statements and conduct audits. Businesses would also need to prepare tax statements and participate in audits, which would require labor from private tax accountants. Cost information was drawn from localities with planned or implemented excise taxes on soft drinks to reflect the total estimated costs.22,37 The cost and benefit estimates do not include expected tax revenue.
CHOICES Microsimulation Model
The CHOICES microsimulation model for Minnesota was used to calculate the costs and effectiveness over 10 years (2017–2027). Cases of obesity prevented were calculated at the end of the model period in 2027. The model was based on prior CHOICES work,22,38 and created a virtual population of Minnesota residents using data from: U.S. Census, American Community Survey, Behavioral Risk Factor Surveillance System,12 NHANES, National Survey of Children’s Health,39 the Medical Expenditure Panel Survey, multiple national longitudinal studies, and obesity prevalence data provided by the Minnesota Department of Health. Using peer-reviewed methodology, we forecasted what would happen to this virtual population with and without a sugary drink tax to model changes in disease and mortality rates and health care costs due to the tax.
Results: $0.02/ounce State Excise Tax on Sugary Drinks
Overall, the model projects that a sugary drink excise tax is cost-saving. Compared to the simulated natural history without a tax, the tax is projected to result in lower levels of sugary drink consumption, fewer cases of obesity, fewer deaths, and health care savings greater than $160 million dollars over the 10-year period under consideration.
The estimated reduction in obesity attributable to the tax leads to lower projected health care costs, offsetting tax implementation costs and resulting in net cost savings. The difference between total health care costs with no intervention and lower health care costs with an intervention represent health care costs saved; these savings can be compared to the cost of implementing the tax to arrive at the metric of health care costs saved per $1 invested.
| Outcome | $0.02/ounce excise tax Mean (95% uncertainty interval) |
| 10-Year Reach* |
6,060,000 |
| First Year Reach* |
5,400,000 |
| Average Servings of Sugary Drinks Consumed per Year Prior to the Modeled Tax |
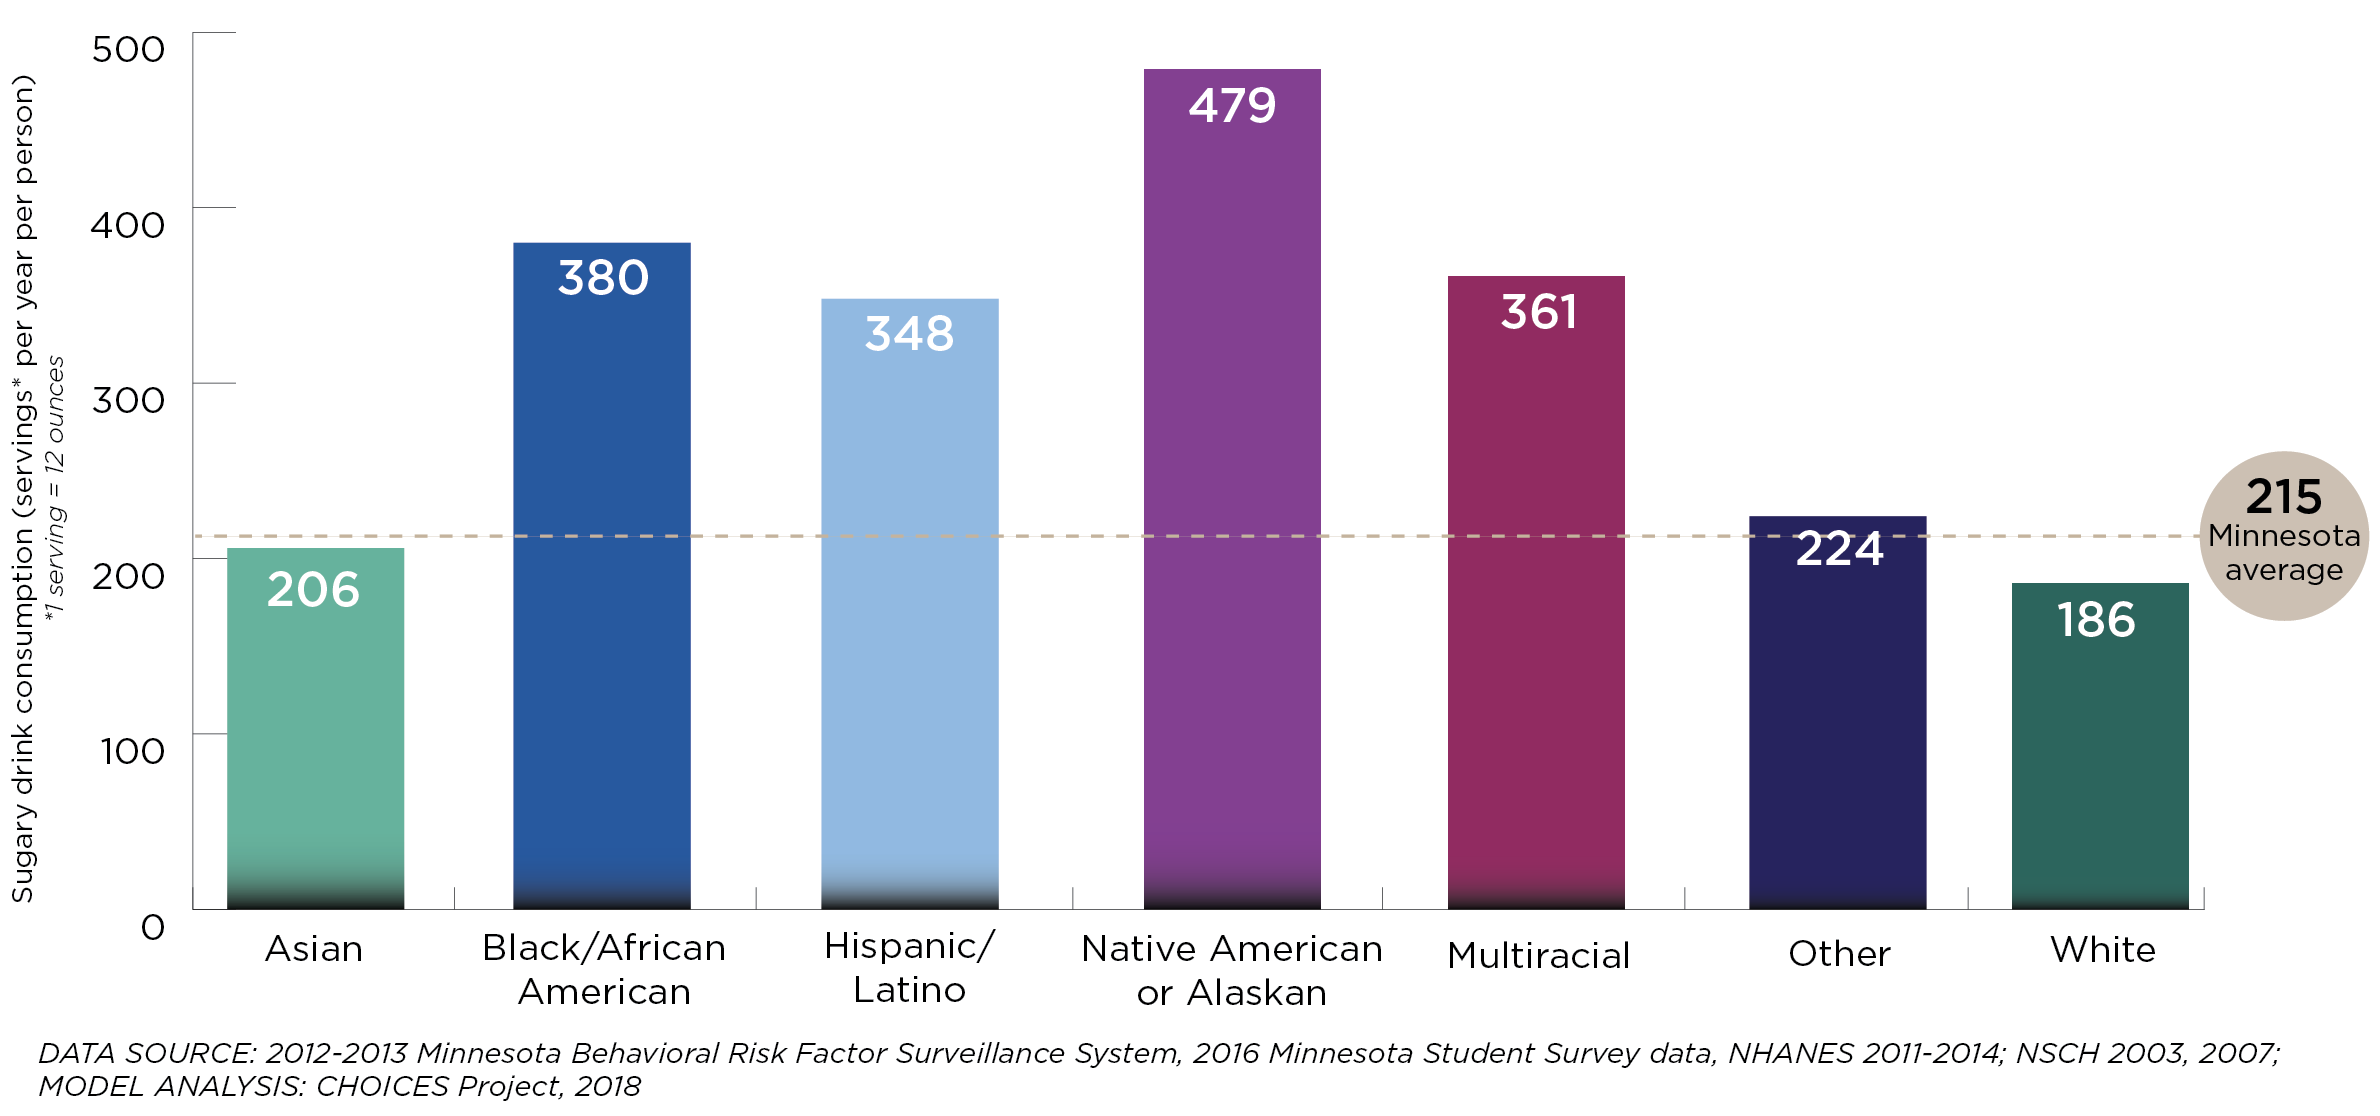
215 |
| Decrease in 12-Ounce Servings of Sugary Drinks per Person in the First Year of the Intervention* |
77.6 |
| Mean Reduction in BMI Units per Person* |
-0.169 |
| 10-Year Intervention Implementation Cost per Person |
$0.61 |
| Total Intervention Implementation Cost Over 10 Years** |
$3,700,000 |
| Annual Intervention Implementation Cost |
$370,000 |
| Health Care Costs Saved Over 10 Years |
$169,000,000 |
| Net Costs Difference Over 10 Years |
-$165,000,000 |
| Quality Adjusted Life Years (QALYs) Gained Over 10 Years |
8,190 |
| Years of Life Gained Over 10 Years |
2,110 |
| Deaths Prevented Over 10 Years* |
607 |
| Years with Obesity Prevented Over 10 Years |
242,000 |
| Health Care Costs Saved per $1 Invested Over 10 Years |
$45.60 |
| Cases of Obesity Prevented in 2027* |
34,700 |
| Cases of Childhood Obesity Prevented in 2027* |
9,250 |
| Cost per Year with Obesity Prevented Over 10 Years | Cost-saving |
| Cost per QALY Gained Over 10 Years | Cost-saving |
| Cost per YL Gained Over 10 Years | Cost-saving |
| Cost per Death Averted Over 10 Years | Cost-saving |
Uncertainty intervals are estimated by running the model 1,000 times, taking into account both uncertainty from data sources and virtual population projections, and calculating a central range in which 95 percent of the model results fell.
All metrics reported for the population over a 10-year period and discounted at 3% per year, unless otherwise noted.
*Not discounted.
**Total estimated costs for the Department of Revenue and businesses to implement the tax.
Results: $0.02/ounce State Excise Tax on Sugary Drinks By Race/Ethnicity Groups
There are differences in sugary drink consumption and obesity prevalence by race/ethnicity in Minnesota. The CHOICES model used Minnesota data to build a virtual Minnesota population. Without any intervention:
Sugary drink consumption is higher in several communities of color in Minnesota
Obesity prevalence is highest in the Black/African American, Hispanic/Latino, and Native American or Alaskan populations

| Outcome | Asian Mean (95% uncertainty interval) |
Black/African American Mean (95% uncertainty interval) |
Hispanic/Latino Mean (95% uncertainty interval) |
Native American or Alaskan Mean (95% uncertainty interval) |
Multiracial Mean (95% uncertainty interval) |
Other Mean (95% uncertainty interval) |
White Mean (95% uncertainty interval) |
| Average Servings of Sugary Drinks Consumed per Year Prior to the Modeled Tax | 206 (203; 208) |
380 (374; 386) |
348 (343; 353) |
479 (469; 492) |
361 (355; 367) |
224 (211; 239) |
186 (185; 187) |
| Decrease in 12-Ounce Servings of Sugary Drinks per Person in the First Year* | 72.8 (45.6; 129) |
136 (84.9; 237) |
126 (78.7; 222) |
173 (107; 317) |
130.2 (81.6; 235) |
80.3 (49.6; 150) |
67.2 (41.6; 121) |
| Reduction in Obesity Prevalence | 0.42% | 1.28% | 1.43% | 1.29% | 1.09% | 0.48% | 0.51% |
| QALYs Gained Over 10 Years | 189 (83; 391) |
744 (355; 1,520) |
675 (334; 1,350) |
225 (89; 516) |
241 (100; 489) |
12 (3; 47) |
6,110 (2,820; 12,900) |
| Years of Life Gained Over 10 Years | 31 (0; 99) |
180 (33; 479) |
82 (0; 236) |
67 (0; 204) |
47 (0; 147) |
5 (0; 46) |
1,690 (626; 3,940) |
| Additional Years Lived without Obesity (2017-2027) | 7,920 (3,770; 15,200) |
28,500 (15,800; 49,400) |
32,700 (17,100; 56,900) |
6,100 (3,200; 10,900) |
12,200 (5,990; 22,700) |
322 (152; 623) |
154,000 (78,800; 289,000) |
| Cases of Obesity Prevented in 2027* | 1,150 (552; 2,220) |
4,130 (2,190; 7,410) |
4,790 (2,440; 8,170) |
842 (411; 1,520) |
1,750 (835; 3,330) |
52 (17; 113) |
22,000 (11,500; 42,100) |
| Cases of Childhood Obesity Prevented in 2027* | 463 (164; 1,080) |
1,380 (637; 2,680) |
1,680 (740; 3,340) |
203 (70; 502) |
858 (359; 1,860) |
18 (4; 48) |
4,650 (2,110; 9,600) |
Uncertainty intervals are estimated by running the model 1,000 times, taking into account both uncertainty from data sources and virtual population projections, and calculating a central range in which 95 percent of the model results fell.
All metrics reported for the population over a 10-year period and discounted at 3% per year, unless otherwise noted.
*Not discounted.
Communities of color make up:
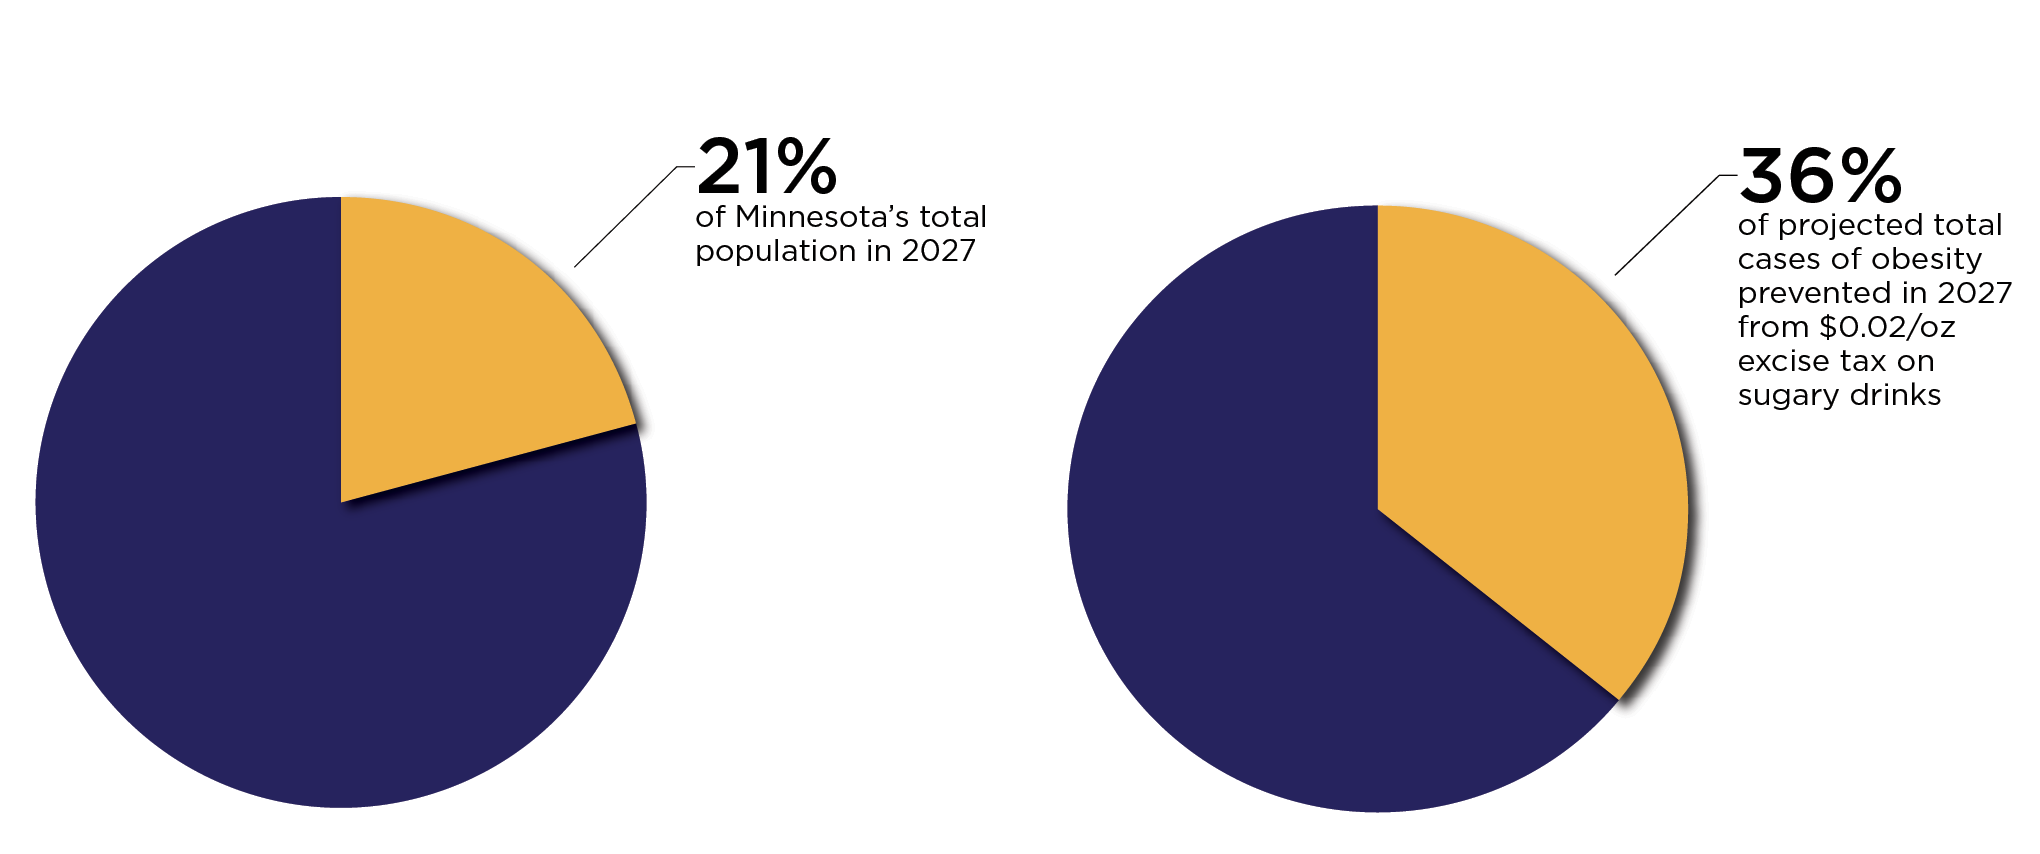
|
Metric |
|||||||
|
Asian |
Black/African American |
Hispanic/ Latino |
Native American or Alaskan |
Multiracial |
Other |
White |
|
|
Percent of Total Population in 2027* |
5% |
6% |
6% |
1% |
3% |
<1% |
79% |
|
Total Number of Cases of Obesity Prevented in 2027 |
1,150 |
4,130 |
4,790 |
842 |
1,750 |
52 |
22,000 |
|
Percent of Total Number of Cases of Obesity Prevented in 2027* |
3% |
12% |
14% |
2% |
5% |
<1% |
63% |
*All race/ethnicity data represents broad groupings. Due to data limitations, we were not able to identify subgroups within these broad categories. Some populations within each category with different lived experiences (income, immigrant/non-immigrant, social position, etc.) may differ significantly from the broad grouping related to obesity, sugary beverage consumption, and the impact of the excise tax.
Impact on Diabetes
We estimated the impact of the tax-induced reduction in sugary drink intake on diabetes incidence for adults ages 18-79 years using a published meta-analysis of the relative risk of developing diabetes due to a one-serving change in sugary drink consumption40 as well as local estimates of diabetes. On average, each 8.5 ounce serving of sugary drinks per day is estimated to increase the risk of diabetes by 18%.40
In Minnesota, we estimated that the proposed sugary drink excise tax would lead to a 3% reduction in diabetes incidence in the sugary drink tax models. Impact on diabetes incidence was calculated over a one-year period once the tax reaches its full effect. Impact on diabetes was calculated based on summary results from the model, not directly via microsimulation.
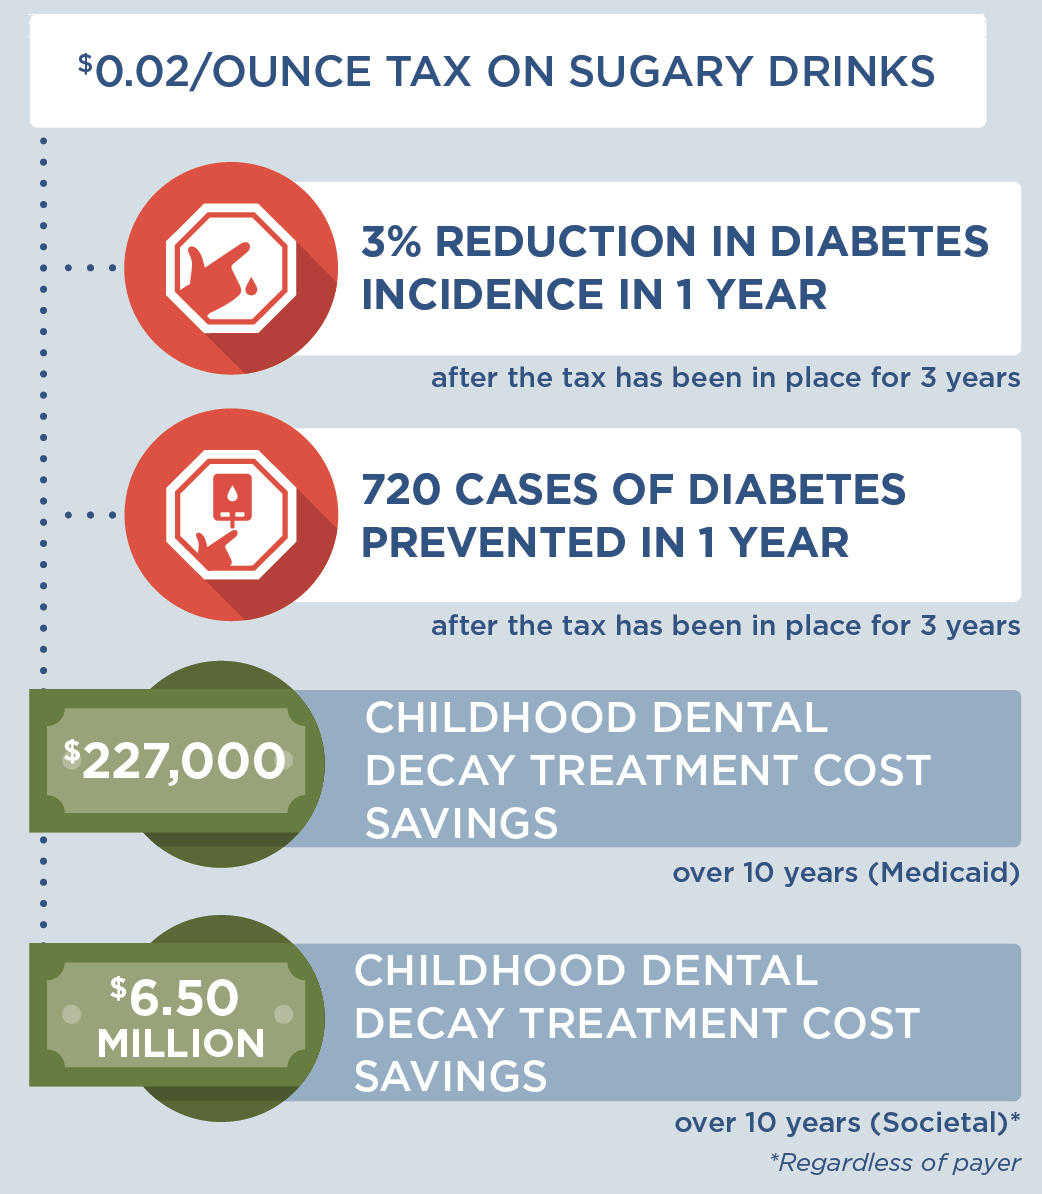
Impact on Tooth Decay
We estimated the impact of a sugary drink excise tax on tooth decay cost using a longitudinal analysis of the relationship between intake of sugars and tooth decay in adults. On average, for every 10 grams higher intake of sugar per day, there is an increase in decayed, missing, and filled teeth (i.e., tooth decay) of approximately 0.10 over 10 years.41 As described above, we assume that the excise tax will result in a reduction in sugary drink intake. There are many studies showing a similar relationship between higher intake of sugars and tooth decay in children and youth42 and thus we assume the same relationship as found in adults.
We used 2018 Minnesota Health Care Programs procedure code43 data to estimate a Medicaid cost of treating tooth decay as: $149.71 for a permanent crown in children and $32.57 for a filling in children. These codes reflect treatment for one surface and do not reflect higher reimbursement rates for multi-surface treatment, temporary crowns, or potential flat tax schedules. Based on analysis of data on tooth decay, fillings and crowns for the U.S. population from NHANES 1988-1994 (the last year crowns and fillings were separately reported),44 we estimate that 78.9% of tooth decay in children is fillings. Using this same data set, we estimate that 97.5% of treatment for children is fillings.
To estimate Medicaid-specific dental caries cost savings, we used local estimates of the numbers of people enrolled in Medicaid and the proportion receiving Medicaid dental services. Because of limited Medicaid dental coverage for adults in Minnesota, only children are included in the Medicaid-specific calculations. In Minnesota, we estimate that a $0.02/ounce tax would lead to a total over a period of 10 years in tooth decay savings of $227,000 in Medicaid savings. The Medicaid reimbursement tax estimates may underestimate the total cost savings of tooth decay treatment projected here as dental providers may charge higher amounts to patients.
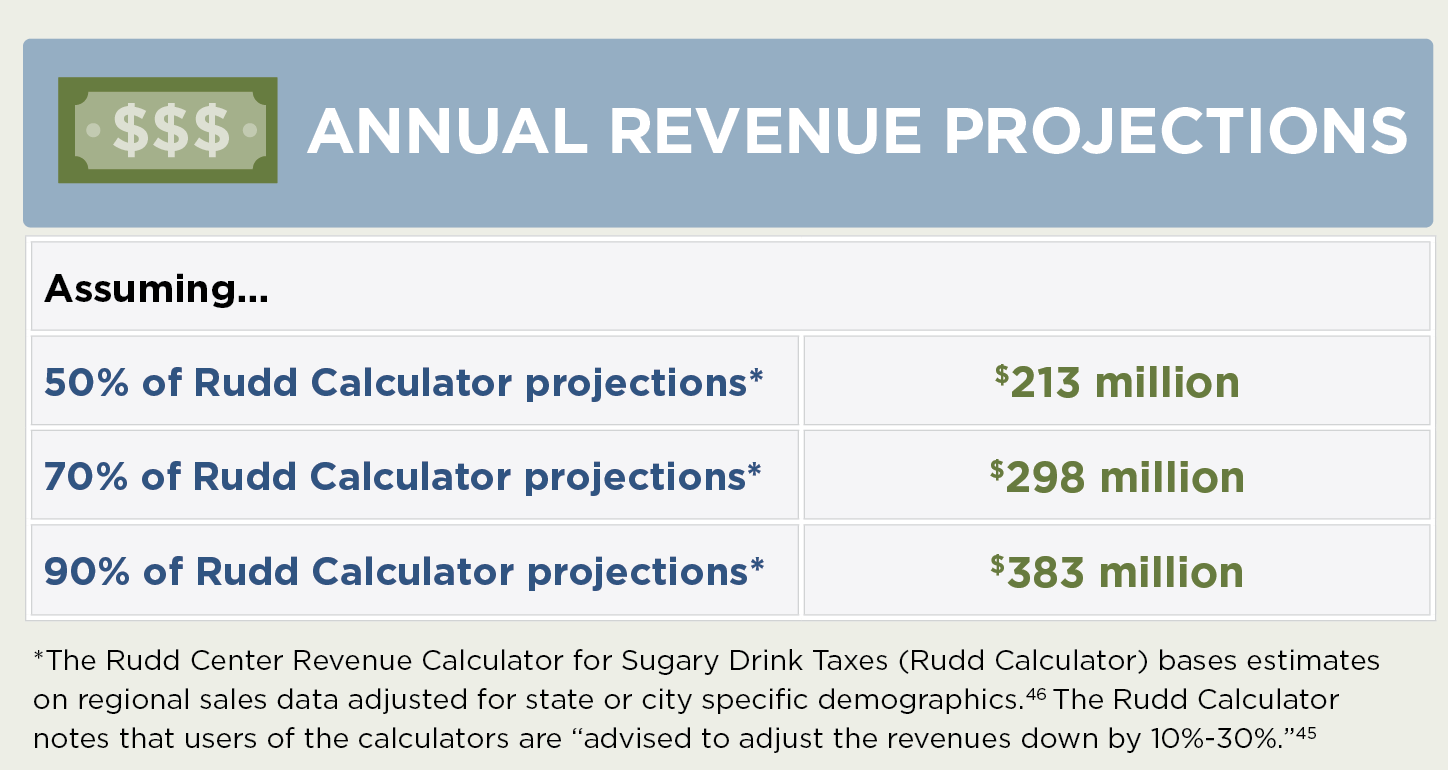
Potential Yearly Sugary Drink Tax Revenue from a $0.02/ounce Sugary Drink Tax
In addition to the projected cost savings of $165 million in net costs over 10 years, an excise tax will generate substantial annual revenue. A $0.02/ounce tax on sugary drinks in Minnesota could raise $213 million. This estimate of potential revenue assumes 50% of the projection reported on the Rudd Center Revenue Calculator for Sugary Drink Taxes (Rudd Calculator).45 The Rudd Calculator, which bases estimates on regional sales data adjusted for state or city specific demographics,46 is “intended to provide a rough estimate and starting point to project the revenue from a tax on sugary drinks.”45 Several factors could impact the potential for the tax to raise that amount. Retailers may have inventories of sugary drinks obtained before the tax was implemented. Residents living close to city, county and/or state borders may also purchase sugary drinks in neighboring communities without such a tax. Finally, there may be some distributors/manufacturers that are non-compliant with the tax. The Rudd sales data for specific states and/or cities within those regions may also vary from the regional average. The Rudd Calculator notes that users of the calculators are “advised to adjust the revenues down by 10%-30%.”45 For Minnesota, we provide a revenue projection assuming 50% of the Rudd Calculator projection, since surveillance data indicate that consumption of sugary drinks in Minnesota is low compared with other states in the region.46,47
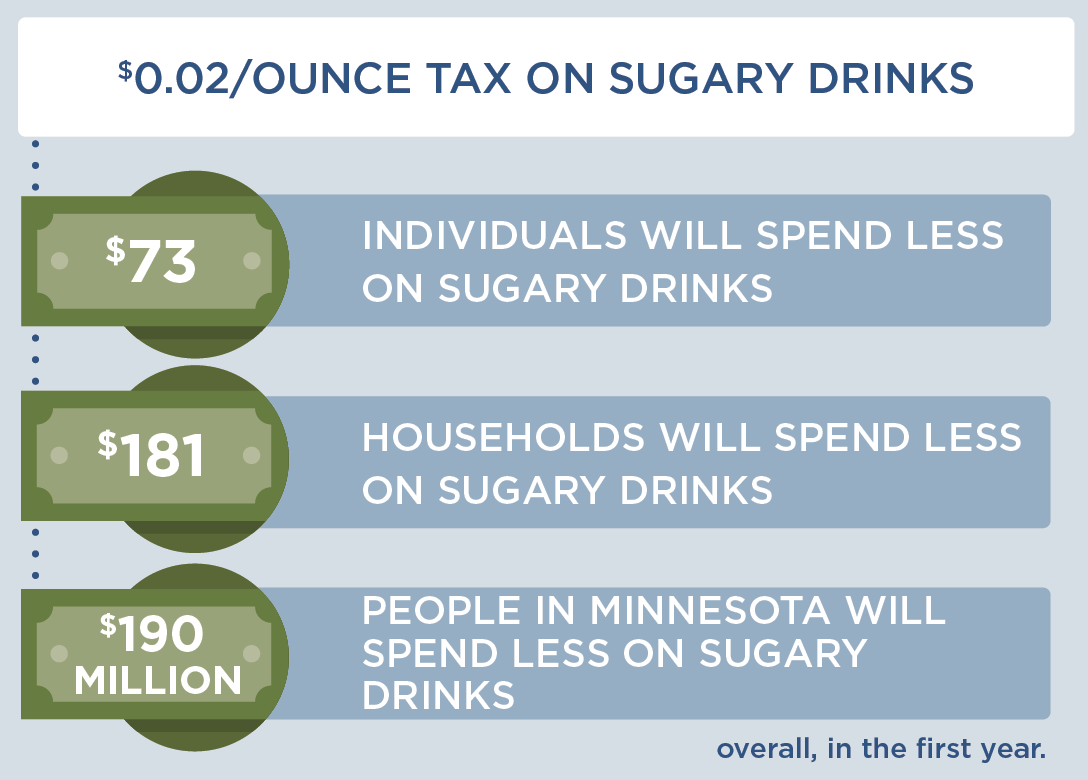
Considerations for Health Equity
Concerns have been raised regarding the impact of the tax on households with low income because populations with low income tend to consume more sugary drinks.48 Economic studies indicate that with a sugary drink tax, consumers will buy less of these products.28 This change in purchasing is substantial, so that consumers can be expected to spend less on sugary drinks after a tax is implemented. Using sales data from the Rudd Center Revenue Calculator for Sugary Drink Taxes (Rudd Calculator),45 we project that individuals and households in Minnesota will spend less money on sugary drinks after the tax. This would free up disposable income for other consumer purchases.
In addition to these changes in spending, health benefits are projected to be greatest among individuals with low income. We project that more health benefits from this policy will accrue to consumers with low income; the same is true for a number of racial and ethnic groups. Beverage companies frequently target their sugary drink advertising towards youth, and are more likely to target Black and Hispanic/Latino youth.13 In Minnesota, the average percentage of adults who drink one or more soda or sugary drink per day varies by racial and ethnic group, for example from 20% of non-Hispanic White adult residents to 39% of Hispanic/Latino adult Minnesota residents.9 Under the proposed tax, we project that Native American or Alaskan, Hispanic/Latino, Multiracial, and Black/African American Minnesota residents would see twice as high of a reduction in obesity prevalence compared to non-Hispanic White Minnesota residents. On that basis. the proposed tax should decrease inequities in obesity outcomes and improve health equity. These expected changes in sugary drink consumption and health outcomes have led health economists to calculate that populations with lower income have benefit from sugary drink taxes.49 In addition, revenue from a sugary drink tax could be reinvested in communities with lower income through a variety of approaches.50
Implementation Considerations
Revenue raised from a sugary drink tax can be reinvested in communities experiencing low income. For instance, in Berkeley, CA, sugary drink tax revenue has been allocated for spending on school and community programs, many serving populations with low income or communities of color to promote healthy eating, diabetes and obesity prevention.51,52 Public support for such taxes generally increases with earmarking for preventive health activities.52
There is opposition from the food and beverage industry, which spends billions of dollars promoting their products.53 Relatively small beverage excise taxes are currently applied across many states. The proposed tax is likely to be sustainable if implemented based on the successful history of tobacco excise taxes. There is potential for a shift in social norms of sugary drink consumption based on evidence from tobacco control tax and regulatory efforts.53 Implementing the tax could also serve as a powerful health education message to reduce added sugar consumption.
Conclusion
We project that a $0.02 per ounce sugary drink excise tax in Minnesota will prevent thousands of cases of childhood and adult obesity, improve health equity, prevent new cases of diabetes, increase healthy life years, and save more in future health care costs than it costs to implement. Revenue from the tax could be used for education and health promotion efforts. Implementing the tax could also serve as a powerful social signal to reduce sugar consumption.
Suggested Citation:
Ambroz TA, Pelletier JE, Long MW, Ward ZJ, Giles CM, Barrett JL, Cradock AL, Resch SC, Greatsinger A, Tao H, Flax CN, Gortmaker SL. Minnesota: Sugary Drink Excise Tax [Report]. Minnesota Department of Health, St. Paul, MN, and the CHOICES Learning Collaborative Partnership at the Harvard T.H. Chan School of Public Health, Boston, MA; August 2022.
The design for this report and its graphics were developed by Molly Garrone, MA and partners at Burness.
Funded by The JPB Foundation. Results are those of the authors and not the funders.
References
-
American Public Health Association Taxes on Sugar-Sweetened Beverages. 2012.
-
Hakim D, Confessore N. Paterson seeks huge cuts and $1 billion in taxes and fees. New York Times. January 19, 2010.
-
Falbe J, Rojas N, Grummon AH, Madsen KA. Higher Retail Prices of Sugar-Sweetened Beverages 3 Months After Implementation of an Excise Tax in Berkeley, California. American Journal of Public Health. 2015;105(11):2194-2201.
-
Leonhardt D. The battle over taxing soda. The New York Times. May 19, 2010.
-
Kit BK, Fakhouri THI, Park S, Nielsen SJ, Ogden CL. Trends in sugar-sweetened beverage consumption among youth and adults in the United States: 1999-2010. American Journal of Clinical Nutrition. 2013;98(1):180-188.
-
Bleich SN, Vercammen KA, Koma JW, Li ZH. Trends in Beverage Consumption Among Children and Adults, 2003-2014. Obesity. 2018;26(2):432-441.
-
Vercammen KA, Moran AJ, Soto MJ, Kennedy-Shaffer L, Bleich SN (2020). Decreasing Trends in Heavy Sugar-Sweetened Beverage Consumption in the United States, 2003-2016. Journal of the Academy of Nutrition and Dietetics. 2020 Dec;120(12):1974-1985.e5.
-
U.S. Department of Health and Human Services, U.S. Department of Agriculture. 2020 – 2025 Dietary Guidelines for Americans. December 2020.
-
Park S, Xu F, Town M, Blanck H. Prevalence of Sugar-Sweetened Beverage Intake Among Adults – 23 States and the District of Columbia. MMWR Morb Mortal Wkly Report 2016. 2013;65(7):169-174.
-
Minnesota Department of Health. Minnesota Student Survey. Minnesota Department of Health, Minnesota Center for Health Statistics; 2013.
-
Brownell KD, Frieden TR. Ounces of Prevention – The Public Policy Case for Taxes on Sugared Beverages. N Engl J Med. 2009;360(18):1805-1808.
-
Minnesota Department of Health. Minnesota Behavioral Risk Factor Surveillance Survey (BRFSS). Centers for Disease Control and Prevention, National Center for Chronic Disease Prevention and Health Promotion, Division of Population Health; 2013.
-
Harris J, Shehan C, Gross R, et al. Food advertising targeted to Hispanic and Black youth: Contributing to health disparities. August 2015.
-
Yancey AK, Cole BL, Brown R, et al. A cross-sectional prevalence study of ethnically targeted and general audience outdoor obesity-related advertising. Milbank Q. 2009;87(1):155-184.
-
Malik VS, Pan A, Willett WC, Hu FB. Sugar-sweetened beverages and weight gain in children and adults: a systematic review and meta-analysis. The American Journal of Clinical Nutrition. 2013;98(4):1084-1102.
-
Chen L, Caballero B, Mitchell DC, et al. Reducing Consumption of Sugar-Sweetened Beverages Is Associated with Reduced Blood Pressure: A Prospective Study among U.S. Adults. Circulation. 2010;121(22):2398-2406.
-
Wang Y. The potential impact of sugar-sweetened beverage taxes in New York State. A report to the New York State Health Commissioner. New York: Columbia Mailman School of Public Health. 2010.
-
IOM (Institute of Medicine), National Research Council. Local Government Actions to Prevent Childhood Obesity. Washington, DC: The National Academies Press; 2009.
-
Chaloupka F, Powell L, Chriqui J. Sugar-sweetened beverage taxes and public health: A Research Brief. Minneapolis, MN2009.
-
Brownell KD, Farley T, Willett WC, et al. The Public Health and Economic Benefits of Taxing Sugar-Sweetened Beverages. N Engl J Med. 2009;361(16):1599-1605.
-
Long M, Gortmaker S, Ward Z, et al. Cost Effectiveness of a Sugar-Sweetened Beverage Excise Tax in the U.S. Am J Prev Med. 2015;49(1):112-123.
-
Gortmaker SL, Wang YC, Long MW, et al. Three Interventions That Reduce Childhood Obesity Are Projected To Save More Than They Cost To Implement. Health Aff. 2015;34(11):1932-1939.
-
Colchero MA, Salgado JC, Unar-Munguia M, Molina M, Ng SW, Rivera-Dommarco JA. Changes in Prices After an Excise Tax to Sweetened Sugar Beverages Was Implemented in Mexico: Evidence from Urban Areas. PLoS One. 2015;10(12):11.
-
Falbe J, Thompson HR, Becker CM, Rojas N, McCulloch CE, Madsen KA. Impact of the Berkeley Excise Tax on Sugar-Sweetened Beverage Consumption. American Journal of Public Health. 2016;106(10):1865-1871.
-
Ng S, Silver L, Ryan-Ibarra S, et al. Berkeley Evaluation of Soda Tax (BEST) Study Preliminary Findings. Presentation at the annual meeting of the American Public Health Association. Paper presented at: Presentation at the annual meeting of the American Public Health Association; November, 2015; Chicago, IL.
-
Powell L, Isgor z, Rimkus L, Chaloupka F. Sugar-sweetened beverage prices: Estimates from a national sample of food outlets. Chicago, IL: Bridging the Gap Program, Health Policy Center, Institute for Health Research and Policy, University of Illinois at Chicago;2014.
-
Minnesota Department of Health. Minnesota Student Survey. Minnesota Department of Health, Minnesota Center for Health Statistics; 2007-2016
-
Powell LM, Chriqui JF, Khan T, Wada R, Chaloupka FJ. Assessing the Potential Effectiveness of Food and Beverage Taxes and Subsidies for Improving Public Health: A Systematic Review of Prices, Demand and Body Weight Outcomes. Obesity Reviews. 2013;14(2):110-128.
-
Roberto CA, Lawman HG, LeVasseur MT, Mitra N, Peterhans A, Herring B, Bleich SN. Association of a Beverage Tax on Sugar-Sweetened and Artificially Sweetened Beverages With Changes in Beverage Prices and Sales at Chain Retailers in a Large Urban Setting. JAMA. 2019 May 14;321(18):1799-1810. doi: 10.1001/jama.2019.4249.
-
Lee MM, Falbe J, Schillinger D, Basu S, McCulloch CE, Madsen KA. Sugar-Sweetened Beverage Consumption 3 Years After the Berkeley, California, Sugar-Sweetened Beverage Tax. American Journal of Public Health. 2019;109(4):637-639.
-
Zhong Y, Auchincloss AH, Lee BK, Kanter GP. The Short-Term Impacts of the Philadelphia Beverage Tax on Beverage Consumption. American Journal of Preventive Medicine. 2018;55(1):26-34.
-
Silver LD, Ng SW, Ryan-Ibarra S, et al. Changes in prices, sales, consumer spending, and beverage consumption one year after a tax on sugar-sweetened beverages in Berkeley, California, US: A before-and-after study. PLoS Medicine. 2017;14(4):e1002283
-
Mozaffarian D, Hao T, Rimm EB, Willett WC, Hu FB. Changes in Diet and Lifestyle and Long-Term Weight Gain in Women and Men. New England Journal of Medicine. 2011;364(25):2392-2404.
-
Palmer JR, Boggs DA, Krishnan S, Hu FB, Singer M, Rosenberg L. Sugar-Sweetened Beverages and Incidence of Type 2 Diabetes Mellitus in African American Women. Archives of Internal Medicine. 2008;168(14):1487-1492.
-
Schulze MB, Manson JE, Ludwig DS, et al. Sugar-sweetened beverages, weight gain, and incidence of type 2 diabetes in young and middle-aged women. Journal of the American Medical Association. 2004;292(8):927-934.
-
de Ruyter JC, Olthof MR, Seidell JC, Katan MB. A trial of sugar-free or sugar-sweetened beverages and body weight in children. New England Journal of Medicine. 2012;367(15):1397-1406.
-
Healthy Food America. Implementing Sugary Drink Taxes: Outreach, Collection, and Fighting Industry Litigation. [Webinar]. 2017; http://www.healthyfoodamerica.org/webinars.
-
Ward ZJ, Long MW, Resch SC, Giles CM, Cradock AL, Gortmaker SL. Simulation of Growth Trajectories of Childhood Obesity into Adulthood. N Engl J Med. 2017;377(22):2145-2153.
-
Long MW, Ward Z, Resch SC, et al. State-level estimates of childhood obesity prevalence in the United States corrected for report bias. Int J Obes. 2016;40(10):1523-1528.
-
Imamura F, O’Connor L, Ye Z, Mursu J, Hayashino Y, Bhupathiraju SN, Forouhi NG. Consumption of sugar sweetened beverages, artificially sweetened beverages, and fruit juice and incidence of type 2 diabetes. Br J Sports Med. 2016 Apr;50(8):496-504
-
Bernabé E, Vehkalahti MM, Sheiham A, Lundqvist A, Suominen AL. The Shape of the Dose-Response Relationship between Sugars and Caries in Adults. J Dent Res. 2016;95(2):167-172.
-
Sheiham A, James WPT. A new understanding of the relationship between sugars, dental caries and fluoride use: implications for limits on sugars consumption. Public Health Nutr. 2014;17(10):2176-2184.
-
Minnesota Health Care Program (MHCP) Minnesota Health Care Program Reimbursement Fee Schedule. 2018.
-
Ward Z, et al. NHANES III Dental Examination: An Incisive Report. unpublished report; 2018.
-
UConn Rudd Center for Food Policy & Obesity. Sugary Drink Tax Calculator. https:// uconnruddcenter.org/tax-calculator. Accessed February 2021.
-
Andreyeva T, Chaloupka F, Powell L. DATA AND ASSUMPTIONS (TAX CALCULATOR REVISION, MARCH 2017. http://www.uconnruddcenter.org/files/Pdfs/Calculator%20Data_Methods_71917.pdf
-
Park S, Xu F, Town M, Blanck HM. Prevalence of Sugar-Sweetened Beverage Intake Among Adults–23 States and the District of Columbia, 2013. MMWR Morb Mortal Wkly Rep. 2016 Feb 26;65(7):169-74. doi: 10.15585/mmwr.mm6507a1.
-
Han E, Powell LM. Consumption patterns of sugar-sweetened beverages in the United States. Journal of the Academy of Nutrition and Dietetics. 2013;113(1):43-53.
-
Allcott H, Lockwood BB, Taubinsky D. Should We Tax Sugar-Sweetened Beverages? An Overview of Theory and Evidence. J Econ Perspect. 2019; 33 no 3: 202–27.
-
Krieger J, Bleich SN, Scarmo S, Ng SW. Sugar-Sweetened Beverage Reduction Policies: Progress and Promise. Annu Rev Public Health. 2021 Apr 1;42:439-461.
-
Lynn J. City Council votes to allocate ‘soda tax’ revenue to school district, city organizations. The Daily Californian. Jan. 20, 2016.
-
Friedman R. Public Opinion Data, 2013. New Haven, CT: Yale Rudd Center for Food Policy & Obesity; 2013.
-
Federal Trade Commission. A review of food marketing to children and adolescents: follow-up report. Washington, DC Dec 2012 2012.
-
Frieden TR, Mostashari F, Kerker BD, Miller N, Hajat A, Frankel M. Adult tobacco use levels after intensive tobacco control measures: New York City, 2002-2003. American Journal of Public Health. 2005;95(6):1016-1023.