The information in this brief is intended only to provide educational information.
This brief summarizes findings from the CHOICES Learning Collaborative Partnership simulation model of implementing an Active Physical Education (PE) program in school districts participating in the Live Well Allegheny initiative in Allegheny County, Pennsylvania. Live Well Allegheny Schools will commit that 50% of PE class time be dedicated to moderate-to-vigorous physical activity (MVPA).
The Issue
One objective of the Allegheny County Health Department (ACHD) Community Health Improvement Plan is to decrease obesity in school-age children. Research shows that physical activity helps kids grow up at a healthy weight and reduces the risk of future chronic disease.1 However, many kids do not get enough daily physical activity,2 and without action, a majority of today’s children will have obesity at age 35.3 This has substantial financial implications. The health care costs for treating obesity-related health conditions like heart disease and diabetes were $147 billion in 2008.4
PE programs in schools can help students get the recommended amount of physical activity per day.1 However, research shows that children often spend less than half of PE class being physically active.5 Improving the quality of PE classes in ways that ensure that children are more active during class time will not only help children get more physical activity, but can also encourage children to develop habits to ensure an active and healthy lifestyle.1 The purpose of this study is to estimate the cost-effectiveness of implementing Active PE, which requires that at least 50% of PE class time be spent in MVPA.
About Active PE
The ACHD envisions that Active PE could be implemented in school districts that have partnered with Live Well Allegheny, a county-wide campaign to improve the health and wellness of Allegheny County residents. Implementation of Active PE would include dissemination of the evidence-based program SPARK PE to eligible elementary and middle schools. SPARK is a well-evaluated and widely used curriculum and training program that has been found to increase MVPA time in PE class.6
SPARK trainers would lead two-day workshops to train PE teachers on how to use and implement the SPARK PE curriculum. Participating schools would receive SPARK curricula, instructional materials, and equipment. Implementation would include a county-level PE Educational Specialist to provide oversight and monitoring of policy implementation, as well as ongoing training and support for teachers and schools each year.
Comparing Costs and Outcomes
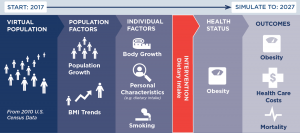
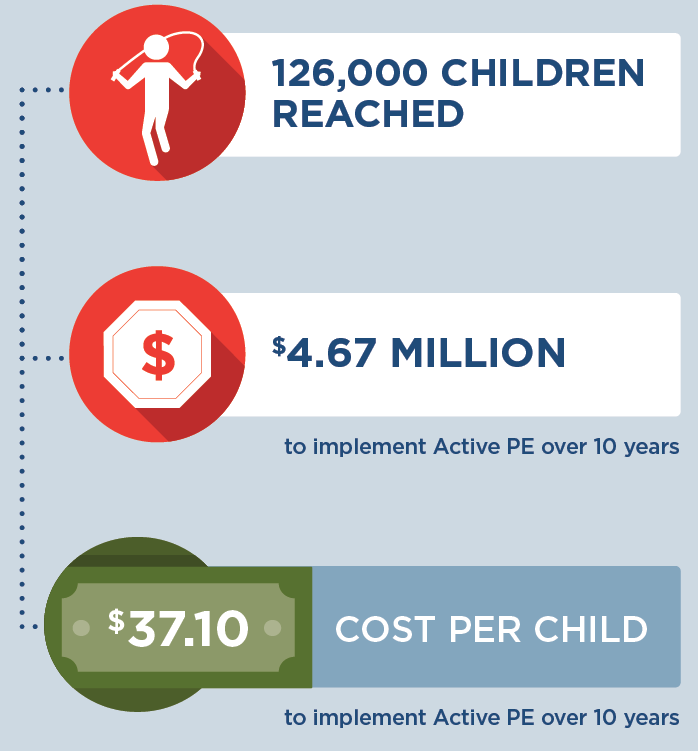
CHOICES cost-effectiveness analysis compared the costs and outcomes of the implementation of the Active PE program in designated Live Well Allegheny school districts over a 10-year time horizon with the costs and outcomes of not implementing the intervention. We assumed that all elementary and middle schools serving grades K-8 that are part of the 18 designated Live Well Allegheny school districts would receive training from SPARK. The model assumes that 70% of the PE teachers trained would implement Active PE program in their schools.7,8
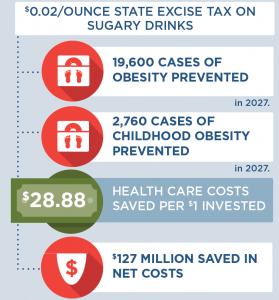
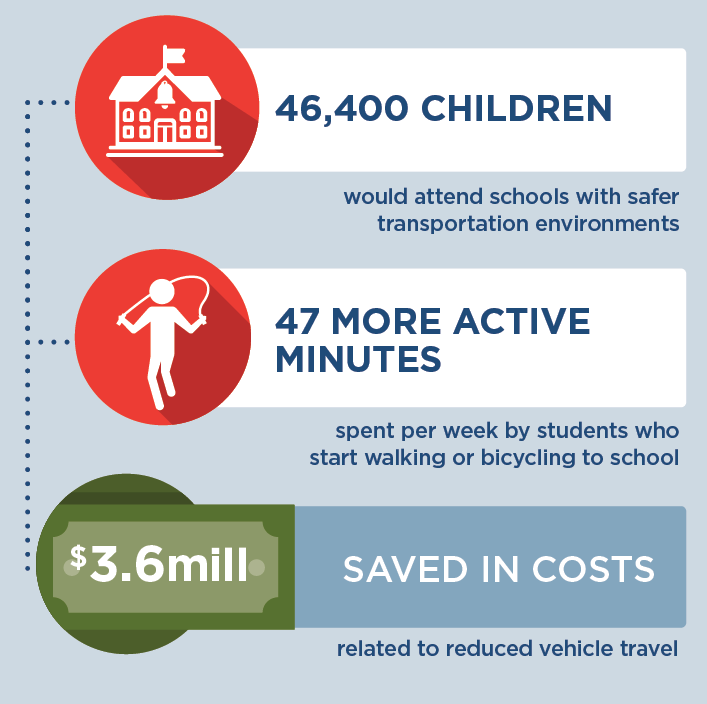
Implementing Active PE is an investment in the future. By the end of 2027: |
Conclusions and Implications
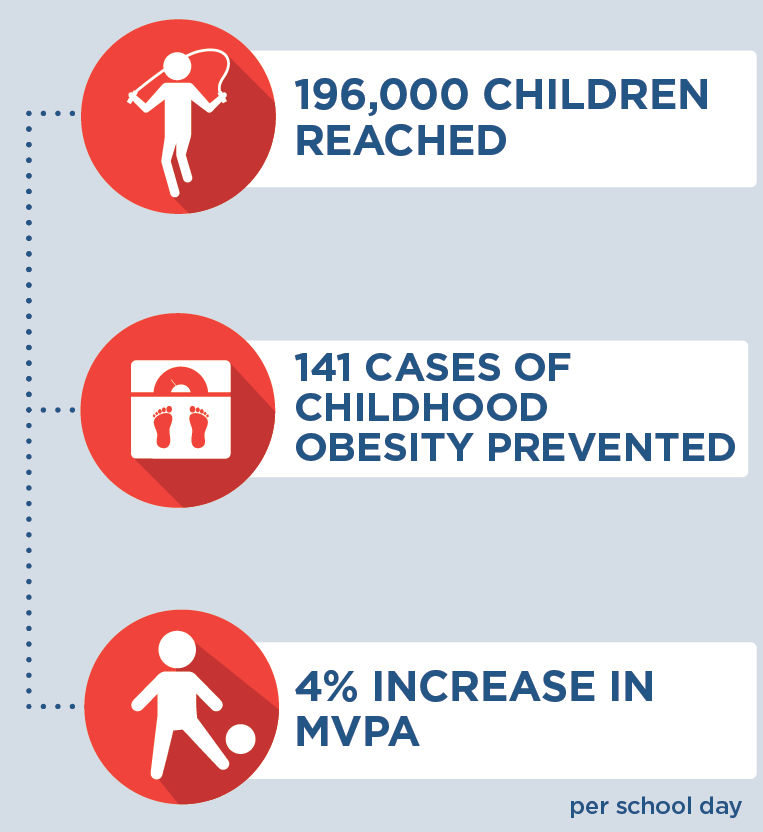
The implementation of Active PE using the evidence-based program SPARK within Live Well Allegheny Schools is projected to improve the health of many children in Allegheny County. The intervention would help ensure that 62,100 children attend schools with more active PE classes and would cost $2.29 million dollars to implement over 10 years, at an average of $37 per child. In schools that implement the Active PE program, on average we estimate that students would get 7 additional minutes of MVPA per school week, which is a 3% increase in MVPA. We estimate there will be 13 fewer cases of childhood obesity in the final year of the model as a result of implementation of Active PE.
SPARK training offers a professional development opportunity for teachers to improve instructional strategies to foster a fun and enjoyable environment where children can gain lifelong skills to engage in physical activity.10 There are also other likely positive benefits from physical activity related to improved bone health, aerobic and muscular fitness, cognition, and academic performance1 that are not quantified in this analysis but are important outcomes for children’s education and well-being.
Active PE is one evidence-based strategy that can benefit the majority of students in a school where most children attend PE classes and can be incorporated into a comprehensive plan to address childhood obesity. Leaders should use the best available evidence to select strategies to help children be more active.
References
- 2018 Physical Activity Guidelines Advisory Committee. 2018 Physical Activity Guidelines Advisory Committee Scientific Report. Washington, DC: U.S. Department of Health and Human Services, 2018. Accessed September 7, 2018.
- Child and Adolescent Health Measurement Initiative. 2016-2017 National Survey of Children’s Health (NSCH) data query. Data Resource Center for Child and Adolescent Health supported by Cooperative Agreement U59MC27866 from the U.S. Department of Health and Human Services, Health Resources and Services Administration’s Maternal and Child Health Bureau (HRSA MCHB). Retrieved [02/08/2019] from www. childhealthdata.org. CAHMI: www.cahmi.org.
- Ward Z, Long M, Resch S, Giles C, Cradock A, Gortmaker S. Simulation of Growth Trajectories of Childhood Obesity into Adulthood. New England Journal of Medicine. 2017; 377(22): 2145-2153.
- Finkelstein EA, Trogdon JG, Cohen JW, Dietz W. Annual Medical Spending Attributable To Obesity: Payer-And Service-Specific Estimates. Health Affairs. 2009;28(5).
- Institute of Medicine. Educating the Student Body: Taking Physical Activity and Physical Education to School. Washington, DC: National Academies Press; 2013.
Sallis, J. F., McKenzie, T. L., Alcaraz, J. E., Kolody, B., Faucette, N., & Hovell, M. F. (1997). The effects of a 2-year physical education program (SPARK) on physical activity and fitness in elementary school students. Sports, Play and Active Recreation for Kids. American Journal of Public Health, 87(8), 1328-1334. - Hoelscher DM, Feldman HA, Johnson CC, et al. School-based health education programs can be maintained overtime: results from the CATCH Institutionalization study. Prev Med. May 2004;38(5):594-606.
- McKenzie TL, Li D, Derby CA, Webber LS, Luepker RV, Cribb P. Maintenance of effects of the CATCH physical education program: results from the CATCH-ON study. Health Education Behavior. Aug 2003;30(4):447-462.
- Cradock, A. L., Barrett, J. L., Kenney, E. L., Giles, C. M., Ward, Z. J., Long, M. W., … & Gortmaker, S. L. Using cost-effectiveness analysis to prioritize policy and programmatic approaches to physical activity promotion and obesity prevention in childhood. Preventive Medicine. 2017; 95, S17-S27.
- Society of Health and Physical Educators (SHAPE). Physical Education Guidelines. Retrieved from: https://www.shapeamerica.org/standards/guidelines/peguidelines.aspx Accessed 13 April 2018.
- McKenzie, T. L., Sallis, J. F., & Rosengard, P. (2009). Beyond the stucco tower: Design, development, and dissemination of the SPARK physical education programs. Quest, 61(1), 114-127.
Suggested Citation:Pagnotta M, Hardy H, Reiner J, Barrett J, Cradock A. Allegheny County Active Physical Education (PE) [Issue Brief]. Allegheny County Health Department, Pittsburgh, PA, and the CHOICES Learning Collaborative Partnership at the Harvard T.H. Chan School of Public Health, Boston, MA; December, 2019. |
This issue brief was developed at the Harvard T.H. Chan School of Public Health in collaboration with the Allegheny County Health Department (ACHD) through participation in the Childhood Obesity Intervention Cost-Effectiveness Study (CHOICES) Learning Collaborative Partnership. This brief is intended for educational use only.


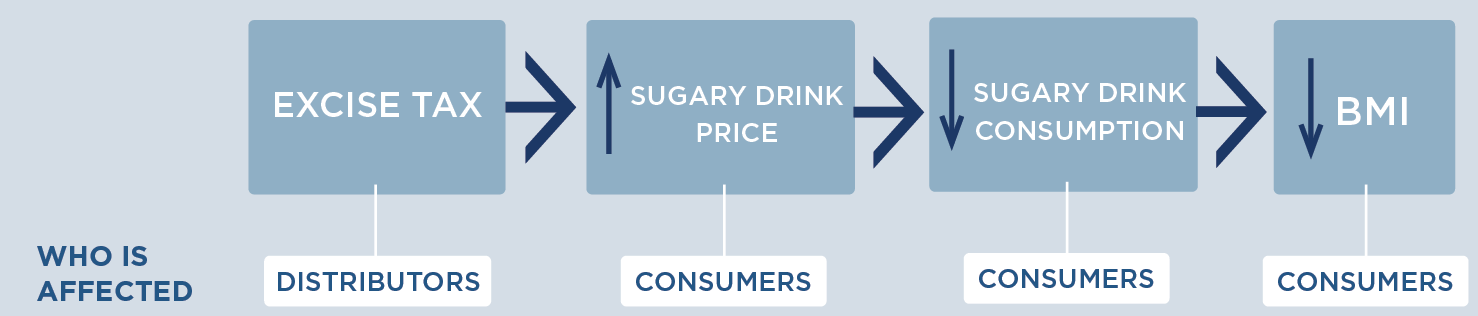
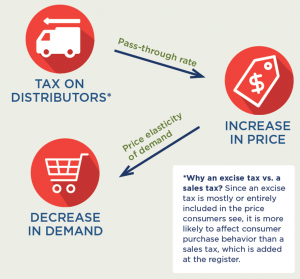
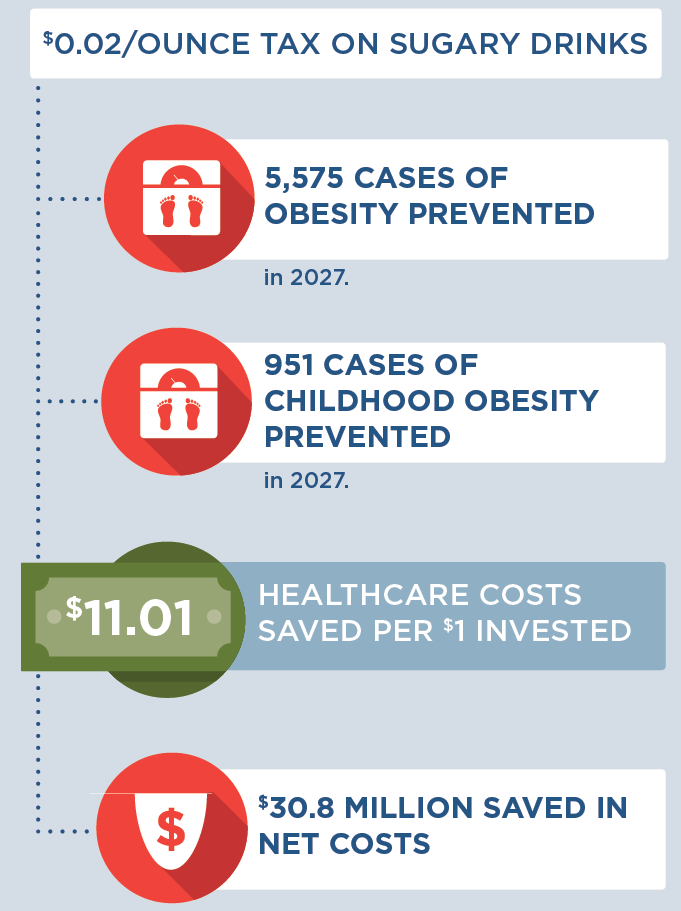
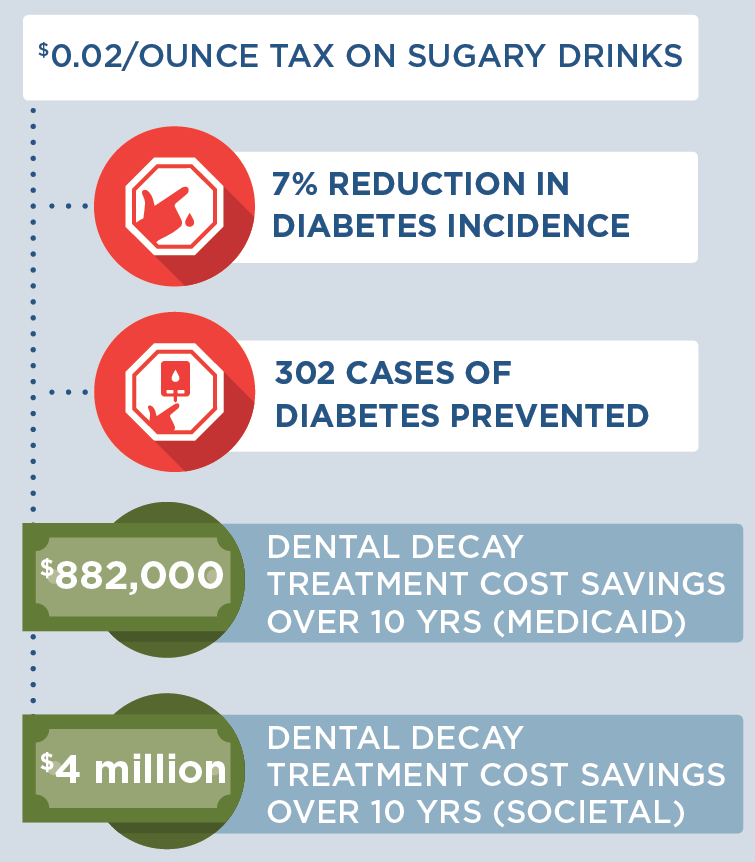
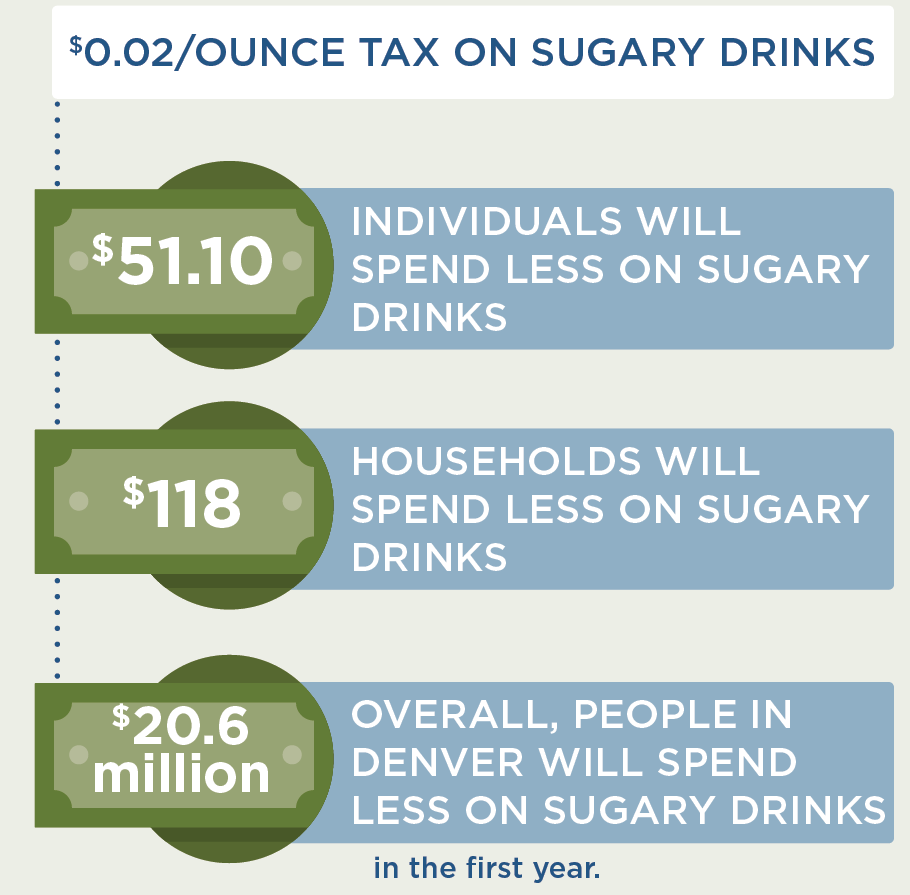
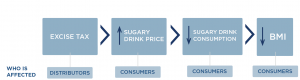
 Since the cost of a sugary drink excise tax is incorporated directly into the beverage’s sticker price, an excise tax will likely influence consumer purchasing decisions more than a comparable sales tax that is added onto the item at the register. We assume 100% pass-through of the tax over 10 years and assume the tax rate would be adjusted annually for inflation. Our pass-through rate estimate is supported by empirical studies of excise taxes in Mexico and France that demonstrate near-complete pass-through rates to consumers.23 Short term studies for the local tax in Berkeley, CA indicate imperfect (or less than 100%) pass-through.3,24,25 More recent analyses from Philadelphia, PA indicate that over all the sales studied, pass-through was close to complete. The pass-through seen in pharmacies was higher than in supermarkets and mass merchandise settings.26 The expected change in sugary drink price was estimated using an average of $0.06/ounce based on national sugary drink prices.27 The price per ounce in this study was based on a weighted average of sugary drink consumption across stores, restaurants, and other sources according to the estimates from the National Health and Nutrition Examination Survey (NHANES) 2009-2010. The price per ounce of sugary drinks purchased in stores was calculated using weighted averages of two-liter bottles, 12-can cases, and single-serve containers based on 2010 Nielsen Homescan data.27 For example, a $0.02/ounce tax would raise the price of a 12-ounce can of soda from $0.72 to $0.96/can post-tax.
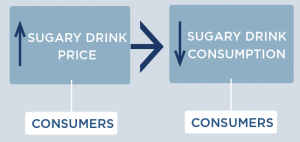 How does increasing the price of sugary drinks change individual sugary drink consumption?
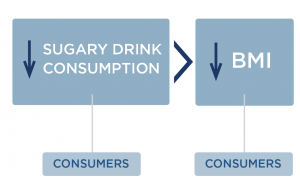
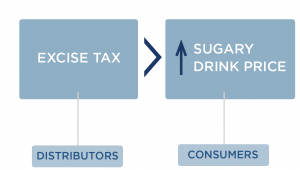


 Since the cost of a sugary drink excise tax is incorporated directly into the beverage’s sticker price, an excise tax will likely influence consumer purchasing decisions more than a comparable sales tax that is added onto the item at the register. We assume 100% pass-through of the tax over 10 years and assume the tax rate would be adjusted annually for inflation. Our pass-through rate estimate is supported by empirical studies of excise taxes in Mexico and France that demonstrate near-complete pass through rates to consumers.24 Short term studies for the local tax in Berkeley indicate imperfect, or less than 100%, pass-through.3,25,26 The expected change in sugary drink price was estimated using an average of $0.06/ounce based on national sugary drink prices.27 The price per ounce in this study was based on a weighted average of sugary drink consumption across stores, restaurants and other sources according to the estimates from the National Health and Nutrition Examination Survey (NHANES) 2009-2010. The price per ounce of sugary drinks purchased in stores was calculated using weighted averages of two-liter bottles, 12-can cases, and single-serve containers based on 2010 Nielsen Homescan data.27 For example, a $0.02/ounce tax would raise the price of a 12-ounce can of soda from $0.72 to $0.96/can post-tax.
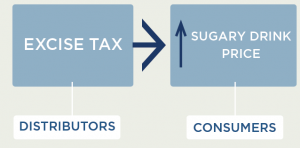
 How does an excise tax on distributors affect the price paid by consumers?