The information in this brief is intended for educational use only.
This brief provides a summary of the CHOICES Learning Collaborative Partnership simulation model of a $0.03-per-ounce state volume excise tax on sugary drinks. The tax, which would be administered by the state, aims to reduce consumption of sugary drinks.
The Issue
Although sugary drinks consumption has declined in recent years, adolescents and young adults in the United States consume more sugary drinks than the Dietary Guidelines for Americans, 2015-2020 recommend, with persistent racial/ethnic disparities.1-4 Research has linked sugary drink consumption to excess weight gain, diabetes, and heart disease. Sugary drink consumption may increase the risk of developing chronic diseases through effects on body weight and other mechanisms.5-6 The Dietary Guidelines for Americans, 2015-20207 recommend reducing sugary drink intake to support a healthy body weight. Drawing upon the success of tobacco taxation and decades of economic research, public health experts have studied taxes on unhealthy foods and beverages.8-11 In 2009, the Institute of Medicine recommended that local governments implement tax strategies to reduce consumption of “calorie-dense, nutrient-poor foods,” emphasizing sugary drinks as an appropriate target for taxation.12
About the Potential Impact of a Sugary Drink Excise Tax
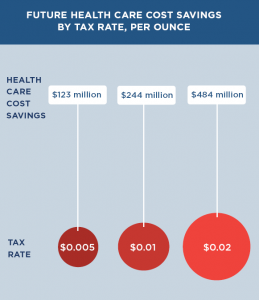
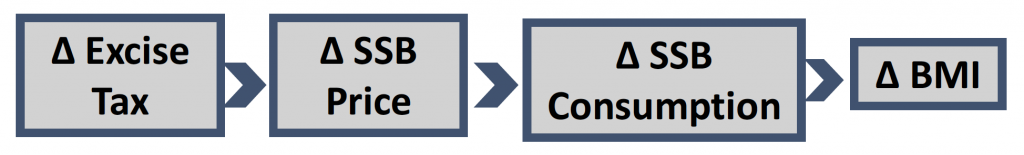
The modeled sugary drinks excise tax would apply at the wholesale level (that is, to local bottlers, distributors and/or manufacturers) and be passed on directly to consumers in full as part of the price of the product. The tax would apply to all beverages with added caloric sweeteners but not to 100 percent juices, milk products, or artificially sweetened beverages. The $0.03-per-ounce excise tax would increase sugary drink prices on average in Alaska by 36.5 percent. Implementation costs of the tax to state government would include a one-time capital cost to build the system to assess and collect the tax and annual administrative cost associated with assessing, processing and collecting tax statements. The implementation costs to the private sector include the cost for efforts from businesses to prepare tax payments and statements and the cost of time required for state audits using private tax accountants. The tax is projected to avoid $19.40 in obesity-related health care costs for every $1 it would cost to implement.
Comparing Costs and Outcomes
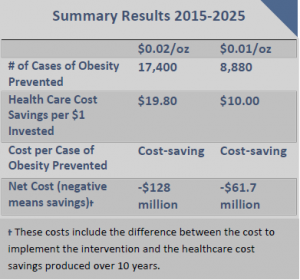
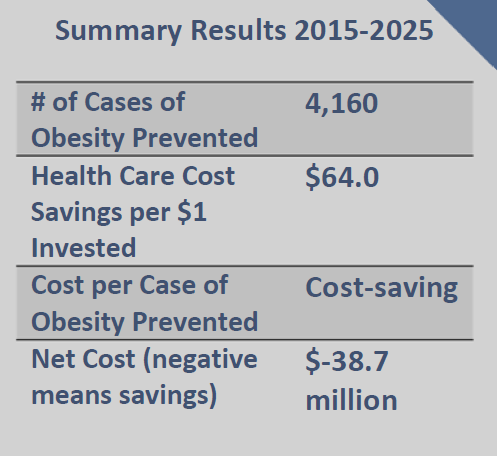
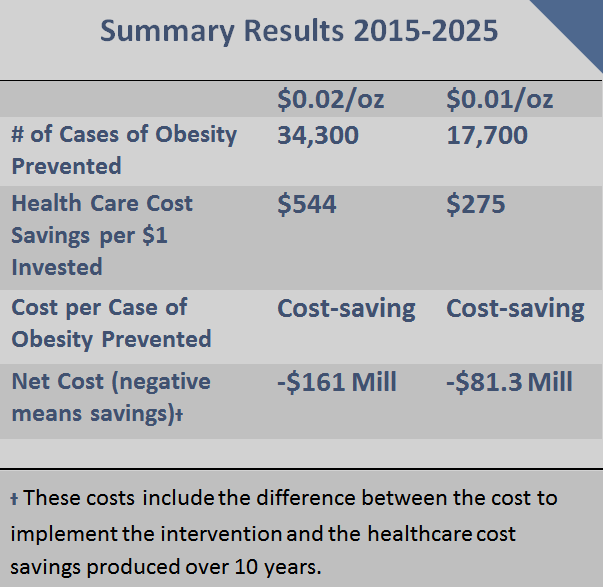
CHOICES cost-effectiveness analysis compared the costs and outcomes of the sugary drinks excise tax over 10 years with costs and outcomes associated with not implementing the tax.
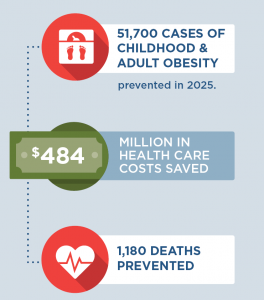
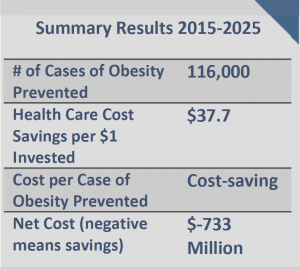
Implementing the $0.03/oz sugary drink excise tax in Alaska is an investment in the future. The tax would result in: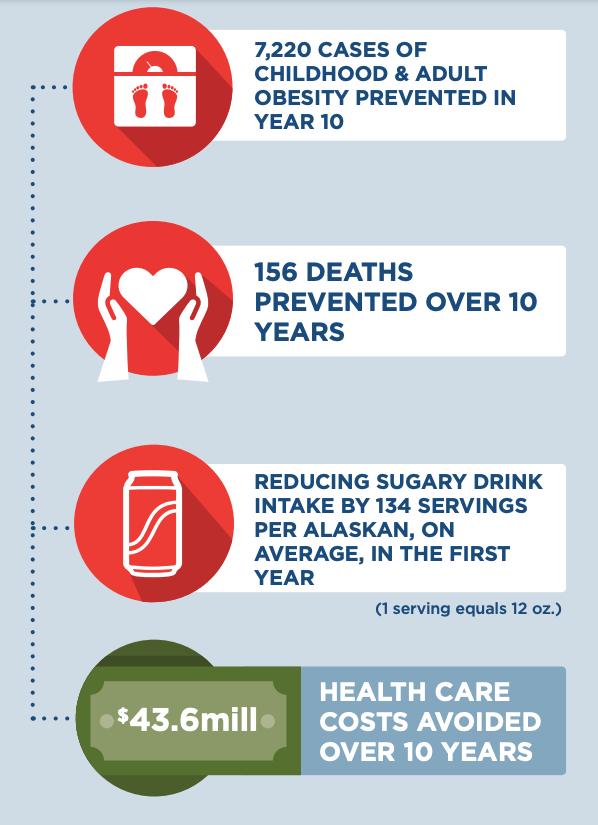 |
Conclusions and Implications
According to this model analysis, a $0.03-per-ounce tax on sugary drinks in Alaska would reach all residents of the state and prevent 1,110 cases of childhood obesity and 6,110 cases of adult obesity in year 10. The sugary drinks excise tax would also prevent 156 premature obesity-related deaths and $43.6 million in health care costs would be avoided over 10 years.
There are concerns about the impact of the tax on low-income households. This analysis indicates that households would spend less on sugary drinks after the tax takes effect, increasing disposable income for other purchases. On average, low-income households consume more sugary drinks than higher-income households. Low-income households will spend less on sugary drinks and consume fewer of these drinks after the tax takes effect, which would lead to greater health benefits. The same is true for certain racial and ethnic groups. Thus, racial/ethnic disparities in obesity outcomes should decline following implementation of the proposed tax. In addition, revenue from the sugary drink tax could be reinvested in low-income communities. Implementing the tax in Alaska could send a powerful message to reduce added sugar consumption.
References
- Wang YC, Bleich SN, Gortmaker SL. Increasing caloric contribution from sugar-sweetened beverages and 100% fruit juices among US children and adolescents, 1988–2004. Pediatrics. 2008;121(6):e1604-e1614.
- Nielsen SJ and Popkin BM. Changes in beverage intake between 1977 and 2001. Am J Prev Med. 2004; 27(3):205-210.
- Bleich, SN, Wang YC, Wang Y, Gortmaker, SL. Increasing consumption of sugar-sweetened beverages among US adults: 1988—1994 to 1999—2004. Am J Clin Nutr. 2008; 26883.
- Bleich, SN, Vercammen KA, Koma, JW, Li Z. Trends in beverage consumption among children and adults, 2003-2014. Obesity. 2017; doi: 10.1002/oby.22056.
- Malik VS, Pan A, Willett WC, Hu FB. Sugar-sweetened beverages and weight gain in children and adults: a systematic review and meta-analysis. Am J Clin Nutr. 2013;98(4):1084-1102.
- Chen L, Caballero B, Mitchel DC, Loria C, et al. Reducing consumption of sugar-sweetened beverages is associated with reduced blood pressure: A prospective study among United States adults. Circulation. 2010;121(22):2398-2406.
- U.S. Department of Health and Human Services and U.S. Department of Agriculture. 2015 – 2020 Dietary Guidelines for Americans. 8th Edition. December 2015. Available at http://health.gov/dietaryguidelines/2015/guidelines
- Chaloupka FJ, Powell LM, Chriqui JF. Sugar-sweetened beverage taxes and public health: A Research Brief. Minneapolis, MN: Robert Wood Johnson Foundation, Healthy Eating Research, 2009.
- Brownell KD, Farley T, Willett WV, et al. The public health and economic benefits of taxing sugar-sweetened beverages. New Engl J Med. 2009;361(16):1599-1605.
- Long MW, Gortmaker SL, Ward ZJ, Resch SC, Moodie ML, Sacks G, Swinburn BA, Carter RC, Claire Wang Y. Cost Effectiveness of a Sugar-Sweetened Beverage Excise Tax in the U.S. Am J Prev Med. 2015 Jul;49(1):112-23.
- Gortmaker SL, Wang YC, Long MW, Giles CM, Ward ZJ, Barrett JL, Kenney EL, Sonneville KR, Afzal AS, Resch SC, Cradock AL. Three Interventions That Reduce Childhood Obesity Are Projected To Save More Than They Cost To Implement. Health Aff (Millwood). 2015 Nov 1;34(11):1932-9.
- Institute of Medicine. Local Government Actions to Prevent Childhood Obesity, 2009. National Academies Press: Washington, DC.
Suggested Citation:Gortmaker S, Long M, Barrett J, Cradock A, Flax C, Giles C, Ward Z. Alaska Sugary Drink Tax: A State Excise Tax {Issue Brief}. The CHOICES Learning Collaborative Partnership at the Harvard T.H. Chan School of Public Health, Boston, MA; July, 2018. |
| The design for this brief and its graphics were developed by Molly Garrone, MA and partners at Burness.
This brief was developed through the Childhood Obesity Intervention Cost-Effectiveness Study (CHOICES) Learning Collaborative Partnership at the Harvard T.H. Chan School of Public Health. This brief is intended for educational use only. Funded by The JPB Foundation. Results are those of the authors and not the funders. |
 SSBs include all beverages with added caloric sweeteners. The modeled excise tax does not apply to 100% juice, milk products, or artificially-sweetened beverages. Although sugary drinks consumption has declined in recent years, adolescents and young adults in the United States consume more sugary drinks than the Dietary Guidelines for Americans recommends, with persistent racial/ethnic disparities.5-8 Randomized trials and longitudinal studies have linked SSB consumption to excess weight gain, diabetes, and cardiovascular disease. Consumption of SSBs increases the risk of chronic diseases through its impact on BMI and other mechanisms.9,10 The Dietary Guidelines for Americans, 201511 recommends that individuals reduce SSB intake in order to manage their body weight. Drawing on the success of tobacco taxation and decades of economic research, public health experts have called for higher taxes on SSBs and documented their likely impact.12-15 In 2009, the IOM recommended that local governments implement tax strategies to reduce consumption of “calorie-dense, nutrient-poor foods,” emphasizing SSBs as an apt target for taxation.16
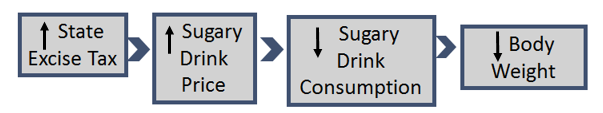


 Impact of Tax on Price to Consumers
 SSBs include all beverages with added caloric sweeteners. The modeled excise tax does not apply to 100% juice, milk products, or artificially-sweetened beverages. Although SSB consumption has declined in recent years, children and adults in the U.S. consume twice as many calories from SSBs compared to 30 years ago.5-7 Randomized trials and longitudinal studies have linked SSB consumption to excess weight gain, diabetes, and cardiovascular disease. Consumption of SSBs increases the risk of chronic diseases through its impact on BMI and other mechanisms.8,9 The Dietary Guidelines for Americans, 201510 recommends that individuals reduce SSB intake in order to manage their body weight. Drawing on the success of tobacco taxation and decades of economic research, public health experts have called for higher taxes on SSBs and documented their likely impact.11-14 In 2009, the IOM recommended that local governments implement tax strategies to reduce consumption of “calorie-dense, nutrient-poor foods,” emphasizing SSBs as an apt target for taxation.15
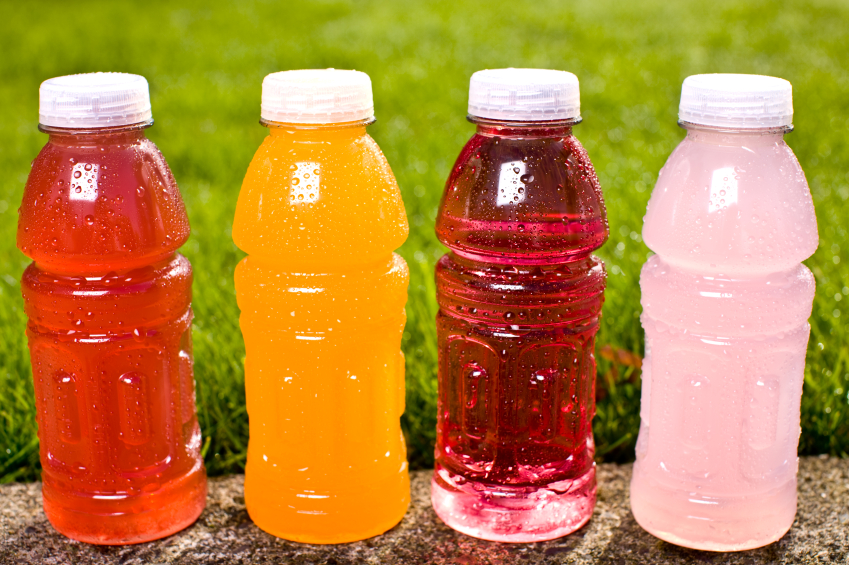
 SSBs include all beverages with added caloric sweeteners. The modeled excise tax does not apply to 100% juice, milk products, or artificially-sweetened beverages. Although SSB consumption has declined in recent years, children and adults in the U.S. consume twice as many calories from SSBs compared to 30 years ago.2-4 Randomized trials and longitudinal studies have linked SSB consumption to excess weight gain, diabetes, and cardiovascular disease. Consumption of SSBs increases the risk of chronic diseases through its impact on BMI and other mechanisms.5-6 The Dietary Guidelines for Americans, 20157 recommends that individuals reduce SSB intake in order to manage their body weight. Drawing on the success of tobacco taxation and decades of economic research, public health experts have called for higher taxes on SSBs and documented their likely impact.8-11 In 2009, the IOM recommended that local governments implement tax strategies to reduce consumption of “calorie-dense, nutrient-poor foods,” emphasizing SSBs as an apt target for taxation.12
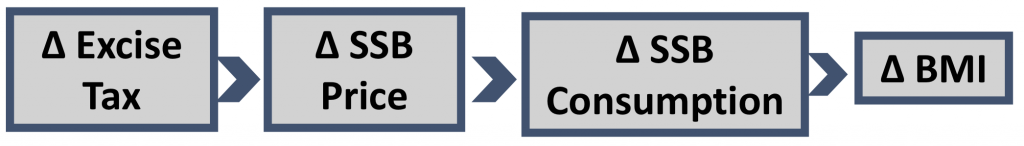 Impact of Tax on Price to Consumers