The information in this brief is intended to provide educational information on the cost-effectiveness of SSB taxes.
Intervention Strategy Description
Implementation of a city excise tax of $0.01/ounce of sugar-sweetened beverages (SSBs), administered by each city’s department of revenue and based on proposals considered by federal, state, and local governments.1-4
 Background
SSBs include all beverages with added caloric sweeteners. The modeled excise tax does not apply to 100% juice, milk products, or artificially-sweetened beverages. Although SSB consumption has declined in recent years, children and adults in the U.S. consume twice as many calories from SSBs compared to 30 years ago.5-7 Randomized trials and longitudinal studies have linked SSB consumption to excess weight gain, diabetes, and cardiovascular disease. Consumption of SSBs increases the risk of chronic diseases through its impact on BMI and other mechanisms.8,9 The Dietary Guidelines for Americans, 201510 recommends that individuals reduce SSB intake in order to manage their body weight. Drawing on the success of tobacco taxation and decades of economic research, public health experts have called for higher taxes on SSBs and documented their likely impact.11-14 In 2009, the IOM recommended that local governments implement tax strategies to reduce consumption of “calorie-dense, nutrient-poor foods,” emphasizing SSBs as an apt target for taxation.15
Modeling Framework
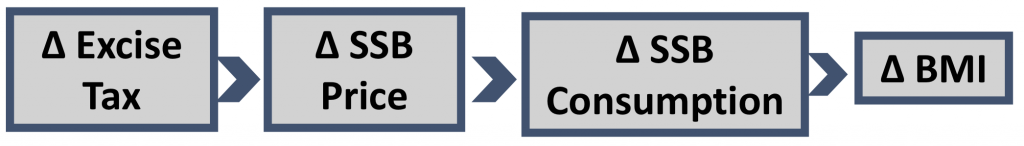
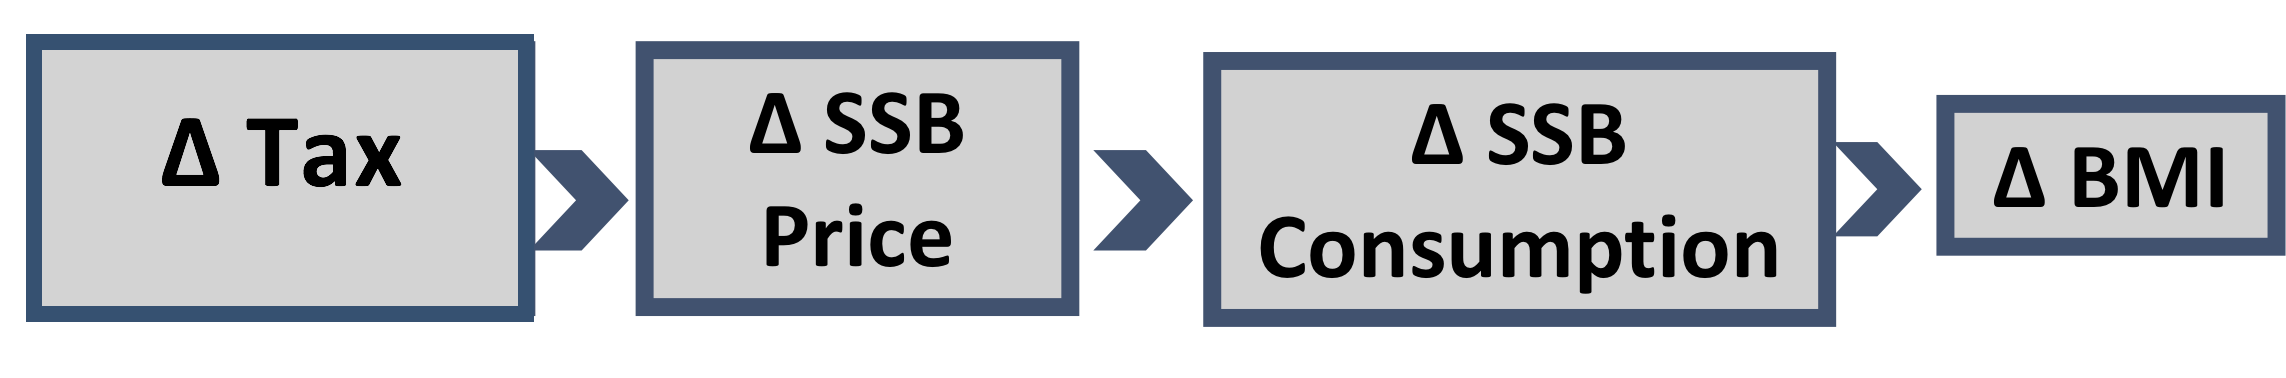
Municipal excise tax in large cities in the United States with the authority to implement such a tax linked to change in BMI through change in SSB price and consumption.
Impact of Tax on Price to Consumers
We assume 100% pass through of the tax over the ten years. Empirical studies of SSB excise taxes in Mexico and France indicate that approximately the full amount of the excise tax is passed on to consumers.16 Short term studies for the local tax in Berkeley indicate less than complete pass-through. 3,17,18 The expected percent increase in SSB price was estimated based on the average $0.059/ounce reported in a review of beverage demand elasticity (inflated to $0.0612 in 2014 dollars).19 The price per ounce in this study was based on a weighted average across stores, restaurants and other sources proportional to the source of consumed SSBs in NHANES 2009-2010. The price per ounce of SSBs purchased in stores was calculated using weighted averages of two-liter bottles, 12-can cases, and single-serve bottles or cans based on the distribution of package sizes estimated from 2010 Nielsen Homescan data. The $0.01/ounce increased excise tax results in a 16.3% price increase. We assumed that the tax rate would be adjusted annually for inflation to maintain the 16.3% price increase throughout the ten-year modeling time frame.
SSB Consumption and Price Elasticity of Demand
We used regionally-adjusted estimates of total SSB consumption in 2015 published in the UCONN Rudd Center Revenue Calculator for Sugar-Sweetened Beverage Taxes to adjust national age, sex, and race/ethnicity-specific consumption data from NHANES 2005-2010 to estimate current SSB consumption levels in each of the cities studied.20 Powell et al reviewed studies published 2007-2012 and estimated a mean own-price elasticity of demand for SSBs weighted by SSB category consumption shares of -1.21, ranging from -3.87 to -0.69. 21 Recent research concerning the Berkeley tax indicates a 21% reduction in SSB intake among low income populations.17
Direct effect of change in SSB consumption on change in BMI
We conducted evidence reviews for the impact of change in SSB intake on change in BMI, taking into account any dietary compensation.16 Four large longitudinal studies in adults22-25 of sufficient duration were identified. The relationship was modeled using a uniform distribution based on the range of the estimates of the effect of a one serving reduction on BMI (from 0.21 to 0.57). Among youth, a double-blind randomized controlled trial conducted over 18 months found that an additional 8 oz serving of SSBs led to a 1 kg greater weight gain. 26
Reach
The intervention reaches all youth and adults ages 2 years and older in each of the 15 cities studied.
Costs
The policy change will involve start up and ongoing labor costs for municipal tax department administrators. To implement the intervention, the municipal government will need to process tax statements and conduct audits. Businesses will also need to prepare tax statements and participate in audits, which will require labor from private tax accountants. Cost information was drawn from states with planned or implemented excise taxes on soft drinks.14 The cost and benefit estimates do not include expected tax revenue.
CHOICES Microsimulation Model
The CHOICES microsimulation model for each of these 15 cities was used to calculate the costs and effectiveness over ten years (2015–25). This is a stochastic, discrete-time, individual-level microsimulation model designed to simulate the experience of the city population from 2015 to 2025. Cases of obesity prevented were calculated at the end of the model in 2025. The model uses data from: US Census, American Community Survey, Behavioral Risk Factor Surveillance System, 27 NHANES, National Survey of Children’s Health, 28 the Medical Expenditure Panel Survey, and multiple longitudinal studies. We calculated uncertainty intervals using Monte Carlo simulations programmed in Java over one thousand iterations of the model for a population of simulated individuals representing each city’s population size.14
Impact on Diabetes
We estimated the impact of the tax-induced reduction in SSB intake on diabetes incidence for adults ages 18-79 years using a published meta-analysis of the relative risk of developing diabetes due to a one-serving change in SSB consumption 29 as well as local estimates of diabetes. On average, each 8.5 oz serving of SSBs per day increases the risk of diabetes by 18%. In the 15 cities studied, we estimated the $0.01/ounce SSB excise tax would lead to an average 6% reduction in diabetes incidence- an estimated average 325 cases of diabetes prevented- over a one-year period once the tax reaches its full effect; Seattle would have the lowest reduction in cases of diabetes prevented (97; 4% reduction in diabetes incidence), while Los Angeles would have the highest reduction in cases of diabetes prevented (779; 4% reduction in diabetes incidence).
Results
Estimates and 95% uncertainty intervals. (Click on city names to jump to full city-specific tables in the Appendix).
| City | Cost per Case of Obesity Prevented | QALYs Gained | Cases of Obesity Prevented* | Deaths Averted* | Annual Intervention Cost | Net Cost (negative means savings) | Health Care Cost Savings per $1 Invested |
| Baltimore | Cost-saving | 1,480(455; 4,034) | 4,950(1,540; 13,500) | 131(38; 357) | $102,900($66,400; $140,000) | -$31.6 mill(-$88.80mill; -$8.97mill) | $31.70($8.73; $95.80) |
| Charlotte | Cost-saving | 1,970(607; 5,330) | 7,140(2,260; 19,200) | 154(47; 426) | $114,000($74,900; $153,000) | -$33.60 mill(-$91.70mill; -$9.56 mill) | $30.60 ($8.42; $92.60) |
| Columbus | Cost-saving | 2,050(639; 5,450) | 7,690(2,420; 20,540) | 154(45; 418) | $126,000($82,200; $170,000) | -$46.3mill(-$125 mill;
-$13.50mill) |
$37.80($10.50; $113) |
| Denver | Cost-saving | 1,340(414; 3,600) | 5,120(1,620; 13,600) | 93(26; 257) | $99,600($64,500; $135,000) | -$35.3mill(-$95.5mill;
-$10.4mill) |
$36.40($10.30; $108) |
| Detroit | Cost-saving | 1,950(604; 5,230) | 7,200(2,260; 19,200) | 187(55; 484) | $118,000($76,000;
$160,000) |
-$33.6mill(-$95.4mill;
-$9.72) |
$29.50($8.19; $90) |
| Indianapolis | Cost-saving | 2,150(672; 5,810) | 7,710(2,430; 20,500) | 174(53; 476) | $121,000($80,010; $162,000) | -$43.3mill(-$120mill;
-$12.6mill) |
$36.80($10.40; $110) |
| Jacksonville | Cost-saving | 2,100(638; 5,600) | 7,300(2,300; 19,300) | 173(52; 471) | $117,000($78,000; $157,000) | -$39.6mill(-$109mill;
-$11.4mill) |
$34.84($9.67; $103) |
| Las Vegas | Cost-saving | 1,249(389; 3,374) | 4,678(1,499; 12,345) | 95(27; 269) | $91,428($59,732; $123,236) | -$23.14mill(-63.69mill;
-$6.53mill) |
$26.30($7.29; $79) |
| Los Angeles | Cost-saving | 5,730(1,760; 15,400) | 21,700(6,730; 58,600) | 374(102; 1,060) | $649,000($418,000; $ 882,000) | -$177mill(-$486mill;
-$50.1mill) |
$28.20($7.76; $85.10) |
| Louisville | Cost-saving | 2,180(1,003; 4,920) | 6,793(2,950; 15,700) | 181(64; 432) | $81,100($54,300; $108,000) | -$41.3mill(-$85.2mill; -$22.1mill) | $52.10($25.5; $119) |
| Oklahoma City | Cost-saving | 1,340(411; 3,610) | 4,590(1,410; 12,300) | 110(32; 299) | $84,000($55,900; $112,000) | -$20mill(-$55.10mill;
-$5.55mill) |
$24.80($6.91; $73.80) |
| Phoenix | Cost-saving | 3,370(1,030; 9,160) | 13,510(4,270; 35,900) | 221(64; 618) | $230,000($151,000; $309,000) | -$79.80mill(-$217mill;
-$22.70mill) |
$35.80($9.82; $106) |
| San Diego | Cost-saving | 1,900(581; 5,100) | 7,100(2,200; 19,100) | 126(34; 339) | $222,000($143,000; $302,000) | -$58.3mill (-$161mill;
-$16.4mill) |
$27.2($7.42; $82.90) |
| San Jose | Cost-saving | 1,370(415; 3,630) | 5,200(1,630; 13,900) | 93(25; 252) | $164,000($105,000; $222,000) | -$43.40mill(-$119mill;
-$12.40mill) |
$27.50($7.67; $83) |
| Seattle | Cost-saving | 1,290(479; 3010) | 3,990(1,460; 9,710) | 83(5; 231) | $61,500($61,500; $61,500) | -52.8 mill (-108 mill; -29.3 mill) | $86.9 ($48.7; $177) |
All metrics reported for the population over a 10-year period and discounted at 3% per year, unless otherwise noted.
*Not discounted.
Expected Yearly SSB Tax Revenue
According to the Rudd Center Revenue Calculator for Sugar Sweetened Beverage Taxes and calculations modeled off their calculator, 20 a $0.01/ounce excise tax in these 15 cities could raise a total of over $600 million in the first year of implementation.
| City | Estimated Yearly Tax Revenue |
| Baltimore | $25,600,000 |
| Charlotte | $38,900,000 |
| Columbus | $40,800,000 |
| Denver | $28,600,000 |
| Detroit | $33,500,000 |
| Indianapolis | $41,000,000 |
| Jacksonville | $38,900,000 |
| Las Vegas | $25,200,000 |
| Los Angeles | $115,000,000 |
| Louisville | $29,900,000 |
| Oklahoma City | $25,900,000 |
| Phoenix | $68,500,000 |
| San Diego | $39,900,000 |
| San Jose | $29,300,000 |
| Seattle | $19,000,000 |
Equity and Implementation Considerations
Concerns have been raised regarding the impact of the tax on households with low incomes. Because of the elasticity of -1.21, our analyses clearly indicate that households will spend less on SSBs after the tax goes into effect, providing disposable income for other purchases. In addition, we project that greater health benefits will accrue to low-income consumers who on average consume more SSBs than higher income consumers; the same is true for a number of racial and ethnic groups. Disparities in obesity outcomes should thus decrease following implementation of the proposed tax. In addition, revenue raised from an SSB tax can be reinvested in low income communities; for instance, in Berkeley, CA SSB tax revenue has been allocated for spending on school and community programs, several with a focus on low income or minority populations, to promote healthy eating, diabetes and obesity prevention.30,31
There is opposition from the beverage industry, which spends over $4 billion/year nationwide on marketing.32 Public support for such taxes generally increases with earmarking for prevention activities.33 Relatively small beverage excise taxes are currently applied across many states. The proposed tax is likely to be sustainable if implemented based on the history of tobacco excise taxes. There is potential for a shift in social norms of SSB consumption based on evidence from tobacco control tax and regulatory efforts.34
Discussion
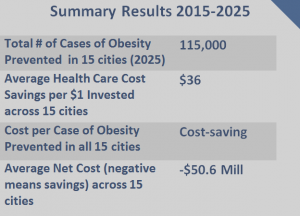
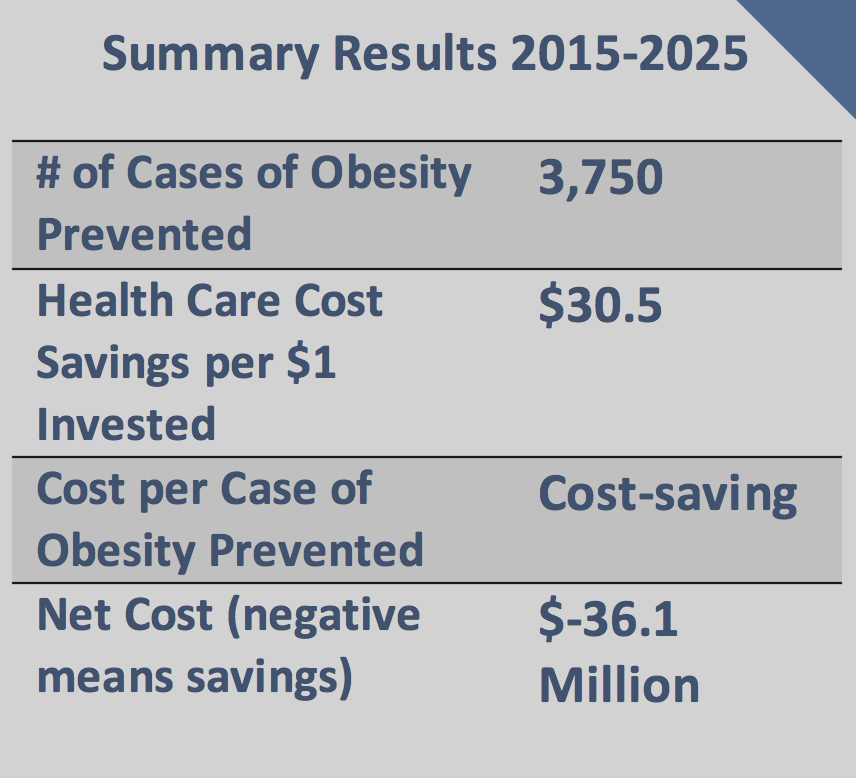
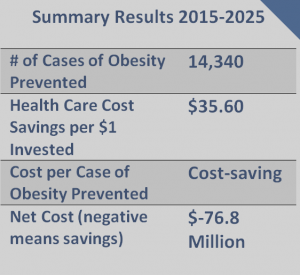
We project that municipal SSB excise taxes in these cities of $0.01/ounce will prevent 115,000 cases of childhood and adult obesity in 2025, prevent many new cases of diabetes, increase healthy life years and save more in future health care costs than the intervention costs to implement. Revenue from the tax can be used for education and health promotion efforts. Implementing the tax could also serve as a powerful social signal to reduce sugar consumption.
Results prepared by the CHOICES project at the Harvard T.H. Chan School of Public Health: Gortmaker SL, Long MW, Ward ZJ, Giles CM, Barrett JL, Resch SC, Tao H, Cradock AL. Funded by The JPB Foundation and Healthy Food America. Results are those of the authors and not the funders. For further information contact choicesproject@hsph.harvard.edu.
References
- American Public Health Association. Taxes on Sugar-Sweetened Beverages. 2012.
- Hakim D and Confessore N. Paterson seeks huge cuts and $1 billion in taxes and fees. The New York Times, Jan 19, 2010.
- Falbe J, Rojas N, Grummon AH, Madsen KA. Higher Retail Prices of Sugar-Sweetened Beverages 3 Months After Implementation of an Excise Tax in Berkeley, California. Am J Public Health. 2015 Nov;105(11):2194-201.
- Leonhardt D. The battle over taxing soda. The New York Times, May 19, 2010.
- Wang YC, Bleich SN, and Gortmaker SL. Increasing caloric contribution from sugar-sweetened beverages and 100% fruit juices among US children and adolescents, 1988–2004. Pediatrics. 2008;121(6):e1604-e1614.
- Bleich SN, Wang YC, Wang Y and Gortmaker SL. Increasing consumption of sugar-sweetened beverages among US adults: 1988–1994 to 1999—2004. Am J Clin Nutr. 2008;89(1):372-381.
- Kit BK, Fakhouri TH, Park S, Nielsen SJ, Ogden CL. Trends in sugar-sweetened beverage consumption among youth and adults in the United States: 1999-2010. Am J Clin Nutr. 2013 Jul;98(1):180-8.
- Malik VS, Pan A, Willett WC , Hu FB. Sugar-sweetened beverages and weight gain in children and adults: a systematic review and meta-analysis. Am J Clin Nutr. 2013;98(4):1084-1102.
- Chen L, Caballero B, Mitchell DC, et al. Reducing consumption of sugar-sweetened beverages is associated with reduced blood pressure a prospective study among United States adults. Circulation. 2010;121(22):2398-2406.
- S. Department of Health and Human Services and U.S. Department of Agriculture. 2015 – 2020 Dietary Guidelines for Americans. 8th Edition. December 2015. Available at http://health.gov/dietaryguidelines/2015/guidelines/.
- Chaloupka FJ, Powell LM, and Chriqui JF. Sugar-sweetened beverage taxes and public health: A Research Brief. Minneapolis, MN: Robert Wood Johnson Foundation, Healthy Eating Research, 2009.
- Brownell KD, Farley T, Willett WV, et al. The public health and economic benefits of taxing sugar-sweetened beverages. New Engl J Med. 2009;361(16):1599-1605.
- Long MW, Gortmaker SL, Ward ZJ, Resch SC, Moodie ML, Sacks G, Swinburn BA, Carter RC, Claire Wang Y. Cost Effectiveness of a Sugar-Sweetened Beverage Excise Tax in the U.S. Am J Prev Med. 2015 Jul;49(1):112-23.
- Gortmaker SL, Wang YC, Long MW, Giles CM, Ward ZJ, Barrett JL, Kenney EL, Sonneville KR, Afzal AS, Resch SC, Cradock AL. Three Interventions That Reduce Childhood Obesity Are Projected To Save More Than They Cost To Implement. Health Aff (Millwood). 2015 Nov 1;34(11):1932-9.
- Institute of Medicine. Local Government Actions to Prevent Childhood Obesity, 2009. National Academies Press: Washington, DC.
- Colchero MA, Salgado JC, Unar-Munguía M, Molina M, Ng S, Rivera-Dommarco JA. Changes in Prices After an Excise Tax to Sweetened Sugar Beverages Was Implemented in Mexico: Evidence from Urban Areas. PLoS ONE. 2015;10(12): e0144408.
- Falbe J, Thompson HR, Becker CM, Rojas N, McCulloch CE, Madsen KA. Impact of the Berkeley Excise Tax on Sugar-Sweetened Beverage Consumption. Am J Public Health. 2016 Aug 23:e1-e7.
- Ng SW, Silver L, Ryan-Ibarra S, Induni M, Hamma C, Poti J , Popkin B. Berkeley Evaluation of Soda Tax (BEST) Study Preliminary Findings. Presentation at the annual meeting of the American Public Health Association, Chicago, IL, November 2015.
- Powell LM, Isgor z, Rimkus L, Chaloupka FJ. Sugar-sweetened beverage prices: Estimates from a national sample of food outlets. Chicago, IL: Bridging the Gap Program, Health Policy Center, Institute for Health Research and Policy, University of Illinois at Chicago, 2014. Available at: http://www.bridgingthegapresearch.org/_asset/ww9rpz/btg_SSB_price_brief_FINAL_Jan_2014.pdf.
- UCONN Rudd Center. Revenue Calculator for Sugar-Sweetened Beverage Taxes. Jan 2014. Accessed March 2016, http://www.uconnruddcenter.org/revenue-calculator-for-sugar-sweetened-beverage-taxes.
- Powell LM, Chriqui JF, Khan T, Wada R, Chaloupka FJ. Assessing the potential effectiveness of food and beverage taxes and subsidies for improving public health: a systematic review of prices, demand and body weight outcomes. Obes Rev. 2013;14(2): p. 110-28.
- Chen L. Reduction in consumption of sugar-sweetened beverages is associated with weight loss: the PREMIER trial. Am J Clin Nutr. 2009;89(5):1299-306.
- Mozaffarian D, Hao T, Rimm ER, Willett WC, Hu FB. Changes in diet and lifestyle and long-term weight gain in women and men. N Engl J Med. 2011;364(25): p. 2392-404.
- Palmer JR, Boggs DA, Krishnan S, Hu FB, Singer M, Rosenberg L. Sugar-sweetened beverages and incidence of type 2 diabetes mellitus in African American women. Arch Intern Med. 2008;168(14): p. 1487-92.
- Schulze MB, Mason JE, Ludwig D, et al. Sugar-sweetened beverages, weight gain, and incidence of type 2 diabetes in young and middle-aged women. JAMA. 2004;292(8): p. 927-34.
- de Ruyter JC, Olthof MR, Seidell JC, Katan MB. A trial of sugar-free or sugar-sweetened beverages and body weight in Children. N Engl Med. 2012;367(15):1397-1406.
- Ward ZJ, Long MW, Resch SC, Gortmaker SL, Cradock AL, Giles C, Hsiao A, Wang YC. Redrawing the US Obesity Landscape: Bias-Corrected Estimates of State-Specific Adult Obesity Prevalence. PLoS One. 2016 Mar 8;11(3):e0150735.
- Long MW, Ward ZJ, Resch SC, Cradock AL, Wang YC, Giles CM, Gortmaker SL. State-level estimates of childhood obesity prevalence in the United States corrected for report bias. Int J Obes (Lond). 2016 Aug 30.
- Imamura F, O’Connor L, Ye Z, Mursu J, Hayashino Y, Bhupathiraju SN, Forouhi NG. Consumption of sugar sweetened beverages, artificially sweetened beverages, and fruit juice and incidence of type 2 diabetes. Br J Sports Med. 2016 Apr;50(8):496-504.
- Lynn J. (2016, Jan 20). City council votes to allocate ‘soda tax’ revenue to school district, city organizations. The Daily Californian. Retrieved from http://www.dailycal.org/2016/01/20/city-council-votes-allocate-soda-tax-revenue-school-district-city-organizations/.
- Berkeley City Council. (2016, June 14). Berkeley City Council meeting. [Annotated Agenda]. Retrieved from https://www.cityofberkeley.info/Clerk/City_Council/2016/06_June/City_Council__06-14-2016_-_Meeting_Info.aspx.
- Federal Trade Commission. Marketing Food to Children and Adolescents: A Review of Industry Expenditures, Activities, and Self-Regulation —A Report to Congress. Washington, DC: Federal Trade Commission, Bureau of Consumer Protection and Bureau of Economics, 2008. https://www.ftc.gov/sites/default/files/documents/reports/marketing-food-children-and-adolescents-review-industry-expenditures-activities-and-self-regulation/p064504foodmktingreport.pdf
- Friedman R. Public Opinion Data, 2013: New Haven, CT: Yale Rudd Center for Food Policy & Obesity.
- Frieden TR, Mostashari F, Kerker BD, Miller N, Hajat A, Frankel M. Adult tobacco use levels after intensive tobacco control measures: New York City, 2002-2003. Am J Public Health. 2005;95(6):1016-1023.
Appendix: City-specific results
Table 1: Baltimore, MD.
Estimates and 95% uncertainty intervals.
| Metric | Results |
| Cost/Effect | |
| Cost per Year with Obesity Prevented | Cost-saving |
| Cost per Quality Adjusted Life Year (QALY) Gained | Cost-saving |
| Cost per Case of Obesity Prevented | Cost-saving |
| QALYs Gained | 1,484(455; 4,034) |
| Reach | |
| First Year Population Reach* | 627,445 |
| Effect | |
| Decrease in 12 ounce Servings of SSBs per Person in the First Year* | 82.70(48.74; 172.43) |
| Cases of Obesity Prevented* | 4,950(1,538; 13,537) |
| Years with Obesity Prevented | 36,187(11,377; 96,214) |
| Life Years Gained | 449(124; 1,208) |
| Deaths Averted* | 131(38; 357) |
| Cost | |
| Annual Intervention Cost | $102,886($66,416; $139,501) |
| Net Cost (negative means savings) | -$31.6mill(-$88.8mill; -$8.97mill) |
| Health Care Cost Savings per $1 Invested | $31.7($8.73; $95.8) |
All metrics reported for the population over a 10-year period and discounted at 3% per year, unless otherwise noted.
*Not discounted.
Impact on Diabetes
We estimated the impact of the tax-induced reduction in SSB intake on diabetes incidence for adults ages 18-79 years using a published meta-analysis of the relative risk of developing diabetes due to a one-serving change in SSB consumption 29 as well as local estimates of diabetes. On average, each 8.5 oz serving of SSBs per day increases the risk of diabetes by 18%. In Baltimore, we estimated the $0.01/ounce SSB excise tax would lead to an 6% reduction in diabetes incidence- an estimated 303 cases of diabetes prevented- over a one-year period once the tax reaches its full effect.
Expected Yearly SSB Tax Revenue
According to the Rudd Center Revenue Calculator for Sugar Sweetened Beverage Taxes, 20, a $0.01/ounce excise tax in Baltimore could raise $25 million in the first year of implementation.
Table 2: Charlotte, NC.
Estimates and 95% uncertainty intervals.
| Metric | Results |
| Cost/Effect | |
| Cost per Year with Obesity Prevented | Cost-saving |
| Cost per Quality Adjusted Life Year (QALY) Gained | Cost-saving |
| Cost per Case of Obesity Prevented | Cost-saving |
| QALYs Gained | 1,967(607; 5,331) |
| Reach | |
| First Year Population Reach* | 755,674 |
| Effect | |
| Decrease in 12 ounce Servings of SSBs per Person in the First Year* | 94.7(55.8; 197) |
| Cases of Obesity Prevented* | 7,135(2,263; 19,210) |
| Years with Obesity Prevented | 51,453(16,237; 135,913) |
| Life Years Gained | 517(152; 1,446) |
| Deaths Averted* | 154(47; 426) |
| Cost | |
| Annual Intervention Cost | $113,765($74,855; $152,910) |
| Net Cost (negative means savings) | -$33.6mill(-$91.7mill; -$9.56mill) |
| Health Care Cost Savings per $1 Invested | $30.6($8.42; $92.6) |
All metrics reported for the population over a 10-year period and discounted at 3% per year, unless otherwise noted.
*Not discounted.
Impact on Diabetes
We estimated the impact of the tax-induced reduction in SSB intake on diabetes incidence for adults ages 18-79 years using a published meta-analysis of the relative risk of developing diabetes due to a one-serving change in SSB consumption 29 as well as local estimates of diabetes. On average, each 8.5 oz serving of SSBs per day increases the risk of diabetes by 18%. In Charlotte, we estimated the $0.01/ounce SSB excise tax would lead to an 8% reduction in diabetes incidence- an estimated 273 cases of diabetes prevented- over a one-year period once the tax reaches its full effect.
Expected Yearly SSB Tax Revenue
According to the Rudd Center Revenue Calculator for Sugar Sweetened Beverage Taxes, 20, a $0.01/ounce excise tax in Charlotte could raise $38 million in the first year of implementation.
Table 3: Columbus, OH.
Estimates and 95% uncertainty intervals.
| Metric | Results |
| Cost/Effect | |
| Cost per Year with Obesity Prevented | Cost-saving |
| Cost per Quality Adjusted Life Year (QALY) Gained | Cost-saving |
| Cost per Case of Obesity Prevented | Cost-saving |
| QALYs Gained | 2,051(639; 5,454) |
| Reach | |
| First Year Population Reach* | 811,882 |
| Effect | |
| Decrease in 12 ounce Servings of SSBs per Person in the First Year* | 98.3(57.9; 205) |
| Cases of Obesity Prevented* | 7,687(2,421; 20,540) |
| Years with Obesity Prevented | 54,249(17,237; 141,955) |
| Life Years Gained | 512(147; 1,384) |
| Deaths Averted* | 154(45; 418) |
| Cost | |
| Annual Intervention Cost | $125,798($82,227; $169,581) |
| Net Cost (negative means savings) | -$46.3mill(-$125.2mill; -$13.5mill) |
| Health Care Cost Savings per $1 Invested | $37.8($10.5; $112.9) |
All metrics reported for the population over a 10-year period and discounted at 3% per year, unless otherwise noted.
*Not discounted.
Impact on Diabetes
We estimated the impact of the tax-induced reduction in SSB intake on diabetes incidence for adults ages 18-79 years using a published meta-analysis of the relative risk of developing diabetes due to a one-serving change in SSB consumption 29 as well as local estimates of diabetes. On average, each 8.5 oz serving of SSBs per day increases the risk of diabetes by 18%. In Columbus, we estimated the $0.01/ounce SSB excise tax would lead to an 8% reduction in diabetes incidence- an estimated 396 cases of diabetes prevented- over a one-year period once the tax reaches its full effect.
Expected Yearly SSB Tax Revenue
According to the Rudd Center Revenue Calculator for Sugar Sweetened Beverage Taxes, 20, a $0.01/ounce excise tax in Columbus could raise $41 million in the first year of implementation.
Table 4: Denver, CO.
Estimates and 95% uncertainty intervals.
| Metric | Results |
| Cost/Effect | |
| Cost per Year with Obesity Prevented | Cost-saving |
| Cost per Quality Adjusted Life Year (QALY) Gained | Cost-saving |
| Cost per Case of Obesity Prevented | Cost-saving |
| QALYs Gained | 1,342(414; 3,603) |
| Reach | |
| First Year Population Reach* | 614,708 |
| Effect | |
| Decrease in 12 ounce Servings of SSBs per Person in the First Year* | 82.1(48.3; 171) |
| Cases of Obesity Prevented* | 5,123(1,616; 13,573) |
| Years with Obesity Prevented | 35,495(11,283; 93,903) |
| Life Years Gained | 304(78; 844) |
| Deaths Averted* | 93(26; 257) |
| Cost | |
| Annual Intervention Cost | $99,600($64,469; $134,796) |
| Net Cost (negative means savings) | -$35.3mill(-$95.5mill; -$10,4mill) |
| Health Care Cost Savings per $1 Invested | $36.4($10.3; $108) |
All metrics reported for the population over a 10-year period and discounted at 3% per year, unless otherwise noted.
*Not discounted.
Impact on Diabetes
We estimated the impact of the tax-induced reduction in SSB intake on diabetes incidence for adults ages 18-79 years using a published meta-analysis of the relative risk of developing diabetes due to a one-serving change in SSB consumption 29 as well as local estimates of diabetes. On average, each 8.5 oz serving of SSBs per day increases the risk of diabetes by 18%. In Denver, we estimated the $0.01/ounce SSB excise tax would lead to an 7% reduction in diabetes incidence- an estimated 169 cases of diabetes prevented- over a one-year period once the tax reaches its full effect.
Expected Yearly SSB Tax Revenue
According to the Rudd Center Revenue Calculator for Sugar Sweetened Beverage Taxes, 20, a $0.01/ounce excise tax in Denver could raise $29 million in the first year of implementation.
Table 5: Detroit, MI.
Estimates and 95% uncertainty intervals.
| Metric | Results |
| Cost/Effect | |
| Cost per Year with Obesity Prevented | Cost-saving |
| Cost per Quality Adjusted Life Year (QALY) Gained | Cost-saving |
| Cost per Case of Obesity Prevented | Cost-saving |
| QALYs Gained | 1,945(604; 5,228) |
| Reach | |
| First Year Population Reach* | 721,507 |
| Effect | |
| Decrease in 12 ounce Servings of SSBs per Person in the First Year* | 98.9(58.3; 206) |
| Cases of Obesity Prevented* | 7,203(2,262; 19,153) |
| Years with Obesity Prevented | 50,618(16,369; 133,196) |
| Life Years Gained | 656(192; 1,707) |
| Deaths Averted* | 187(55; 484) |
| Cost | |
| Annual Intervention Cost | $117,715($75,966; $ 159,488) |
| Net Cost (negative means savings) | -$33.6mill(-$95.4mill; -$9.72) |
| Health Care Cost Savings per $1 Invested | $29.5($8.19; $89.5) |
All metrics reported for the population over a 10-year period and discounted at 3% per year, unless otherwise noted.
*Not discounted.
Impact on Diabetes
We estimated the impact of the tax-induced reduction in SSB intake on diabetes incidence for adults ages 18-79 years using a published meta-analysis of the relative risk of developing diabetes due to a one-serving change in SSB consumption 29 as well as local estimates of diabetes. On average, each 8.5 oz serving of SSBs per day increases the risk of diabetes by 18%. In Detroit, we estimated the $0.01/ounce SSB excise tax would lead to an 7% reduction in diabetes incidence- an estimated 350 cases of diabetes prevented- over a one-year period once the tax reaches its full effect.
Expected Yearly SSB Tax Revenue
According to the Rudd Center Revenue Calculator for Sugar Sweetened Beverage Taxes, 20, a $0.01/ounce excise tax in Detroit could raise $34 million in the first year of implementation.
Table 6: Indianapolis, IN.
Estimates and 95% uncertainty intervals.
| Metric | Results |
| Cost/Effect | |
| Cost per Year with Obesity Prevented | Cost-saving |
| Cost per Quality Adjusted Life Year (QALY) Gained | Cost-saving |
| Cost per Case of Obesity Prevented | Cost-saving |
| QALYs Gained | 2,153(672; 5,807) |
| Reach | |
| First Year Population Reach* | 837,391 |
| Effect | |
| Decrease in 12 ounce Servings of SSBs per Person in the First Year* | 96.9(57.2; 202) |
| Cases of Obesity Prevented* | 7,707(2,432; 20,473) |
| Years with Obesity Prevented | 55,284(17,644; 145,318) |
| Life Years Gained | 595(178; 1,621) |
| Deaths Averted* | 174(53; 476) |
| Cost | |
| Annual Intervention Cost | $120,940($80,010; $161,889) |
| Net Cost (negative means savings) | -$43.3mill(-$120mill; -$12.6mill) |
| Health Care Cost Savings per $1 Invested | $36.8($10.4; $110) |
All metrics reported for the population over a 10-year period and discounted at 3% per year, unless otherwise noted.
*Not discounted.
Impact on Diabetes
We estimated the impact of the tax-induced reduction in SSB intake on diabetes incidence for adults ages 18-79 years using a published meta-analysis of the relative risk of developing diabetes due to a one-serving change in SSB consumption 29 as well as local estimates of diabetes. On average, each 8.5 oz serving of SSBs per day increases the risk of diabetes by 18%. In Indianapolis, we estimated the $0.01/ounce SSB excise tax would lead to an 8% reduction in diabetes incidence- an estimated 393 cases of diabetes prevented- over a one-year period once the tax reaches its full effect.
Expected Yearly SSB Tax Revenue
According to the Rudd Center Revenue Calculator for Sugar Sweetened Beverage Taxes, 20, a $0.01/ounce excise tax in Indianapolis could raise $41 million in the first year of implementation.
Table 7: Jacksonville, FL.
Estimates and 95% uncertainty intervals.
| Metric | Results |
| Cost/Effect | |
| Cost per Year with Obesity Prevented | Cost-saving |
| Cost per Quality Adjusted Life Year (QALY) Gained | Cost-saving |
| Cost per Case of Obesity Prevented | Cost-saving |
| QALYs Gained | 2,096(638; 5,596) |
| Reach | |
| First Year Population Reach* | 834,543 |
| Effect | |
| Decrease in 12 ounce Servings of SSBs per Person in the First Year* | 91.7(54.0; 191) |
| Cases of Obesity Prevented* | 7,302(2,304; 19,256) |
| Years with Obesity Prevented | 52,088(16,592; 137,861) |
| Life Years Gained | 593(177; 1,583) |
| Deaths Averted* | 173(52; 471) |
| Cost | |
| Annual Intervention Cost | $117,081($77,928; $156,450) |
| Net Cost (negative means savings) | -$39.6mill(-$109mill; -$11.4mill) |
| Health Care Cost Savings per $1 Invested | $34.8($9.67; $103) |
All metrics reported for the population over a 10-year period and discounted at 3% per year, unless otherwise noted.
*Not discounted.
Impact on Diabetes
We estimated the impact of the tax-induced reduction in SSB intake on diabetes incidence for adults ages 18-79 years using a published meta-analysis of the relative risk of developing diabetes due to a one-serving change in SSB consumption 29 as well as local estimates of diabetes. On average, each 8.5 oz serving of SSBs per day increases the risk of diabetes by 18%. In Jacksonville, we estimated the $0.01/ounce SSB excise tax would lead to an 7% reduction in diabetes incidence- an estimated 394 cases of diabetes prevented- over a one-year period once the tax reaches its full effect.
Expected Yearly SSB Tax Revenue
According to the Rudd Center Revenue Calculator for Sugar Sweetened Beverage Taxes, 20, a $0.01/ounce excise tax in Jacksonville could raise $39 million in the first year of implementation.
Table 8: Las Vegas, NV.
Estimates and 95% uncertainty intervals.
| Metric | Results |
| Cost/Effect | |
| Cost per Year with Obesity Prevented | Cost-saving |
| Cost per Quality Adjusted Life Year (QALY) Gained | Cost-saving |
| Cost per Case of Obesity Prevented | Cost-saving |
| QALYs Gained | 1,249(389; 3,374) |
| Reach | |
| First Year Population Reach* | 594,712 |
| Effect | |
| Decrease in 12 ounce Servings of SSBs per Person in the First Year* | 79.3(46.7; 165) |
| Cases of Obesity Prevented* | 4,678(1,499; 12,345) |
| Years with Obesity Prevented | 32,400(10,331; 86,077) |
| Life Years Gained | 325(87; 922) |
| Deaths Averted* | 95(27; 269) |
| Cost | |
| Annual Intervention Cost | $91,428($59,732; $123,236) |
| Net Cost (negative means savings) | -$23.1mill(-63.7mill; -$6.53mill) |
| Health Care Cost Savings per $1 Invested | $26.3($7.29; $79.0) |
All metrics reported for the population over a 10-year period and discounted at 3% per year, unless otherwise noted.
*Not discounted.
Impact on Diabetes
We estimated the impact of the tax-induced reduction in SSB intake on diabetes incidence for adults ages 18-79 years using a published meta-analysis of the relative risk of developing diabetes due to a one-serving change in SSB consumption 29 as well as local estimates of diabetes. On average, each 8.5 oz serving of SSBs per day increases the risk of diabetes by 18%. In Las Vegas, we estimated the $0.01/ounce SSB excise tax would lead to an 6% reduction in diabetes incidence- an estimated 170 cases of diabetes prevented- over a one-year period once the tax reaches its full effect.
Expected Yearly SSB Tax Revenue
According to the Rudd Center Revenue Calculator for Sugar Sweetened Beverage Taxes and calculations modeled off their calculator, 20, a $0.01/ounce excise tax in Las Vegas could raise $25 million in the first year of implementation.
Table 9: Los Angeles, CA.
Estimates and 95% uncertainty intervals.
| Metric | Results |
| Cost/Effect | |
| Cost per Year with Obesity Prevented | Cost-saving |
| Cost per Quality Adjusted Life Year (QALY) Gained | Cost-saving |
| Cost per Case of Obesity Prevented | Cost-saving |
| QALYs Gained | 5,731(1,764; 15,401) |
| Reach | |
| First Year Population Reach* | 3,869,243 |
| Effect | |
| Decrease in 12 ounce Servings of SSBs per Person in the First Year* | 55.5(32.6; 116) |
| Cases of Obesity Prevented* | 21,665(6,725; 58,575) |
| Years with Obesity Prevented | 150,968(47,543; 404,126) |
| Life Years Gained | 1,249(324; 3,456) |
| Deaths Averted* | 374(102; 1,058) |
| Cost | |
| Annual Intervention Cost | $649,301($417,761; $ 881,460) |
| Net Cost (negative means savings) | -$177mill(-$486mill; -$50.1mill) |
| Health Care Cost Savings per $1 Invested | $28.2($7.76; $85.1) |
All metrics reported for the population over a 10-year period and discounted at 3% per year, unless otherwise noted.
*Not discounted.
Impact on Diabetes
We estimated the impact of the tax-induced reduction in SSB intake on diabetes incidence for adults ages 18-79 years using a published meta-analysis of the relative risk of developing diabetes due to a one-serving change in SSB consumption 29 as well as local estimates of diabetes. On average, each 8.5 oz serving of SSBs per day increases the risk of diabetes by 18%. In Los Angeles, we estimated the $0.01/ounce SSB excise tax would lead to an 4% reduction in diabetes incidence- an estimated 779 cases of diabetes prevented- over a one-year period once the tax reaches its full effect.
Expected Yearly SSB Tax Revenue
According to the Rudd Center Revenue Calculator for Sugar Sweetened Beverage Taxes, 20, a $0.01/ounce excise tax in Los Angles could raise $115 million in the first year of implementation.
Table 10: Louisville, KY.
Estimates and 95% uncertainty intervals.
| Metric | Results |
| Cost/Effect | |
| Cost per Year with Obesity Prevented | Cost-saving |
| Cost per Quality Adjusted Life Year (QALY) Gained | Cost-saving |
| Cost per Case of Obesity Prevented | Cost-saving |
| QALYs Gained | 2,180(1,003; 4,922) |
| Reach | |
| First Year Population Reach* | 600,188 |
| Effect | |
| Decrease in 12 ounce Servings of SSBs per Person in the First Year* | 98.5(58.0; 205) |
| Cases of Obesity Prevented* | 6,793(2,951; 15,721) |
| Years with Obesity Prevented | 47,857(21,194; 110,094) |
| Life Years Gained | 607(173; 1,480) |
| Deaths Averted* | 181(64; 432) |
| Cost | |
| Annual Intervention Cost | $81,148($54,284; $108,065) |
| Net Cost (negative means savings) | -$41.3mill(-$85.2mill; -$22.1mill) |
| Health Care Cost Savings per $1 Invested | $51.95($25.47; $119.48) |
All metrics reported for the population over a 10-year period and discounted at 3% per year, unless otherwise noted.
*Not discounted.
Impact on Diabetes
We estimated the impact of the tax-induced reduction in SSB intake on diabetes incidence for adults ages 18-79 years using a published meta-analysis of the relative risk of developing diabetes due to a one-serving change in SSB consumption 29 as well as local estimates of diabetes. On average, each 8.5 oz serving of SSBs per day increases the risk of diabetes by 18%. In Louisville, we estimated the $0.01/ounce SSB excise tax would lead to a 9% reduction in diabetes incidence- an estimated 448 cases of diabetes prevented- over a one-year period once the tax reaches its full effect.
Expected Yearly SSB Tax Revenue
According to the Rudd Center Revenue Calculator for Sugar Sweetened Beverage Taxes, 20, a $0.01/ounce excise tax in Louisville could raise $30 million in the first year of implementation.
Table 11: Oklahoma City, OK.
Estimates and 95% uncertainty intervals.
| Metric | Results |
| Cost/Effect | |
| Cost per Year with Obesity Prevented | Cost-saving |
| Cost per Quality Adjusted Life Year (QALY) Gained | Cost-saving |
| Cost per Case of Obesity Prevented | Cost-saving |
| QALYs Gained | 1,339(411; 3,607) |
| Reach | |
| First Year Population Reach* | 593,385 |
| Effect | |
| Decrease in 12 ounce Servings of SSBs per Person in the First Year* | 83.3(49.0; 174) |
| Cases of Obesity Prevented* | 4,585(1,407; 12,326) |
| Years with Obesity Prevented | 33,543(10,585; 88,891) |
| Life Years Gained | 377(104; 1,022) |
| Deaths Averted* | 110(32; 299) |
| Cost | |
| Annual Intervention Cost | $83,973($55,865; $112,176) |
| Net Cost (negative means savings) | -$20.0mill(-$55.1mill; -$5.55mill) |
| Health Care Cost Savings per $1 Invested | $24.8($6.91; $73.8) |
All metrics reported for the population over a 10-year period and discounted at 3% per year, unless otherwise noted.
*Not discounted.
Impact on Diabetes
We estimated the impact of the tax-induced reduction in SSB intake on diabetes incidence for adults ages 18-79 years using a published meta-analysis of the relative risk of developing diabetes due to a one-serving change in SSB consumption 29 as well as local estimates of diabetes. On average, each 8.5 oz serving of SSBs per day increases the risk of diabetes by 18%. In Oklahoma City, we estimated the $0.01/ounce SSB excise tax would lead to an 6% reduction in diabetes incidence- an estimated 197 cases of diabetes prevented- over a one-year period once the tax reaches its full effect.
Expected Yearly SSB Tax Revenue
According to the Rudd Center Revenue Calculator for Sugar Sweetened Beverage Taxes and calculations modeled off their calculator, 20, a $0.01/ounce excise tax in Oklahoma City could raise $26 million in the first year of implementation.
Table 12: Phoenix, AZ.
Estimates and 95% uncertainty intervals.
| Metric | Results |
| Cost/Effect | |
| Cost per Year with Obesity Prevented | Cost-saving |
| Cost per Quality Adjusted Life Year (QALY) Gained | Cost-saving |
| Cost per Case of Obesity Prevented | Cost-saving |
| QALYs Gained | 3,369(1,029; 9,164) |
| Reach | |
| First Year Population Reach* | 1,498,089 |
| Effect | |
| Decrease in 12 ounce Servings of SSBs per Person in the First Year* | 86.3(50.8; 180) |
| Cases of Obesity Prevented* | 13,507(4,271; 35,875) |
| Years with Obesity Prevented | 96,158(30,750; 252,707) |
| Life Years Gained | 732(211; 2,038) |
| Deaths Averted* | 221(64; 618) |
| Cost | |
| Annual Intervention Cost | $229,492($150,482; $308,753) |
| Net Cost (negative means savings) | -$79.8mill(-$216mill; -$22.7mill) |
| Health Care Cost Savings per $1 Invested | $35.8($9.82; $106) |
All metrics reported for the population over a 10-year period and discounted at 3% per year, unless otherwise noted.
*Not discounted.
Impact on Diabetes
We estimated the impact of the tax-induced reduction in SSB intake on diabetes incidence for adults ages 18-79 years using a published meta-analysis of the relative risk of developing diabetes due to a one-serving change in SSB consumption 29 as well as local estimates of diabetes. On average, each 8.5 oz serving of SSBs per day increases the risk of diabetes by 18%. In Phoenix, we estimated the $0.01/ounce SSB excise tax would lead to an 7% reduction in diabetes incidence- an estimated 496 cases of diabetes prevented- over a one-year period once the tax reaches its full effect.
Expected Yearly SSB Tax Revenue
According to the Rudd Center Revenue Calculator for Sugar Sweetened Beverage Taxes, 20, a $0.01/ounce excise tax in Phoenix could raise $69 million in the first year of implementation.
Table 13: San Diego, CA.
Estimates and 95% uncertainty intervals.
| Metric | Results |
| Cost/Effect | |
| Cost per Year with Obesity Prevented | Cost-saving |
| Cost per Quality Adjusted Life Year (QALY) Gained | Cost-saving |
| Cost per Case of Obesity Prevented | Cost-saving |
| QALYs Gained | 1,904(581; 5,097) |
| Reach | |
| First Year Population Reach* | 1,329,060 |
| Effect | |
| Decrease in 12 ounce Servings of SSBs per Person in the First Year* | 54.7(32.2; 114) |
| Cases of Obesity Prevented* | 7,095(2,196; 19,098) |
| Years with Obesity Prevented | 49,511(15,384; 132,470) |
| Life Years Gained | 419(115; 1,122) |
| Deaths Averted* | 126(34; 339) |
| Cost | |
| Annual Intervention Cost | $222,372($143,011; $301,814) |
| Net Cost (negative means savings) | -$58.3mill (-$161; -$16.4 mill) |
| Health Care Cost Savings per $1 Invested | $27.2($7.42; $82.9) |
All metrics reported for the population over a 10-year period and discounted at 3% per year, unless otherwise noted.
*Not discounted.
Impact on Diabetes
We estimated the impact of the tax-induced reduction in SSB intake on diabetes incidence for adults ages 18-79 years using a published meta-analysis of the relative risk of developing diabetes due to a one-serving change in SSB consumption 29 as well as local estimates of diabetes. On average, each 8.5 oz serving of SSBs per day increases the risk of diabetes by 18%. In San Diego, we estimated the $0.01/ounce SSB excise tax would lead to an 4% reduction in diabetes incidence- an estimated 241 cases of diabetes prevented- over a one-year period once the tax reaches its full effect.
Expected Yearly SSB Tax Revenue
According to the Rudd Center Revenue Calculator for Sugar Sweetened Beverage Taxes, 20, a $0.01/ounce excise tax in San Diego could raise $40 million in the first year of implementation.
Table 14: San Jose, CA.
Estimates and 95% uncertainty intervals.
| Metric | Results |
| Cost/Effect | |
| Cost per Year with Obesity Prevented | Cost-saving |
| Cost per Quality Adjusted Life Year (QALY) Gained | Cost-saving |
| Cost per Case of Obesity Prevented | Cost-saving |
| QALYs Gained | 1,367(415; 3,633) |
| Reach | |
| First Year Population Reach* | 971,402 |
| Effect | |
| Decrease in 12 ounce Servings of SSBs per Person in the First Year* | 54.9(32.4; 114) |
| Cases of Obesity Prevented* | 5,199(1,629; 13,917) |
| Years with Obesity Prevented | 36,097(11,515; 96,052) |
| Life Years Gained | 308(76; 815) |
| Deaths Averted* | 93(25; 252) |
| Cost | |
| Annual Intervention Cost | $163,852($105,440; $222,321) |
| Net Cost (negative means savings) | -$43.4mill(-$119mill; -$12.4mill) |
| Health Care Cost Savings per $1 Invested | $27.5($7.67; $83.0) |
All metrics reported for the population over a 10-year period and discounted at 3% per year, unless otherwise noted.
*Not discounted.
Impact on Diabetes
We estimated the impact of the tax-induced reduction in SSB intake on diabetes incidence for adults ages 18-79 years using a published meta-analysis of the relative risk of developing diabetes due to a one-serving change in SSB consumption 29 as well as local estimates of diabetes. On average, each 8.5 oz serving of SSBs per day increases the risk of diabetes by 18%. In San Jose, we estimated the $0.01/ounce SSB excise tax would lead to an 4% reduction in diabetes incidence- an estimated 164 cases of diabetes prevented- over a one-year period once the tax reaches its full effect.
Expected Yearly SSB Tax Revenue
According to the Rudd Center Revenue Calculator for Sugar Sweetened Beverage Taxes, 20, a $0.01/ounce excise tax in San Jose could raise $29 million in the first year of implementation.
Table 15: Seattle, WA.
Estimates and 95% uncertainty intervals.
| Metric | Results |
| Cost/Effect | |
| Cost per Year with Obesity Prevented | Cost-saving |
| Cost per Quality Adjusted Life Year (QALY) Gained | Cost-saving |
| Cost per Case of Obesity Prevented | Cost-saving |
| QALYs Gained | 1,290(479; 3010) |
| Reach | |
| First Year Population Reach* | 612,000 |
| Effect | |
| Decrease in 12 ounce Servings of SSBs per Person in the First Year* | 56.8(32.1; 125) |
| Cases of Obesity Prevented* | 3,990(1,460; 9,710) |
| Years with Obesity Prevented | 27,400(11,100; 66,800) |
| Life Years Gained | 278(-77; 774) |
| Deaths Averted* | 83(5; 231) |
| Cost | |
| Annual Intervention Cost | $61,500($61,500; $61,500) |
| Net Cost (negative means savings) | -$52.8 mill (-$108 mill; -$29.3 mill) |
| Health Care Cost Savings per $1 Invested | $86.9 ($48.7; $177) |
All metrics reported for the population over a 10-year period and discounted at 3% per year, unless otherwise noted.
*Not discounted.
Impact on Diabetes
We estimated the impact of the tax-induced reduction in SSB intake on diabetes incidence for adults ages 18-79 years using a published meta-analysis of the relative risk of developing diabetes due to a one-serving change in SSB consumption 29 as well as local estimates of diabetes. On average, each 8.5 oz serving of SSBs per day increases the risk of diabetes by 18%. In Seattle, we estimated the $0.01/ounce SSB excise tax would lead to a 4% reduction in diabetes incidence- an estimated 97 cases of diabetes prevented- over a one-year period once the tax reaches its full effect.
Expected Yearly SSB Tax Revenue
According to the Rudd Center Revenue Calculator for Sugar Sweetened Beverage Taxes, 20, a $0.01/ounce excise tax in Seattle could raise $19 million in the first year of implementation.
 SSBs include all beverages with added caloric sweeteners. The modeled excise tax does not apply to 100% juice, milk products, or artificially-sweetened beverages. Although SSB consumption has declined in recent years, children and adults in the U.S. consume twice as many calories from SSBs compared to 30 years ago.5-7 Randomized trials and longitudinal studies have linked SSB consumption to excess weight gain, diabetes, and cardiovascular disease. Consumption of SSBs increases the risk of chronic diseases through its impact on BMI and other mechanisms.8,9 The Dietary Guidelines for Americans, 201510 recommends that individuals reduce SSB intake in order to manage their body weight. Drawing on the success of tobacco taxation and decades of economic research, public health experts have called for higher taxes on SSBs and documented their likely impact.11-14 In 2009, the IOM recommended that local governments implement tax strategies to reduce consumption of “calorie-dense, nutrient-poor foods,” emphasizing SSBs as an apt target for taxation.15
 SSBs include all beverages with added caloric sweeteners. The modeled excise tax does not apply to 100% juice, milk products, or artificially-sweetened beverages. Although SSB consumption has declined in recent years, children and adults in the U.S. consume twice as many calories from SSBs compared to 30 years ago.5-7 Randomized trials and longitudinal studies have linked SSB consumption to excess weight gain, diabetes, and cardiovascular disease. Consumption of SSBs increases the risk of chronic diseases through its impact on BMI and other mechanisms.8,9 The Dietary Guidelines for Americans, 201510 recommends that individuals reduce SSB intake in order to manage their body weight. Drawing on the success of tobacco taxation and decades of economic research, public health experts have called for higher taxes on SSBs and documented their likely impact.11-14 In 2009, the IOM recommended that local governments implement tax strategies to reduce consumption of “calorie-dense, nutrient-poor foods,” emphasizing SSBs as an apt target for taxation.15
 SSBs include all beverages with added caloric sweeteners. The modeled excise tax does not apply to 100% juice, milk products, or artificially-sweetened beverages. Although SSB consumption has declined in recent years, children and adults in the U.S. consume twice as many calories from SSBs compared to 30 years ago.5-7 Randomized trials and longitudinal studies have linked SSB consumption to excess weight gain, diabetes, and cardiovascular disease. Consumption of SSBs increases the risk of chronic diseases through its impact on BMI and other mechanisms.8,9 The Dietary Guidelines for Americans, 201510 recommends that individuals reduce SSB intake in order to manage their body weight. Drawing on the success of tobacco taxation and decades of economic research, public health experts have called for higher taxes on SSBs and documented their likely impact.11-14 In 2009, the IOM recommended that local governments implement tax strategies to reduce consumption of “calorie-dense, nutrient-poor foods,” emphasizing SSBs as an apt target for taxation.15
 SSBs include all beverages with added caloric sweeteners; diet drinks include any beverages with artificial sweeteners. The modeled excise tax does not apply to baby formula, medical foods, or drinks with 50% or less fruit juice or 50% milk products.5 Although SSB consumption has declined in recent years, children and adults in the U.S. consume twice as many calories from SSBs compared to 30 years ago.6-8 Randomized trials and longitudinal studies have linked SSB consumption to excess weight gain, diabetes, and cardiovascular disease. Consumption of SSBs increases the risk of chronic diseases through its impact on BMI and other mechanisms.9,10 The Dietary Guidelines for Americans, 201511recommends that individuals reduce SSB intake to manage their body weight. Drawing on the success of tobacco taxation and decades of economic research, public health experts have called for higher taxes on SSBs and documented their likely impact.12-15 In 2009, the IOM recommended that local governments implement tax strategies to reduce consumption of “calorie-dense, nutrient-poor foods,” emphasizing SSBs as an apt target for taxation.16
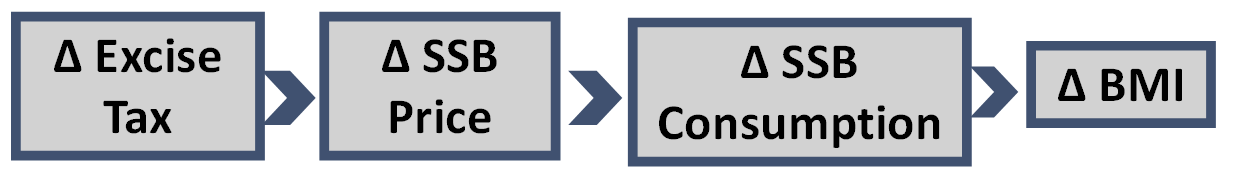

 “We know that the current level of sugar-sweetened beverage consumption in the United States is doing real harm to our children, our families, and our society by increasing the risk of obesity, diabetes, and cardiovascular disease, leading to increased healthcare costs and early deaths,” says lead study author