The information in this report is intended to provide educational information on the cost-effectiveness of sugary drink excise fees.
Executive Summary
Continually rising rates of obesity represent one of the greatest public health threats facing the United States. Obesity has been linked to excess consumption of sugary drinks. Federal, state, and local governments have considered implementing taxes on sugary drinks to reduce consumption, reduce obesity, and provide a new source of government revenue.1-3 A fee on sugary drinks is a similar strategy to increase the price of sugary drinks, improve health, and provide revenue.
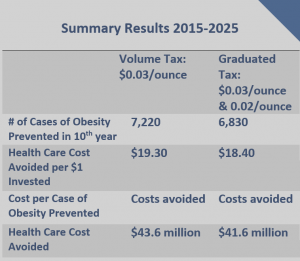
We modeled implementation of a state fee on sugary drinks at fees of $0.03/ounce, $0.02/ounce, and $0.01/ounce. This report summarizes the results of the $0.01/ounce fee. Results for additional fee rates can be found in Appendices 1 and 2 (please see pages 15 and 16 in the PDF of the report).
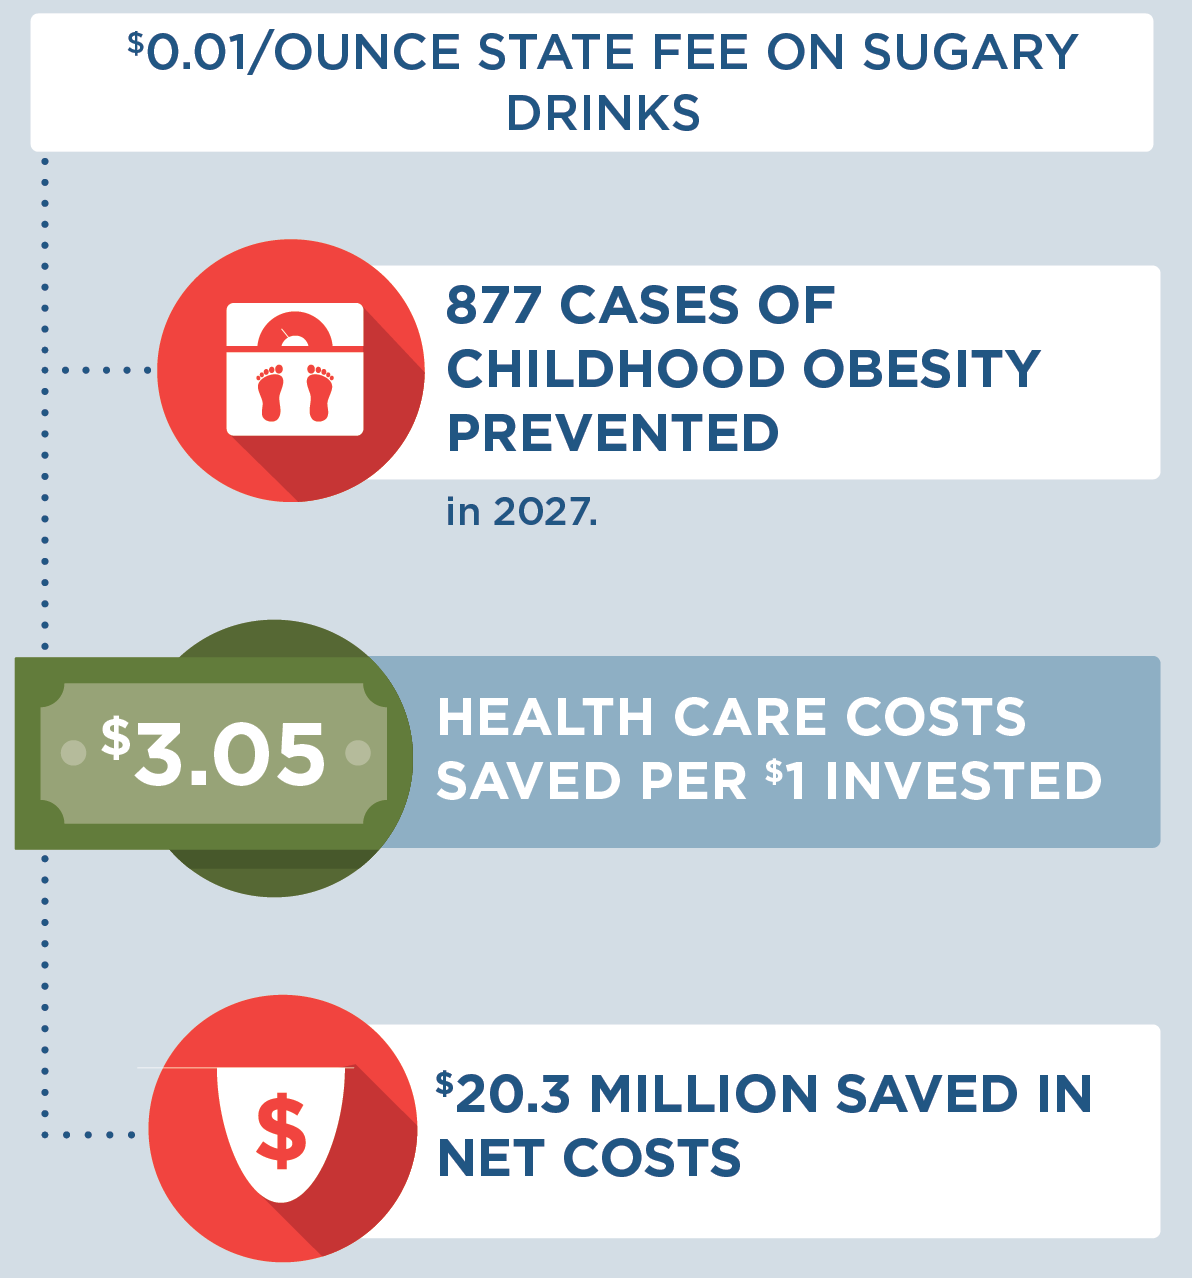
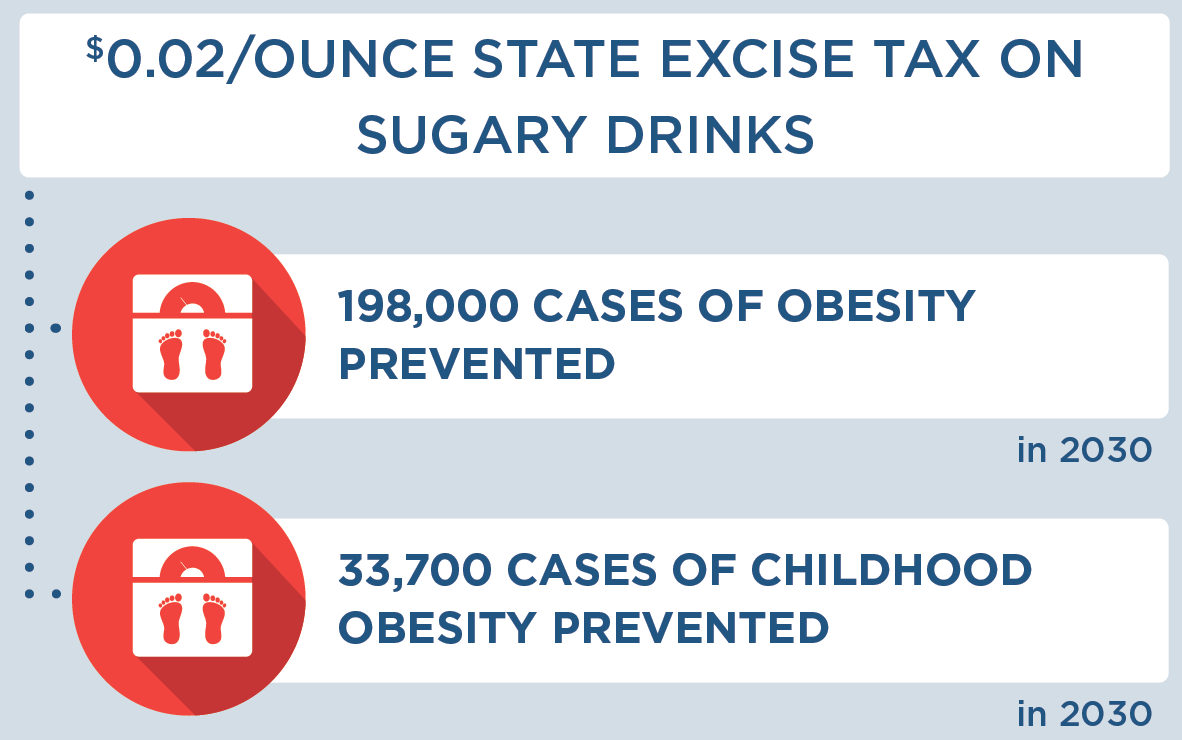
The $0.01/ounce fee is projected to be cost-saving and result in lower levels of sugary drink consumption, thousands of cases of obesity prevented, and tens of millions of dollars in health care cost savings. The fee is projected to save $3.05 in health care costs per dollar invested.
Background
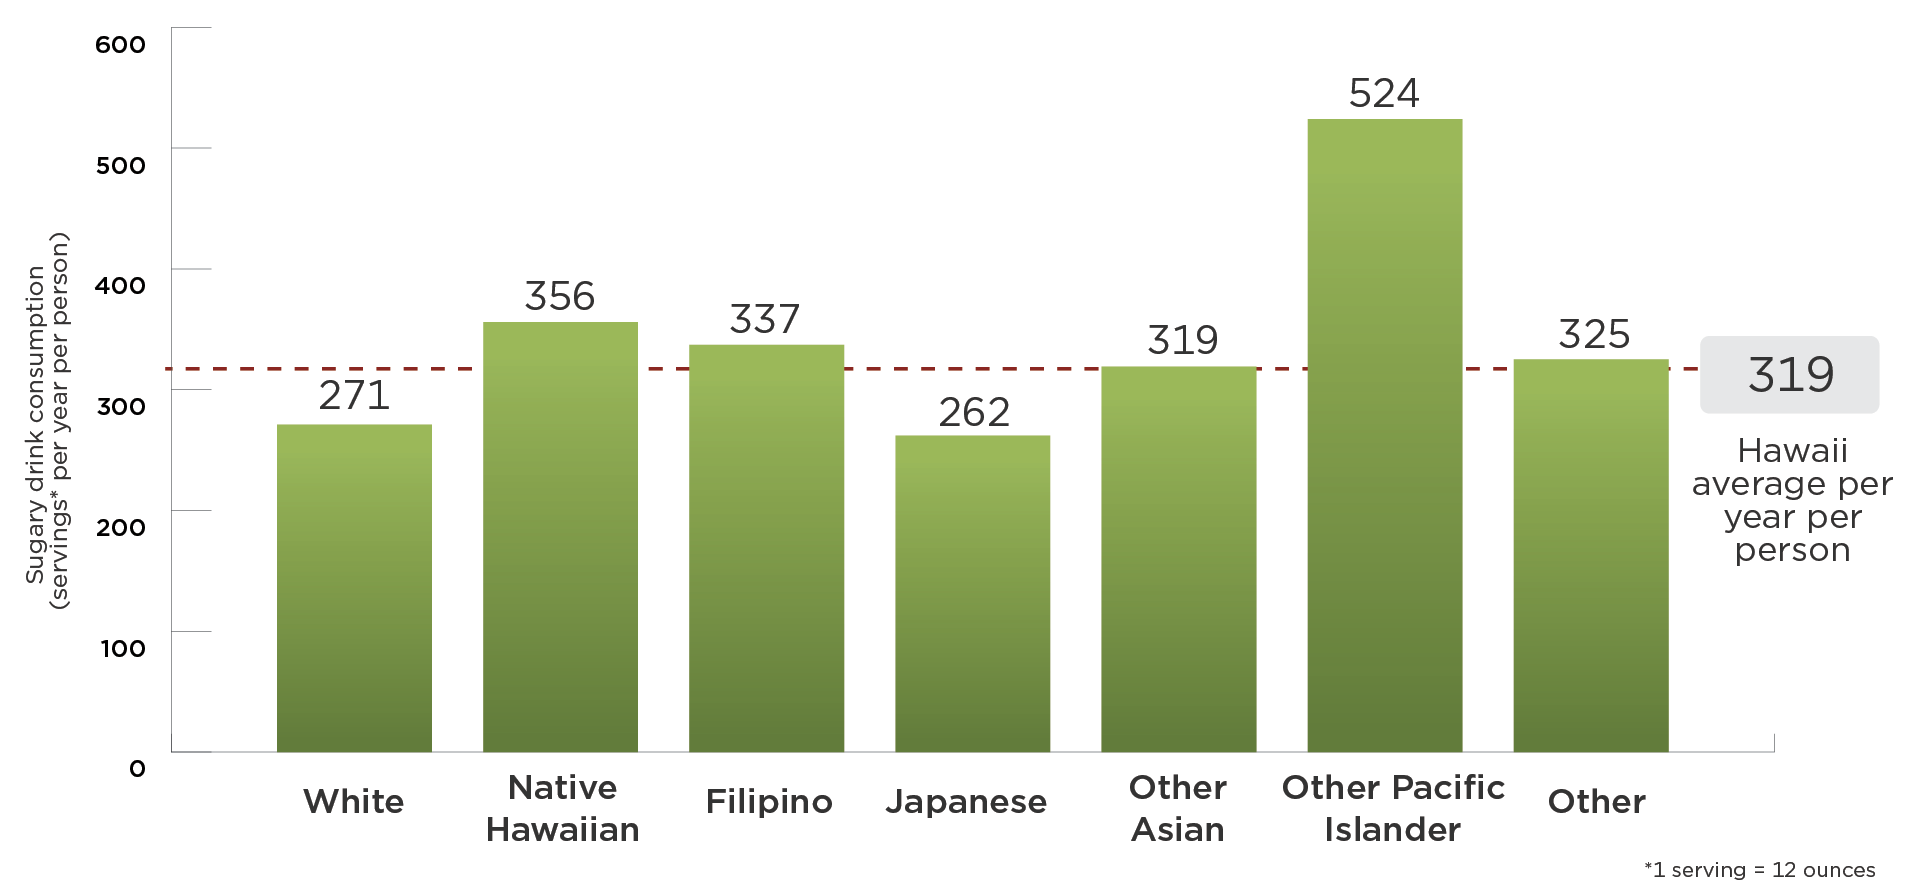
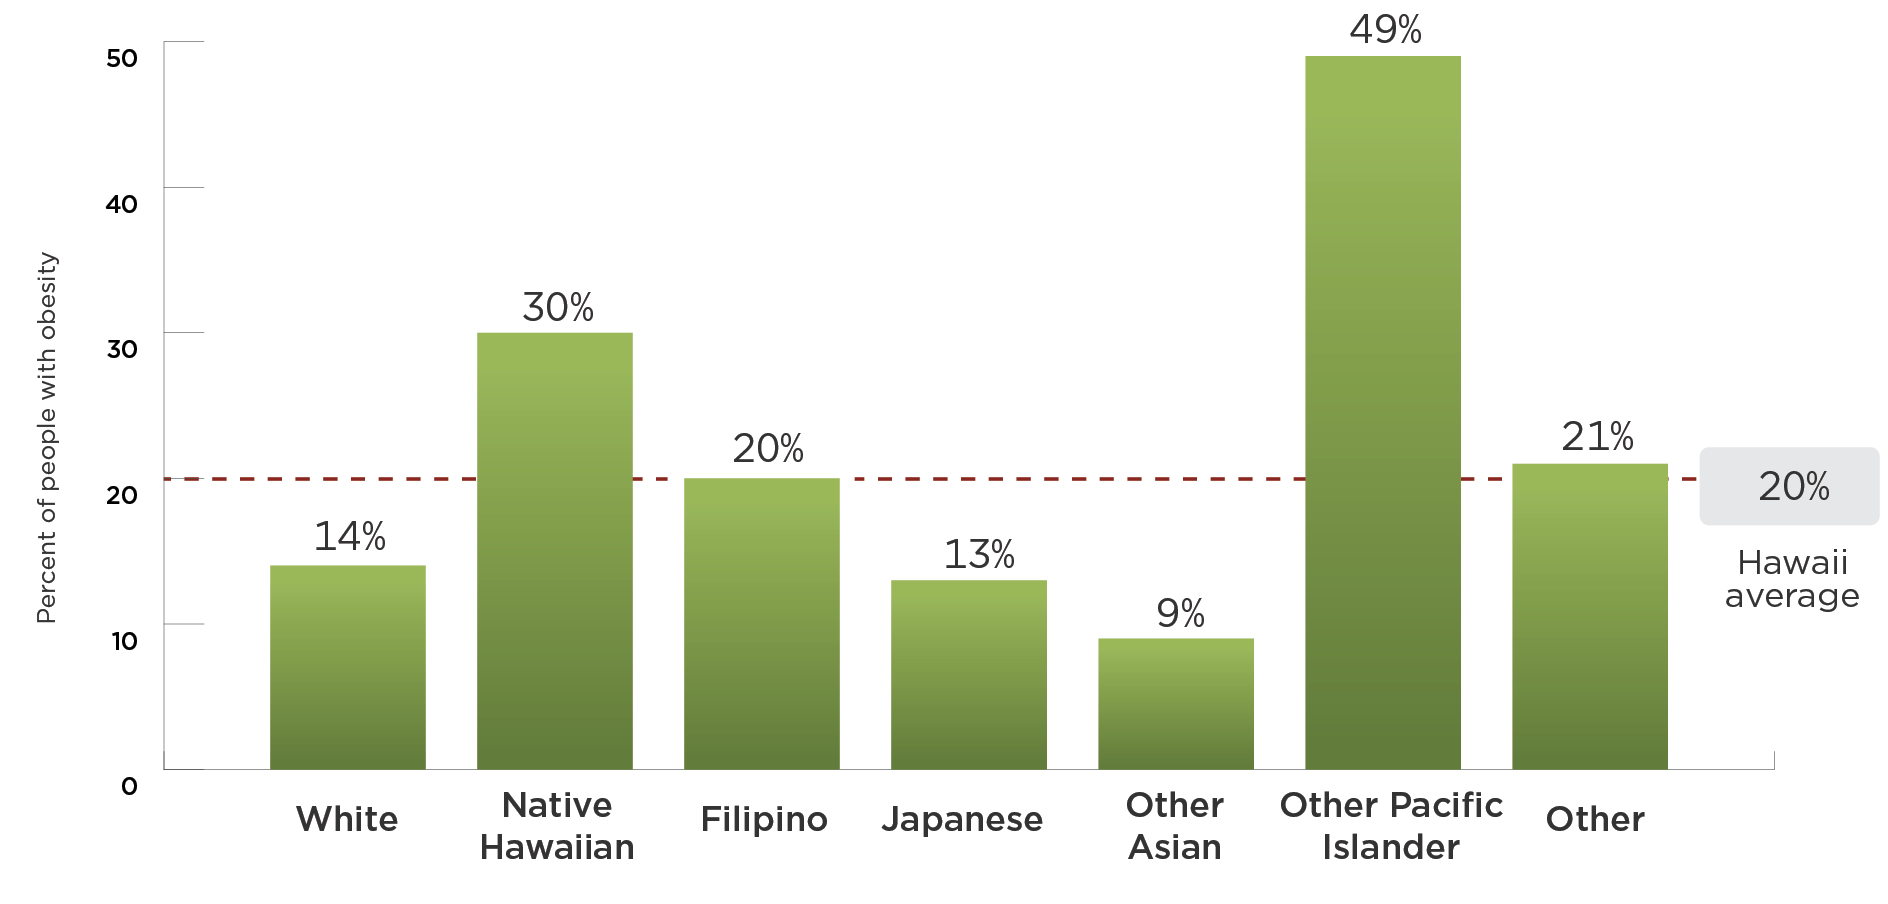
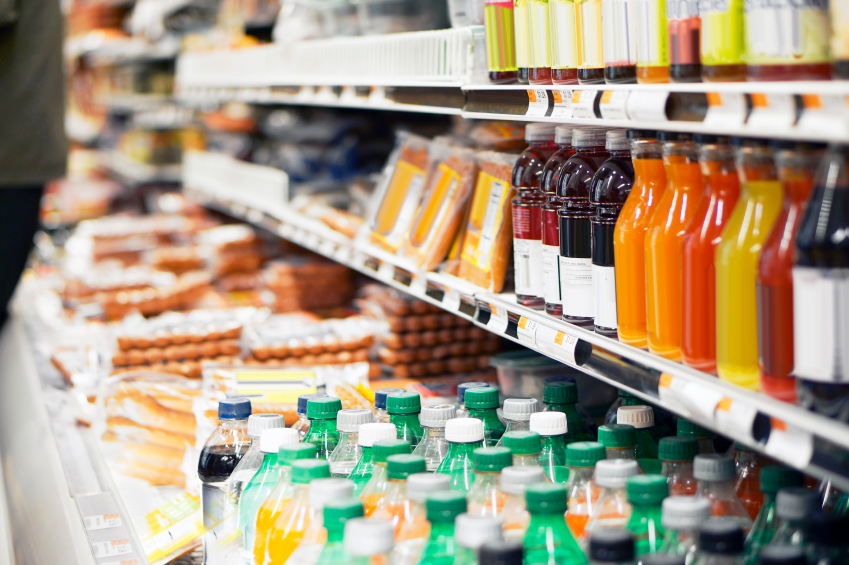
Although consumption of sugary drinks (defined as all drinks with added caloric sweeteners) has declined in recent years, adolescents and young adults in the United States consume more sugar than the Dietary Guidelines for Americans 2020-2025 recommend, with persistent racial/ethnic disparities.4-6 According to recent estimates, 56% of adults and 63% of youth in Hawaii report drinking soda.7-8 The percentage of adults in Hawaii who report drinking soda varies by racial and ethnic group, with more consumption reported by Native Hawaiian, Other Pacific Islander, and Black residents and less consumption reported by Chinese, Japanese, Filipino, and White residents.7 On average, teenagers in Hawaii consume more sugary drinks than other age groups, and nearly half of Hawaii teens (46%) drink one or more sugary drinks per day.9 Public health researchers have suggested that excess intake of sugary drinks may be one of the single largest drivers of the obesity epidemic in the U.S.10 An estimated 57% of adults and 28% of youth in Hawaii have overweight or obesity.8,10
Targeted marketing contributes to differences in consumption levels by income level. People who live in low-income areas are more exposed to advertisements for sugary drinks than those who live in high-income areas.11 Exposure to advertisements may influence sugary drink consumption levels in these communities, as low-income consumers on average consume more sugary drinks than higher income consumers.12
Consumption of sugary drinks increases the risk of chronic diseases through changes in body mass index (BMI), insulin regulation, and other metabolic processes.13-14 Randomized intervention trials and longitudinal studies have linked increases in sugary drink consumption to excess weight gain, diabetes, cardiovascular disease, and other health risks.13-14 There are persistent racial and ethnic disparities across both sugary drink consumption levels and rates of obesity and chronic disease.4-6 In light of this evidence, the Dietary Guidelines for Americans 2020-202515 recommend that individuals limit their sugary drink intake in order to manage body weight and reduce risk of chronic disease.
Targeted pricing strategies have emerged as one recommended strategy to reduce consumption of sugary drinks.16 This strategy has been studied by public health experts, who have drawn on the success of tobacco taxation and decades of economic research to model the estimated financial and health impact of a sugary drink tax.17-20 In Hawaii, rising costs of health care and insurance premiums are impacting businesses under Hawaii’s Prepaid Health Care Act.21 Passage of a sugary drink fee has been discussed as an effective strategy to reduce Hawaii’s health care costs.21-22 Public poll results in Hawaii show that there is support of a sugary drink fee as an approach to reduce obesity.22
This report aims to model the projected effect of a Hawaii sugary drink fee on health and disease outcomes over a decade. All drinks with added caloric sweeteners were considered subject to the fee, while 100% juice and milk products were considered exempt. The fee would be reflected in the posted price of sugary drinks, similar to an excise tax.
Key Terms
|
How would a fee work?
|
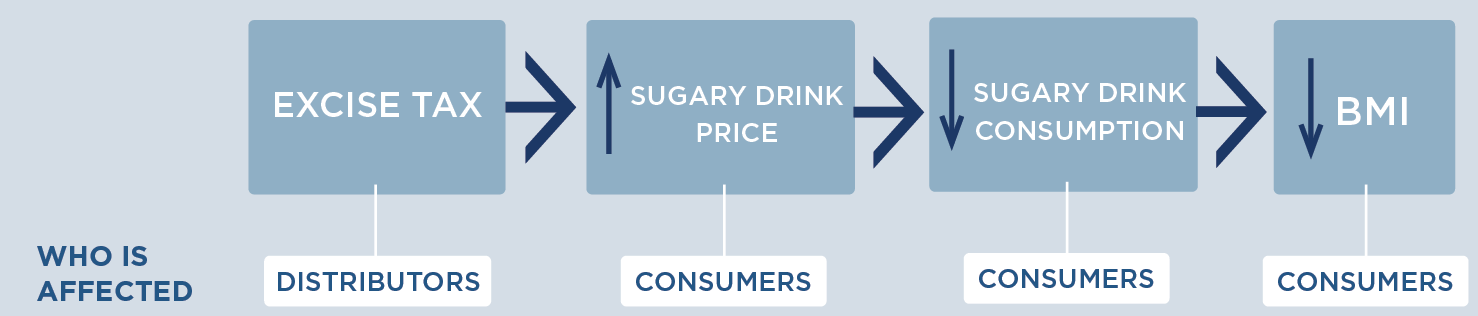
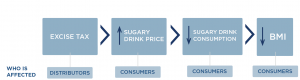
MODELING FRAMEWORK: How fees on sugary drinks can lead to better health
A state fee is linked to change in BMI through change in sugary drink price and consumption
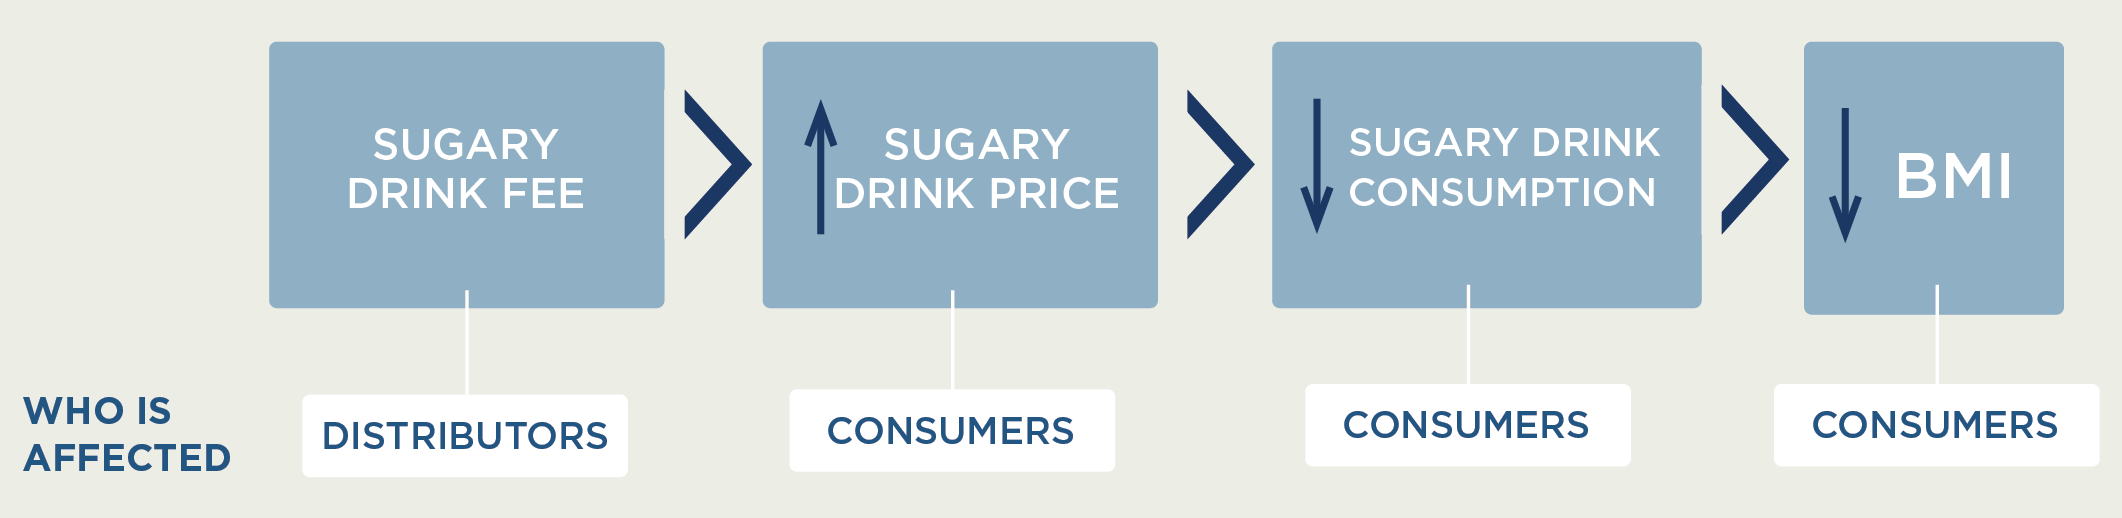
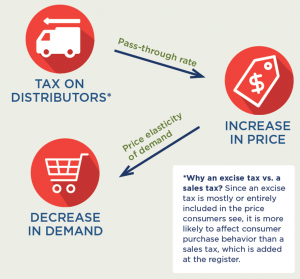
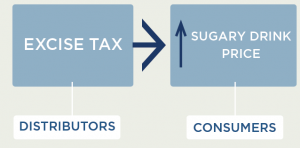
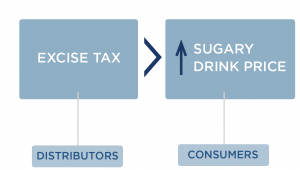
How does a fee on distributors affect the price paid by consumers?
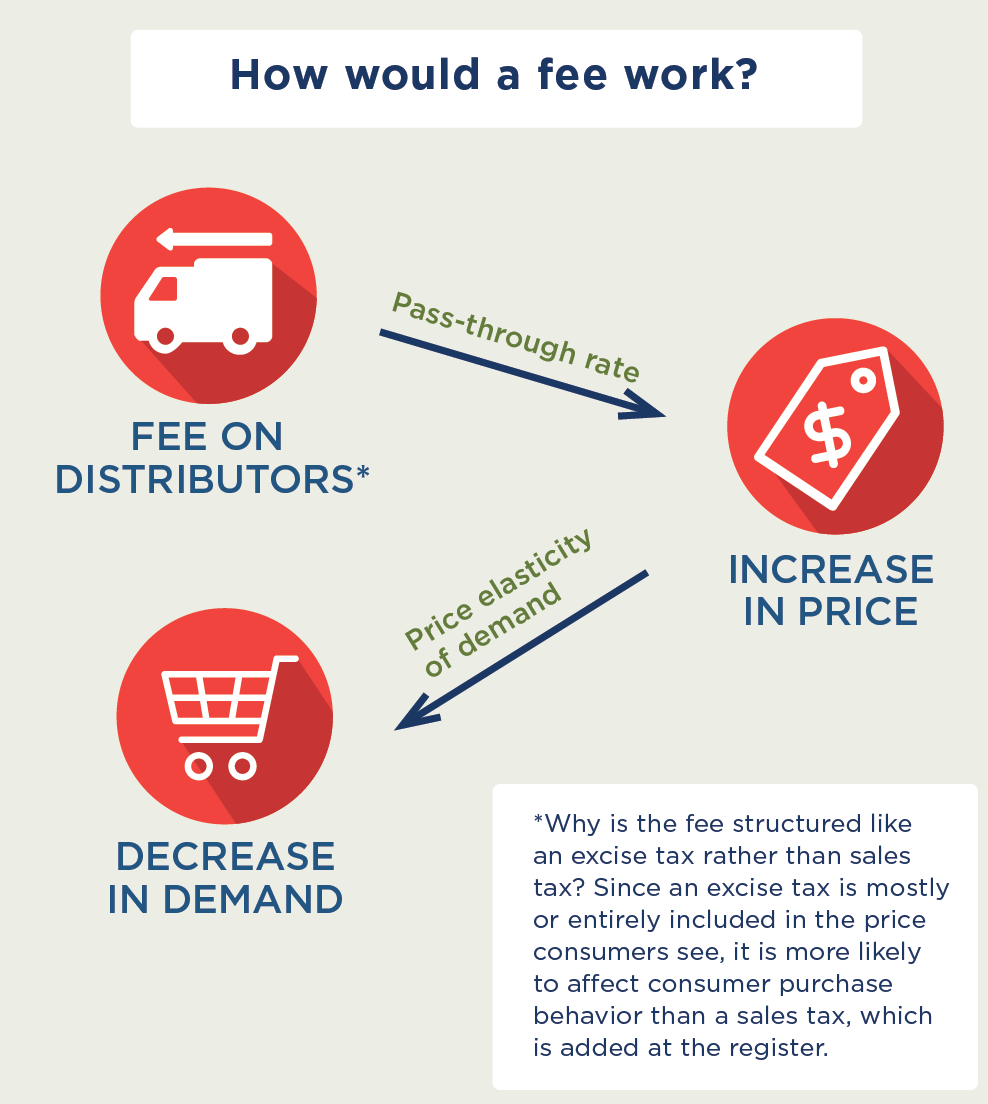
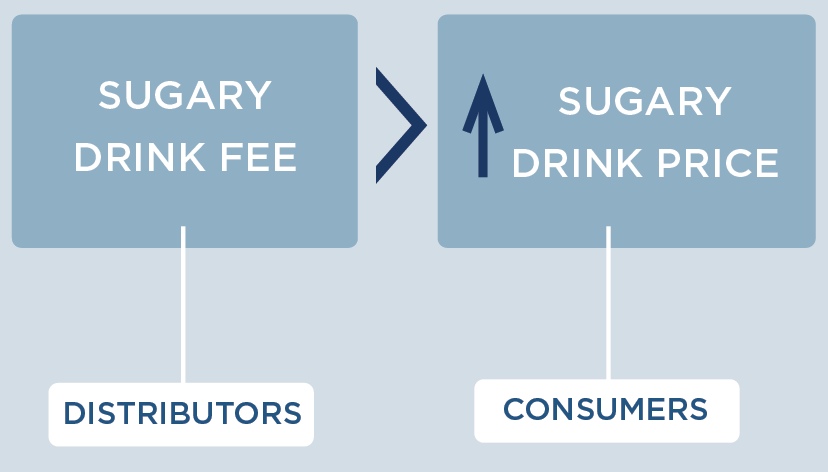 Since the cost of a sugary drink fee is incorporated directly into the beverage’s sticker price, a fee structured like an excise tax will likely influence consumer purchasing decisions more than a comparable sales tax that is added onto the item at the register. We assume 100% pass-through of the fee over 10 years and assume the fee would be adjusted annually for inflation. Our pass-through rate estimate is supported by empirical studies of excise taxes in Mexico and France that demonstrate near-complete pass-through rates to consumers.23 Short-term studies for the local tax in Berkeley indicate imperfect, or less than 100%, pass-through.2,24-25 The Hawaii Department of Health used an existing tool26 to collect beverage price data from 257 venues in Hawaii, including 74 supermarkets, 74 grocery stores, 90 limited-service venues, 18 fast food restaurants, and one gas station/convenience store. Retail prices were weighted by national share of purchase and consumption.26 The weighted price of sugary drinks in Hawaii was $0.07 per ounce. For example, a $0.01/ounce fee would raise the price of a 12-ounce can of soda from $0.84/can to $0.96/can.
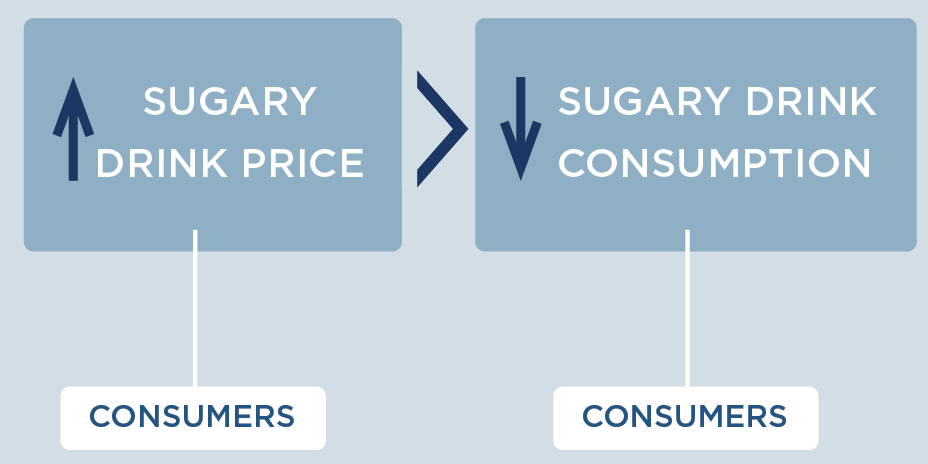
How does increasing the price of sugary drinks change individual sugary drink consumption?
To estimate current sugary drink consumption levels in Hawaii, we adjusted national estimates from the National Health and Nutrition Examination Survey (NHANES) 2011-2014 by race and ethnicity group using reported adult sugary drink consumption from the 2014 Hawaii Behavioral Risk Factor Surveillance System27 and youth sugary drink consumption from the 2012, 2013, and 2017 Hawaii Rethink Your Drink Study.28 How much consumers will change their purchases in response to price changes is called price elasticity for demand. We assume for every 10% increase in the price of sugary drinks, there will be a 12% reduction in purchases (a mean own-price elasticity of demand of -1.21).29 Recent research on the Berkeley, CA $0.01/ounce tax found a 21% reduction in sugary drink intake among low-income populations consistent with this estimate.24,30-33
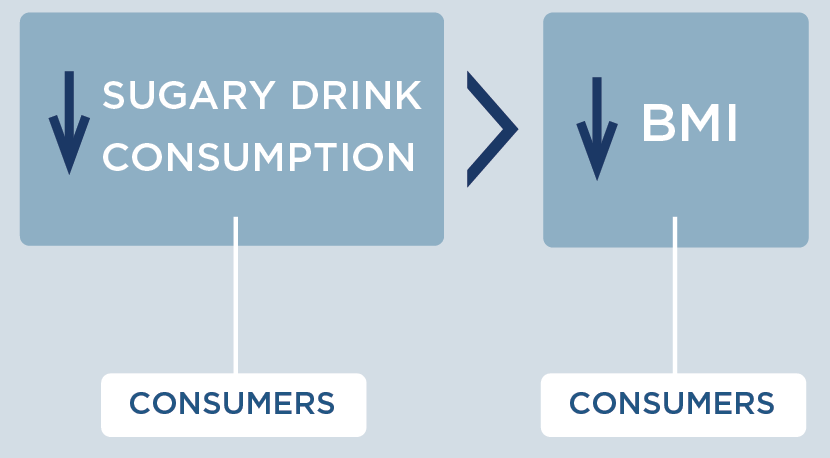
What are the individual health effects of decreasing sugary drink consumption?
Research has shown that decreasing sugary drink consumption can have positive effects on health in adults and youth. We estimated the impact of a change in sugary drink intake on body mass index (BMI), accounting for dietary compensation, based on rigorous studies identified in evidence reviews.20 The relationship among adults was modeled based on the range of estimated effects from four large, multi-year longitudinal studies, which indicated that a one-serving reduction in sugary drinks was associated with a BMI decrease of 0.21 kg/m2 to 0.57 kg/m2 in adults over a 3-year period.14,34-36 Among youth, we used evidence from a double-blind randomized controlled trial conducted over 18 months, which found that an additional 8-ounce serving of sugary drinks led to a 2.2 pound greater weight gain.37
Reach
This strategy applies to all youth and adults in Hawaii. However, the model only looks at the effects on those 2 years of age and older.*
*BMI z-scores were used in our analyses, which are not defined for children under 2 years of age.
Cost
We assume the fee will incur start up and ongoing labor costs for fee administrators in the Hawaii Department of Health. To implement the strategy, the Hawaii Department of Health would need to process fee statements and conduct audits. Businesses would also need to prepare fee statements and participate in audits, which would require labor from private fee accountants. Cost information was drawn from the Hawaii state bottle recycling program and localities with planned or implemented fees on soft drinks.20,38 The cost and benefit estimates do not include expected revenue from the fee.
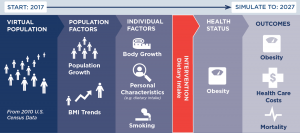
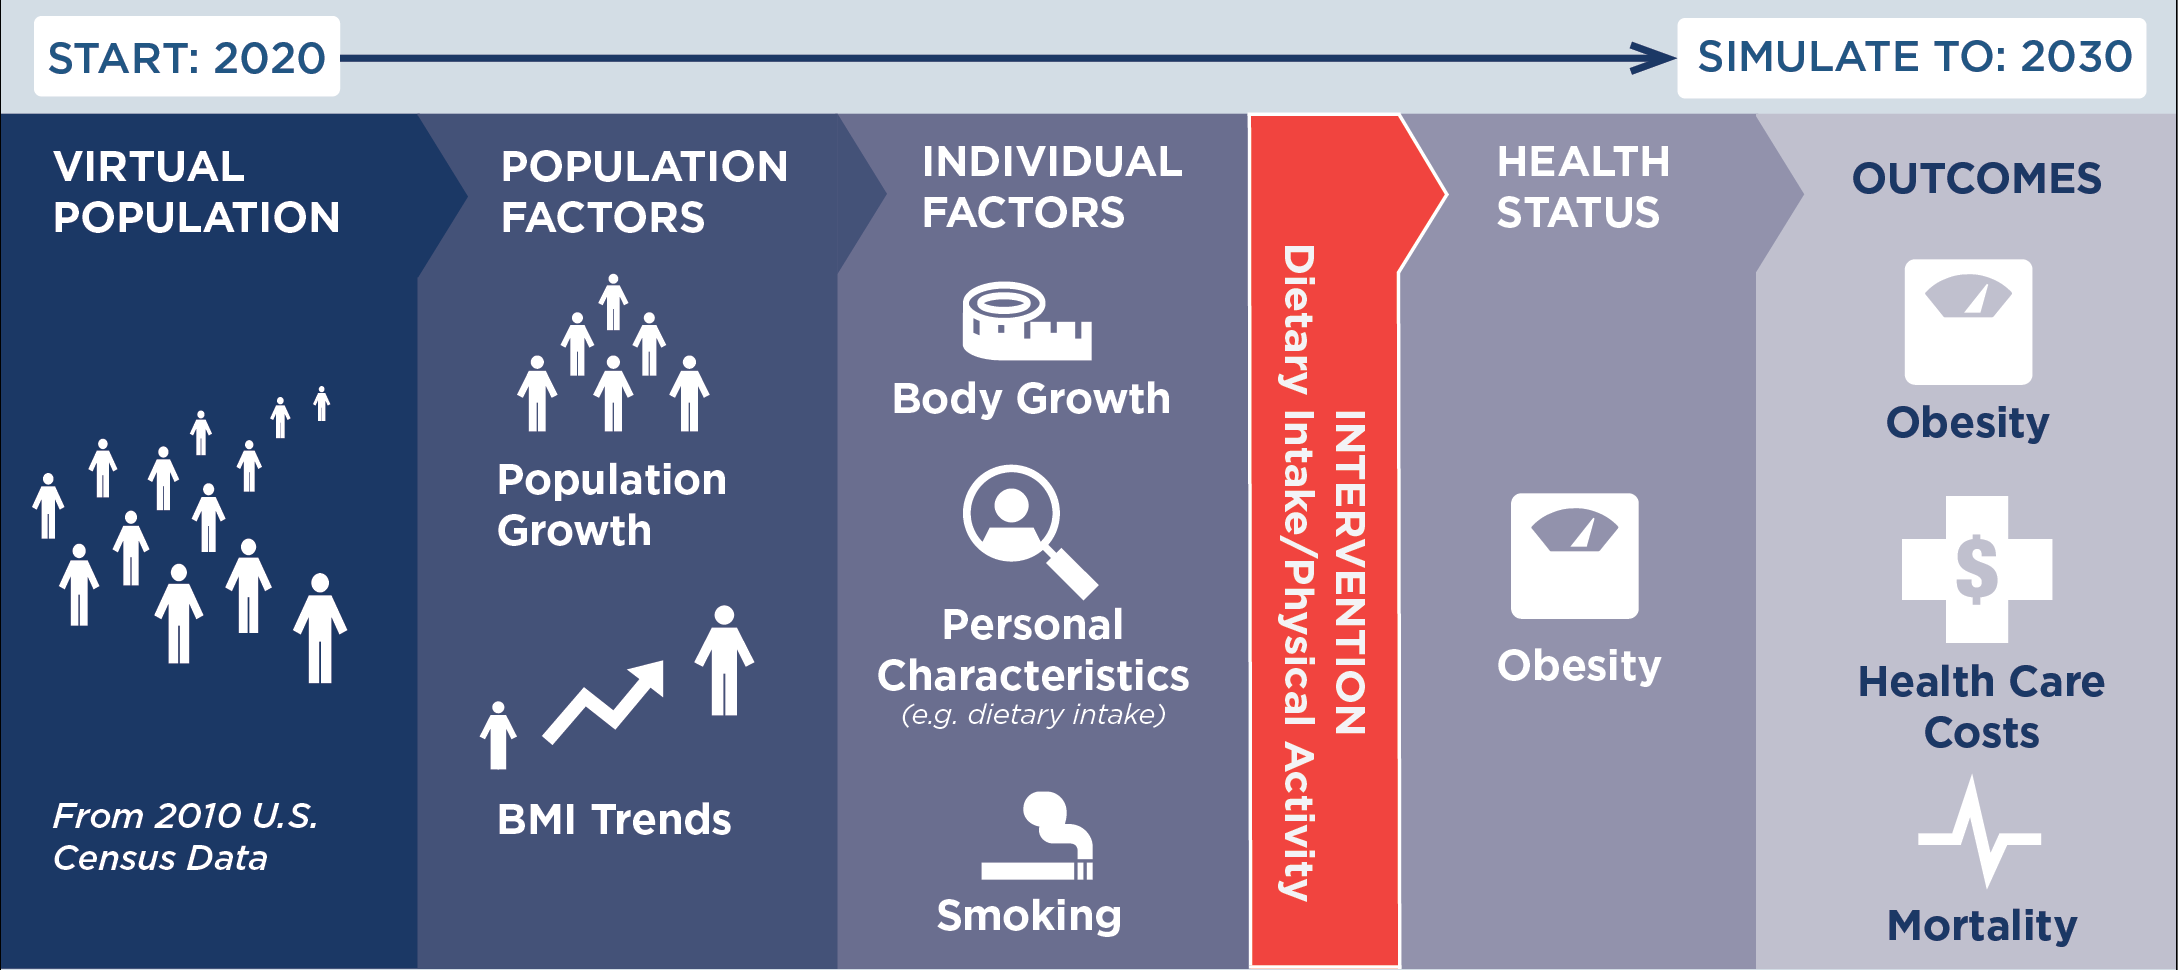
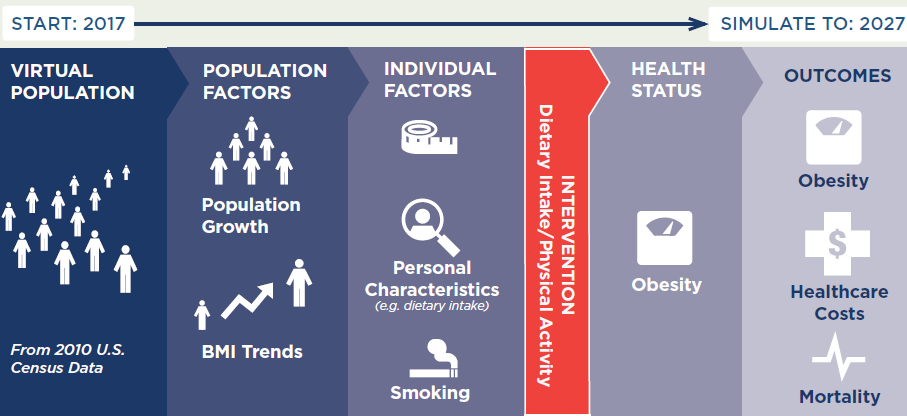
CHOICES Microsimulation Model
The CHOICES microsimulation model for Hawaii was used to calculate the costs and effectiveness over 10 years (2017–27). Cases of obesity prevented were calculated at the end of the model period in 2027. The model was based on prior CHOICES work,20,39 and created a virtual population of Hawaii residents using data from: the U.S. Census, American Community Survey, Behavioral Risk Factor Surveillance System,40 NHANES, National Survey of Children’s Health,41 the Medical Expenditure Panel Survey, multiple national longitudinal studies, and obesity prevalence data provided by the Hawaii Department of Health. Using peer-reviewed methodology, we forecasted what would happen to this virtual population with and without a sugary drink fee to model changes in disease and mortality rates and health care costs due to the fee.
Results: $0.01/ounce State Fee on Sugary Drinks
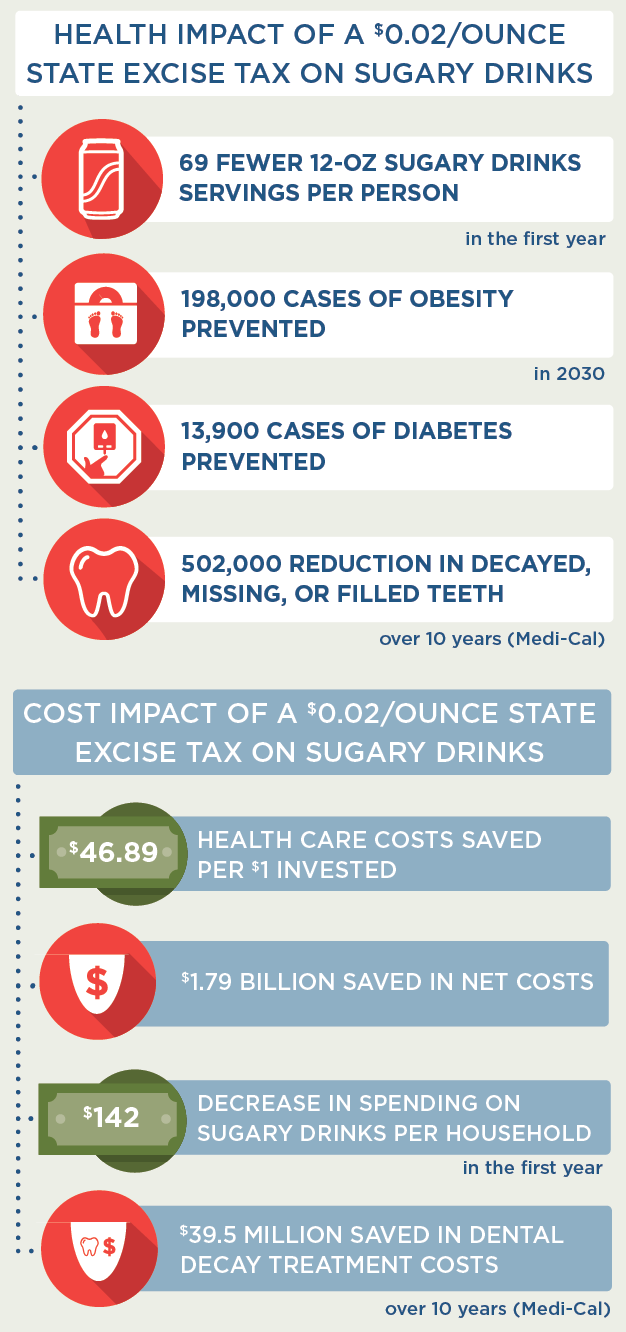
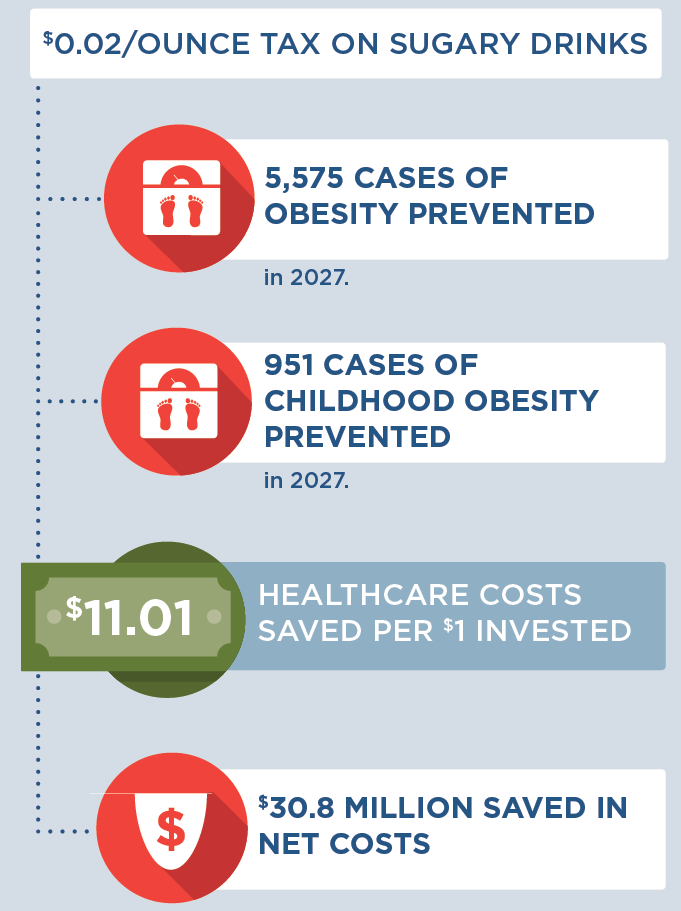
Overall, the model shows that a sugary drink fee is cost-saving. Compared to the simulated natural history without a fee, the fee is projected to result in lower levels of sugary drink consumption, fewer cases of obesity, fewer deaths, and health care cost savings greater than $30 million over the 10-year period under consideration.
The estimated reduction in obesity attributable to the fee leads to lower projected health care costs, offsetting fee implementation costs and resulting in net cost savings. The difference between total health care costs with no strategy and lower health care costs with a strategy represent health care costs saved; these savings can be compared to the cost of implementing the fee to arrive at the metric of health care costs saved per $1 invested.
Results for additional fee rates can be found in Appendix 1 ($0.02/ounce fee) and Appendix 2 ($0.03/ounce fee). Please see pages 15 and 16 in the PDF of the report.
| Outcome | $0.01/ounce fee Mean (95% uncertainty interval) |
| 10 Year Reach* | 1,690,000 (1,690,000; 1,690,000) |
| First Year Reach* | 1,440,000 (1,440,000; 1,440,000) |
| Decrease in 12-oz Servings of Sugary Drinks per Person in the First Year* | 55 (32; 117) |
| Mean Reduction in BMI Units per Person* | -0.155 (-0.288; -0.040) |
| 10 Year Intervention Implementation Cost per Person | $5.86 ($5.85; $5.87) |
| Total Intervention Implementation Cost Over 10 Years | $9,900,000 ($9,900,000; $9,900,000) |
| Annual Intervention Implementation Cost | $990,000 ($990,000; $990,000) |
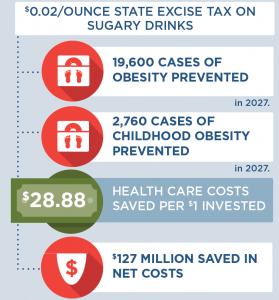
| Health Care Costs Saved Over 10 Years | $30,200,000 ($10,500,000; $74,300,000) |
| Net Costs Difference Over 10 Years | -$20,300,000 (-$64,400,000; -$581,000) |
| Quality Adjusted Life Years (QALYs) Gained Over 10 Years | 1,790 (608; 4,530) |
| Years of Life Gained Over 10 Years | 505 (157; 1,300) |
| Deaths Prevented Over 10 Years* | 142 (38; 313) |
| Years with Obesity Prevented Over 10 Years | 43,300 (14,900; 109,000) |
| Health Care Costs Saved per $1 Invested Over 10 Years | $3.05 ($1.06; $7.51) |
| Cases of Obesity Prevented in 2027* | 6,040 (2,160; 15,100) |
| Cases of Childhood Obesity Prevented in 2027* | 877 (321; 2,280) |
| Cost per Year with Obesity Prevented Over 10 Years | Cost-saving |
| Cost per QALY Gained Over 10 Years | Cost-saving |
| Cost per YL Gained Over 10 Years | Cost-saving |
| Cost per Death Averted Over 10 Years | Cost-saving |
Uncertainty intervals are estimated by running the model 1,000 times, taking into account both uncertainty from data sources and virtual population projections, and calculating a central range in which 95 percent of the model results fell.
All metrics reported for the population over a 10-year period and discounted at 3% per year, unless otherwise noted.
*Not discounted.
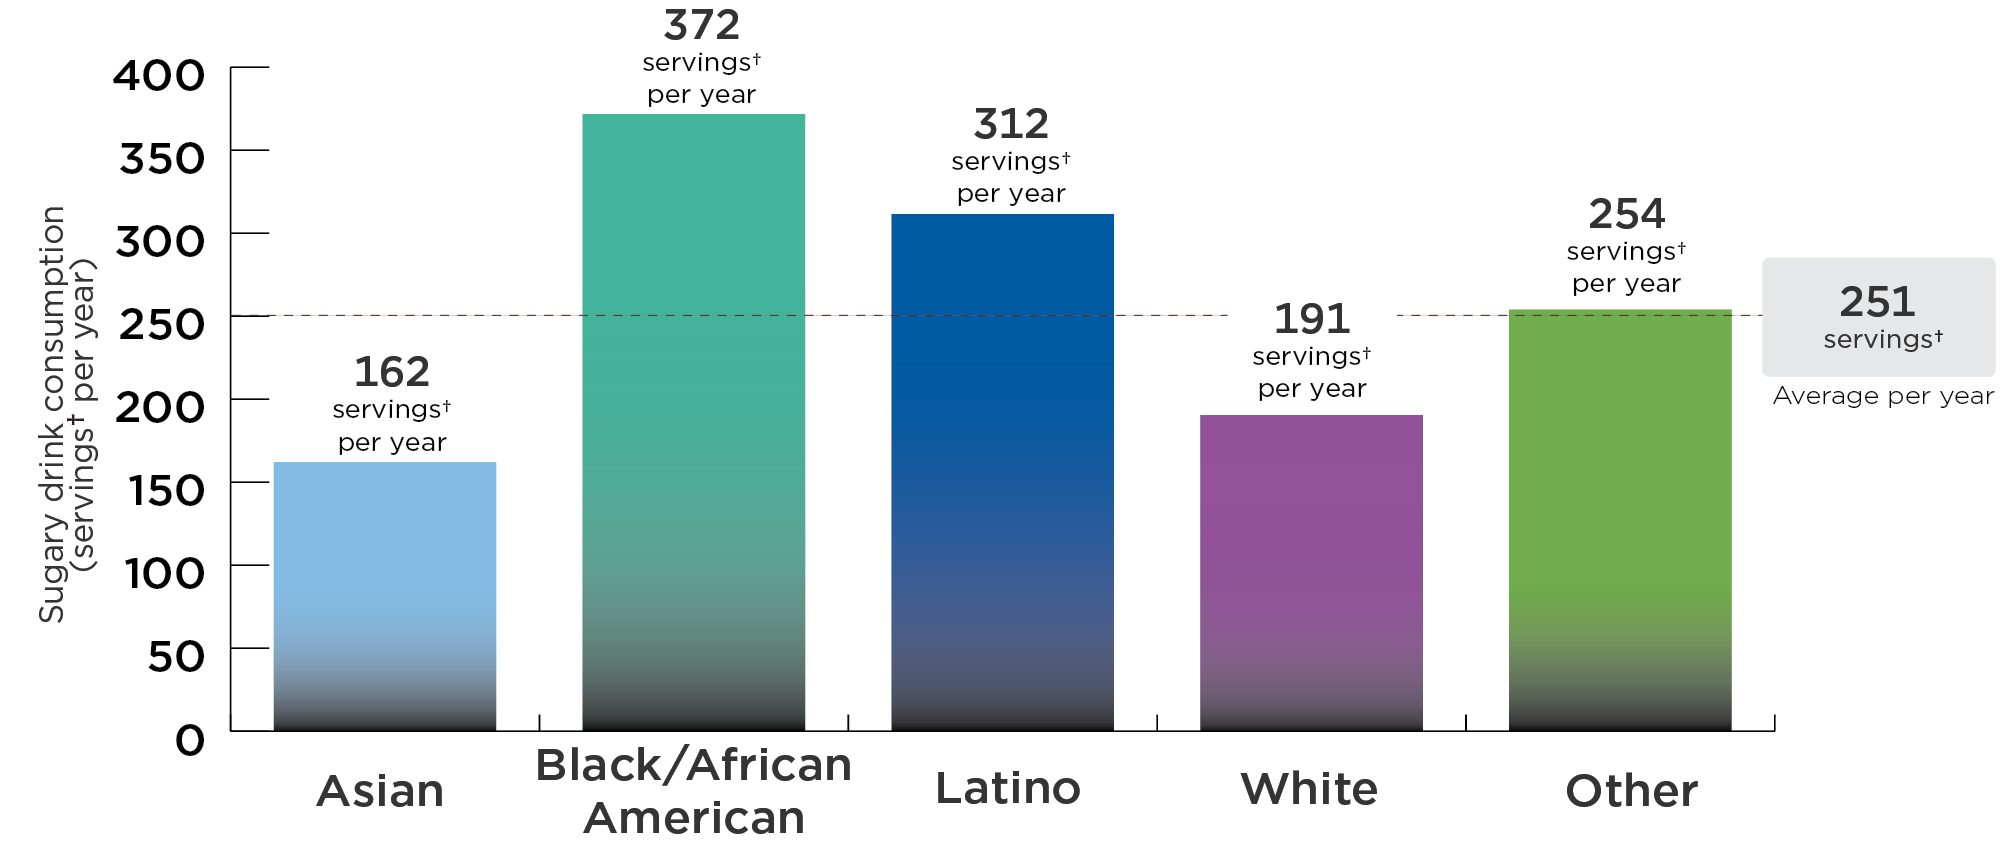
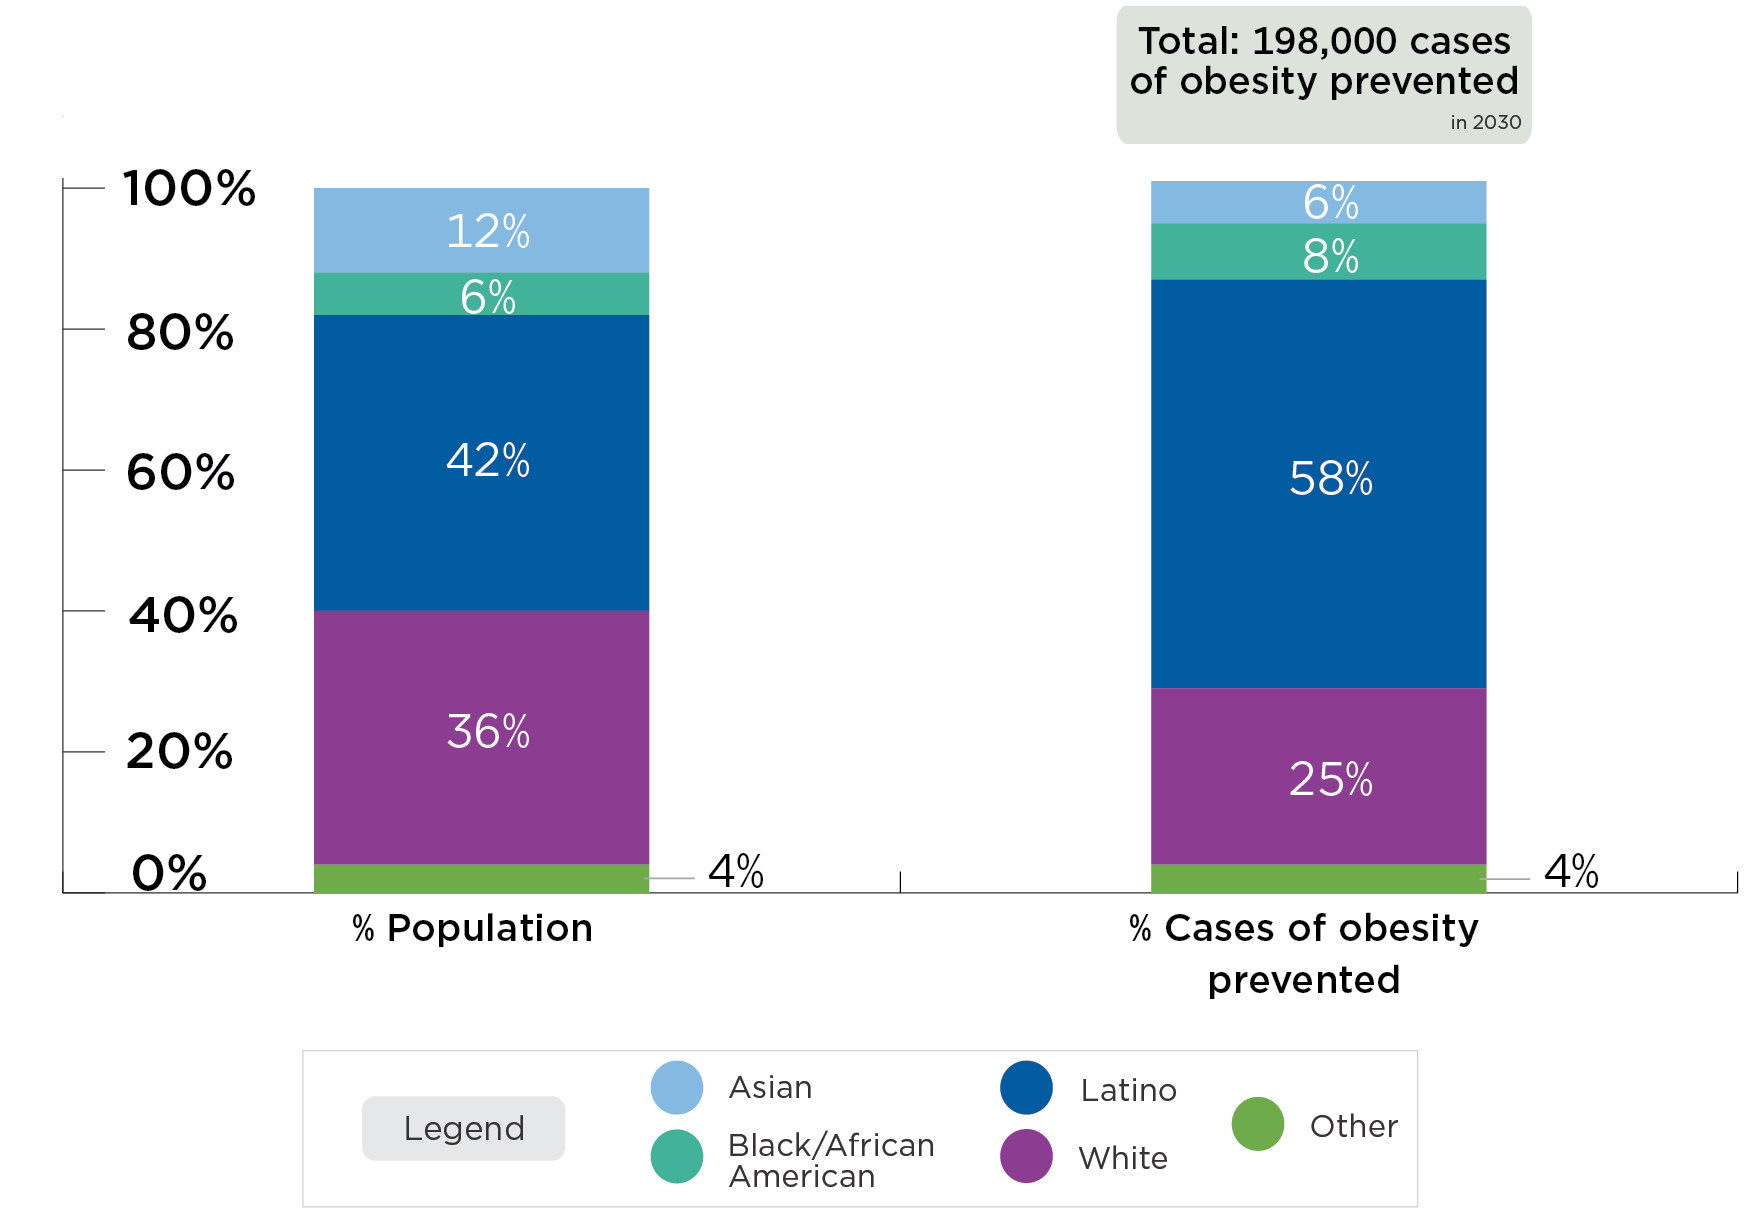
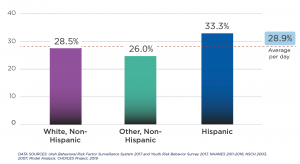
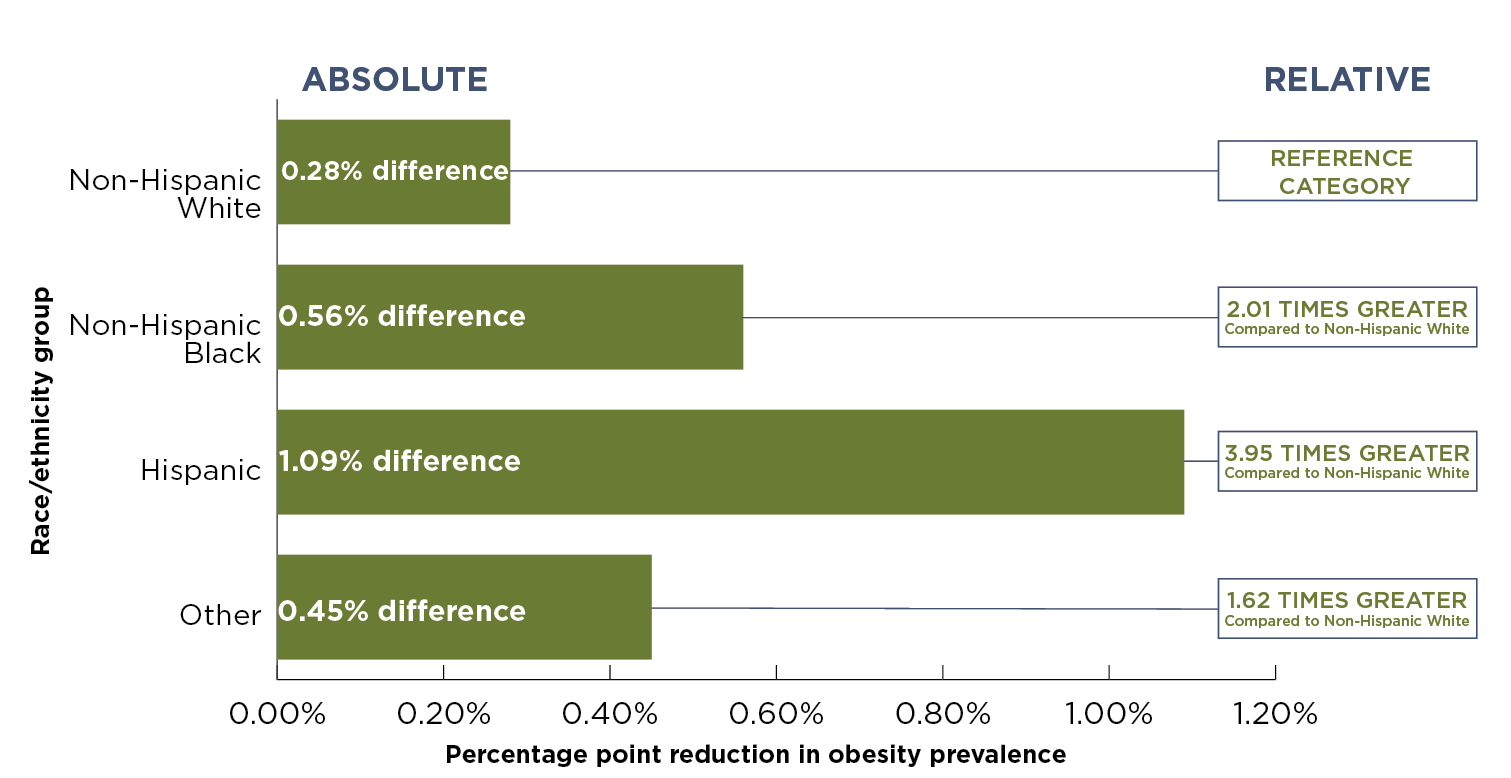
There are differences in sugary drink consumption and obesity prevalence by race and ethnicity in Hawaii. The CHOICES model used Hawaii data to build a virtual Hawaii population. Without any strategy:
Sugary drink consumption is highest in the Native Hawaiian and Other Pacific Islander populations
Obesity prevalence is highest in the Native Hawaiian and Other Pacific Islander populations
Results: $0.01/ounce State Fee on Sugary Drinks By Race and Ethnicity Groups
| Outcome | White Mean (95% uncertainty interval) |
Native Hawaiian Mean (95% uncertainty interval) |
Filipino Mean (95% uncertainty interval) |
Japanese Mean (95% uncertainty interval) |
Other Asian Mean (95% uncertainty interval) |
Other Pacific Islander Mean (95% uncertainty interval) |
Other Mean (95% uncertainty interval) |
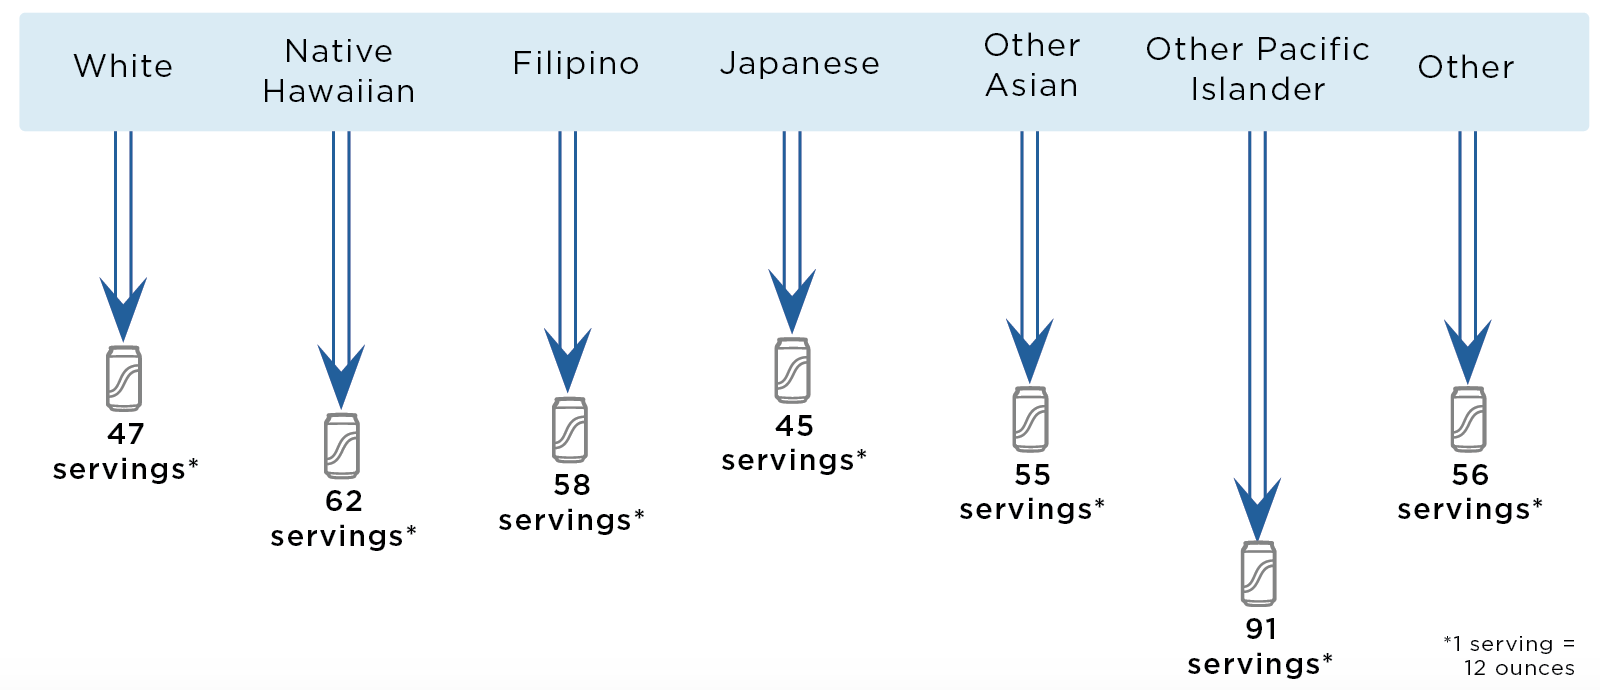
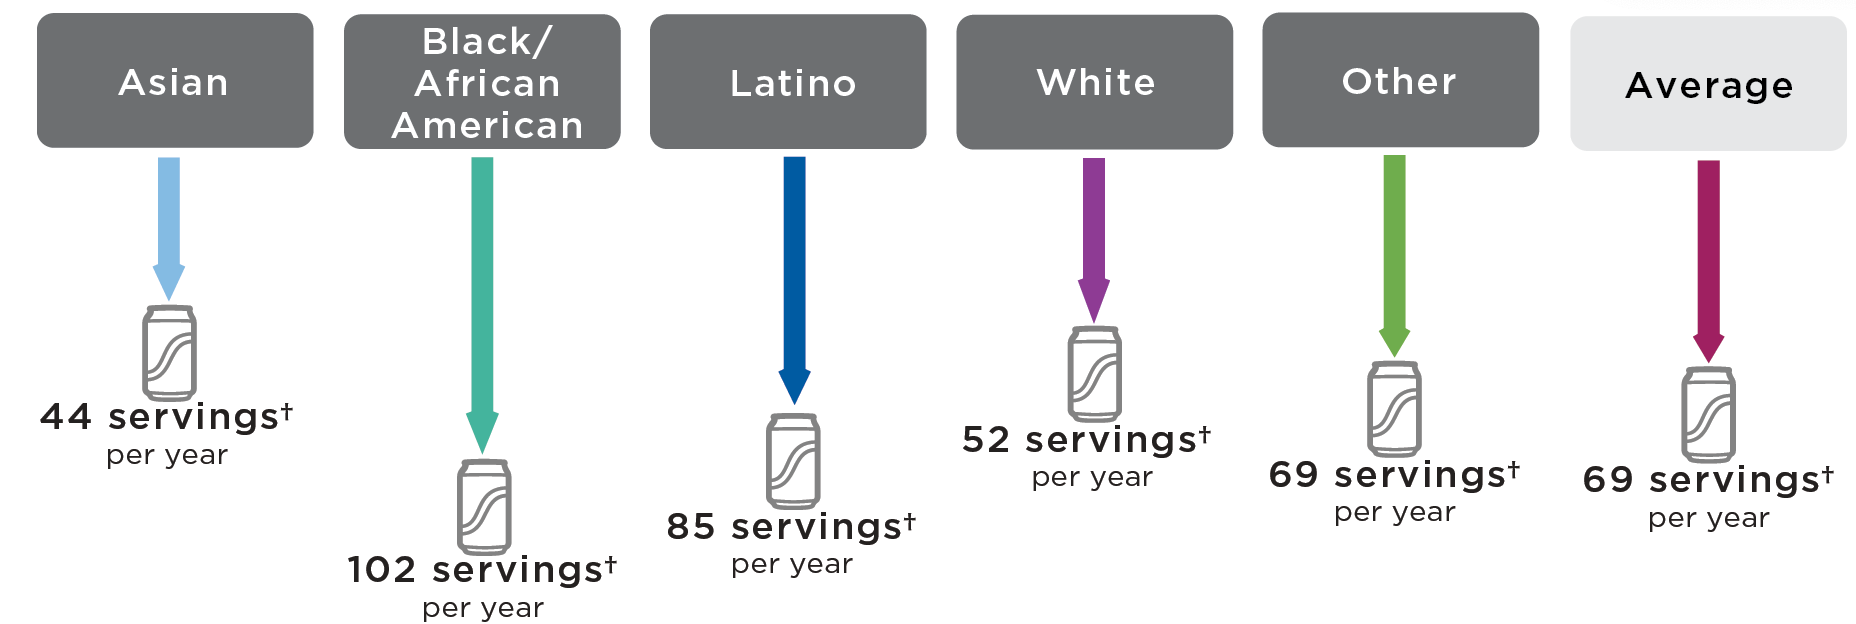
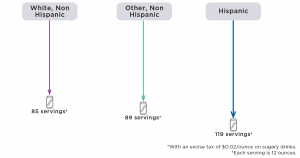
| Decrease in 12-oz Serving of Sugary Drinks per Person in the First Year* | 47 (27; 99) |
62 (36; 132) |
58 (34; 123) |
45 (26; 97) |
55 (32; 118) |
91 (53; 192) |
56 (33; 120) |
| QALYS Gained Over 10 Years | 318 (91; 976) |
491 (144; 1,350) |
336 (98; 953) |
197 (55; 548) |
104 (28; 296) |
153 (40; 440) |
189 (54; 535) |
| Years of Life Gained Over 10 Years | 88 (13; 276) |
127 (27; 356) |
111 (22; 327) |
64 (8; 192) |
33 (2; 99) |
40 (3; 133) |
41 (7; 127) |
| Years with Obesity Prevented Over 10 Years | 6,720 (2,010; 20,800) |
13,160 (3,930; 37,100) |
6,900 (2,110; 19,200) |
3,580 (1,080; 9,950) |
1,970 (611; 5,470) |
5,260 (1,670; 14,400) |
5,730 (1,750; 16,050) |
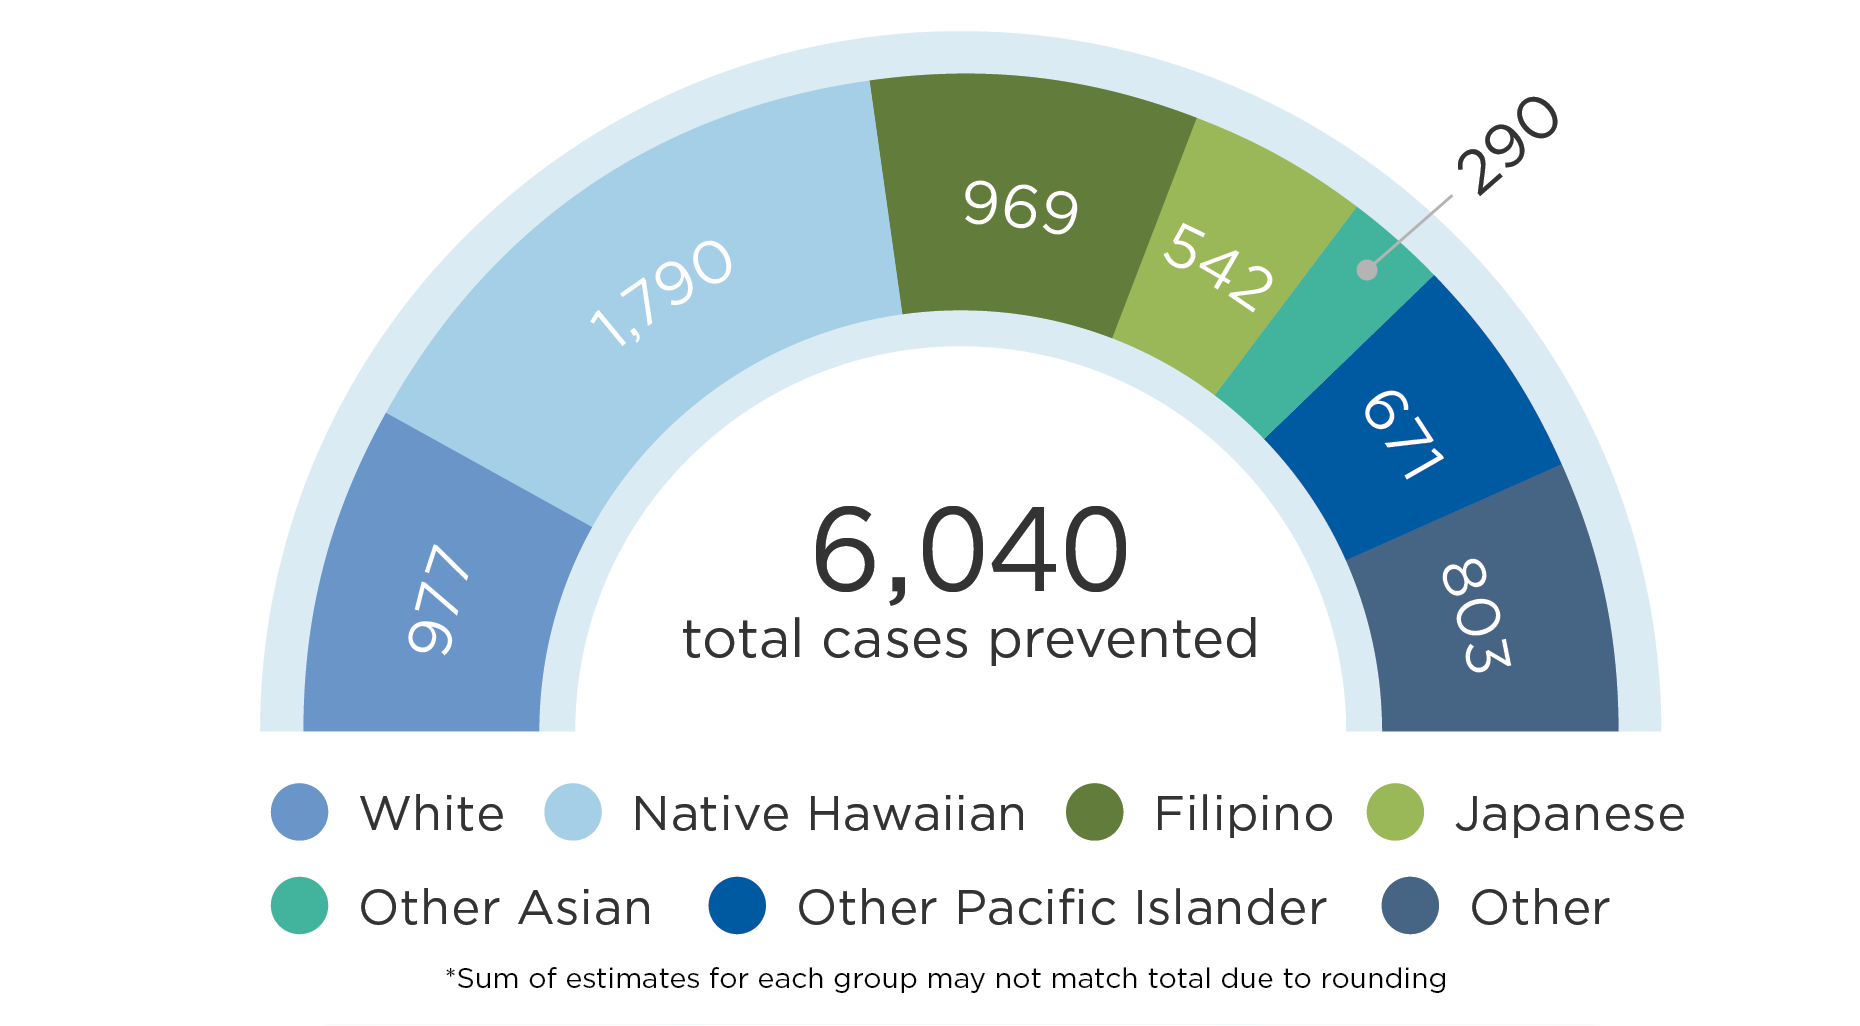
| Cases of Obesity Prevented in 2027* | 977 (293; 2,950) |
1,790 (536; 4,980) |
969 (296; 2,710) |
542 (161; 1,530) |
290 (87; 799) |
671 (202; 1,880) |
803 (248; 2,260) |
| Cases of Childhood Obesity Prevented in 2027* | 136 (38; 450) |
396 (121; 1,100) |
158 (47; 443) |
52 (14; 150) |
28 (7; 80) |
22 (70; 608) |
197 (58; 551) |
Uncertainty intervals are estimated by running the model 1,000 times, taking into account both uncertainty from data sources and virtual population projections, and calculating a central range in which 95 percent of the model results fell.
All metrics reported for the population over a 10-year period and discounted at 3% per year, unless otherwise noted.
*Not discounted.
SNAPSHOT IN 2027
Cases of obesity prevented in Hawaii from a $0.01/ounce state fee on sugary drinks by race and ethnicity group*
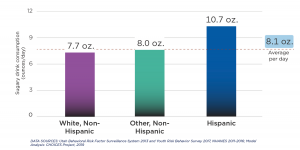
Some groups are projected to experience larger declines in consumption of servings* of sugary drinks per person in Hawaii in the first year of fee implementation
Impact on Diabetes
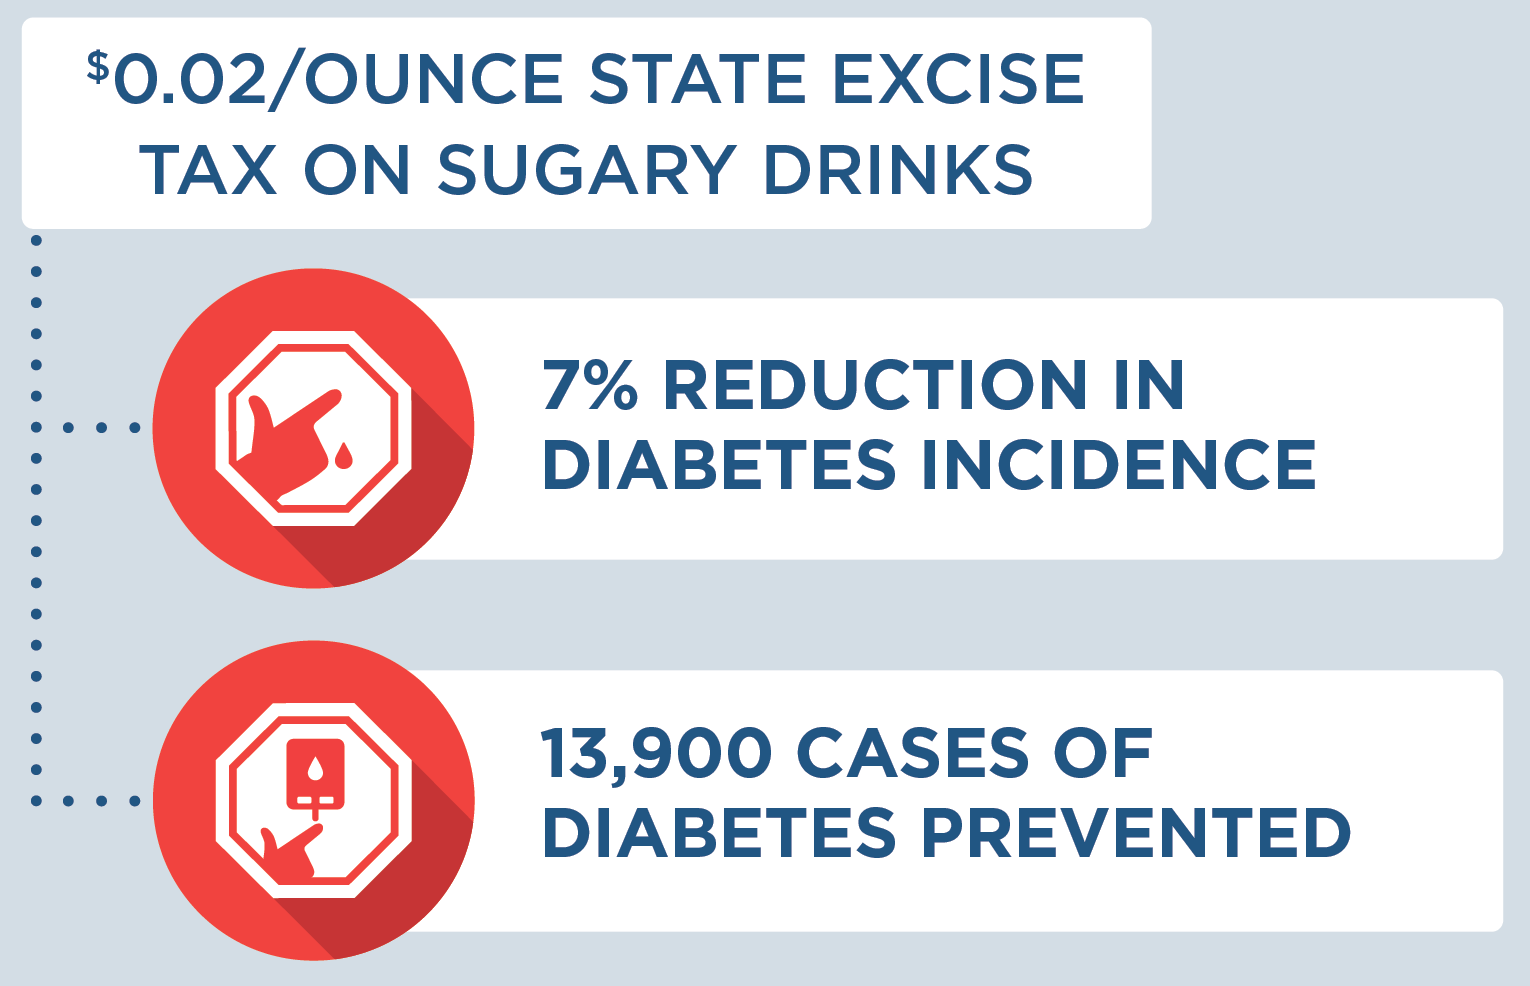
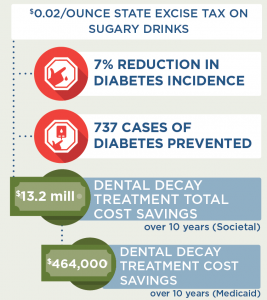
We estimated the impact of the fee-induced reduction in sugary drink intake on diabetes incidence for adults ages 18-79 years using a published meta-analysis of the relative risk of developing diabetes due to a one-serving change in sugary drink consumption42 as well as state-level estimates of diabetes incidence43 and prevalence.44 On average, each 8.5 ounce serving of sugary drinks per day increases the risk of diabetes by 18%.42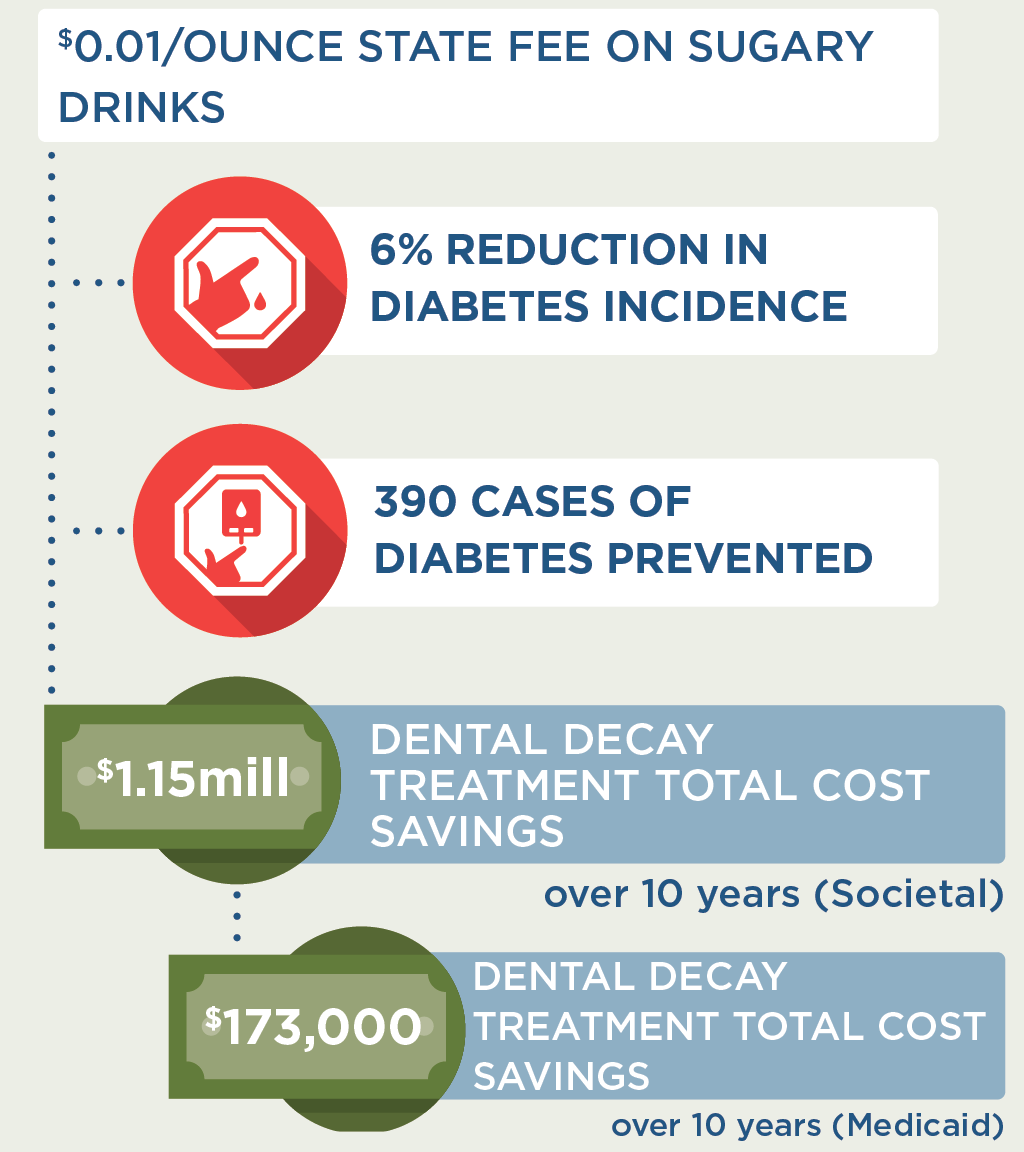
In Hawaii, we estimated that the proposed sugary drink fee would lead to a 6% reduction in diabetes incidence in the sugary drink fee models. Impact on diabetes incidence was calculated over a one-year period once the fee reaches its full effect. Impact on diabetes was calculated based on summary results from the model, not directly via microsimulation.
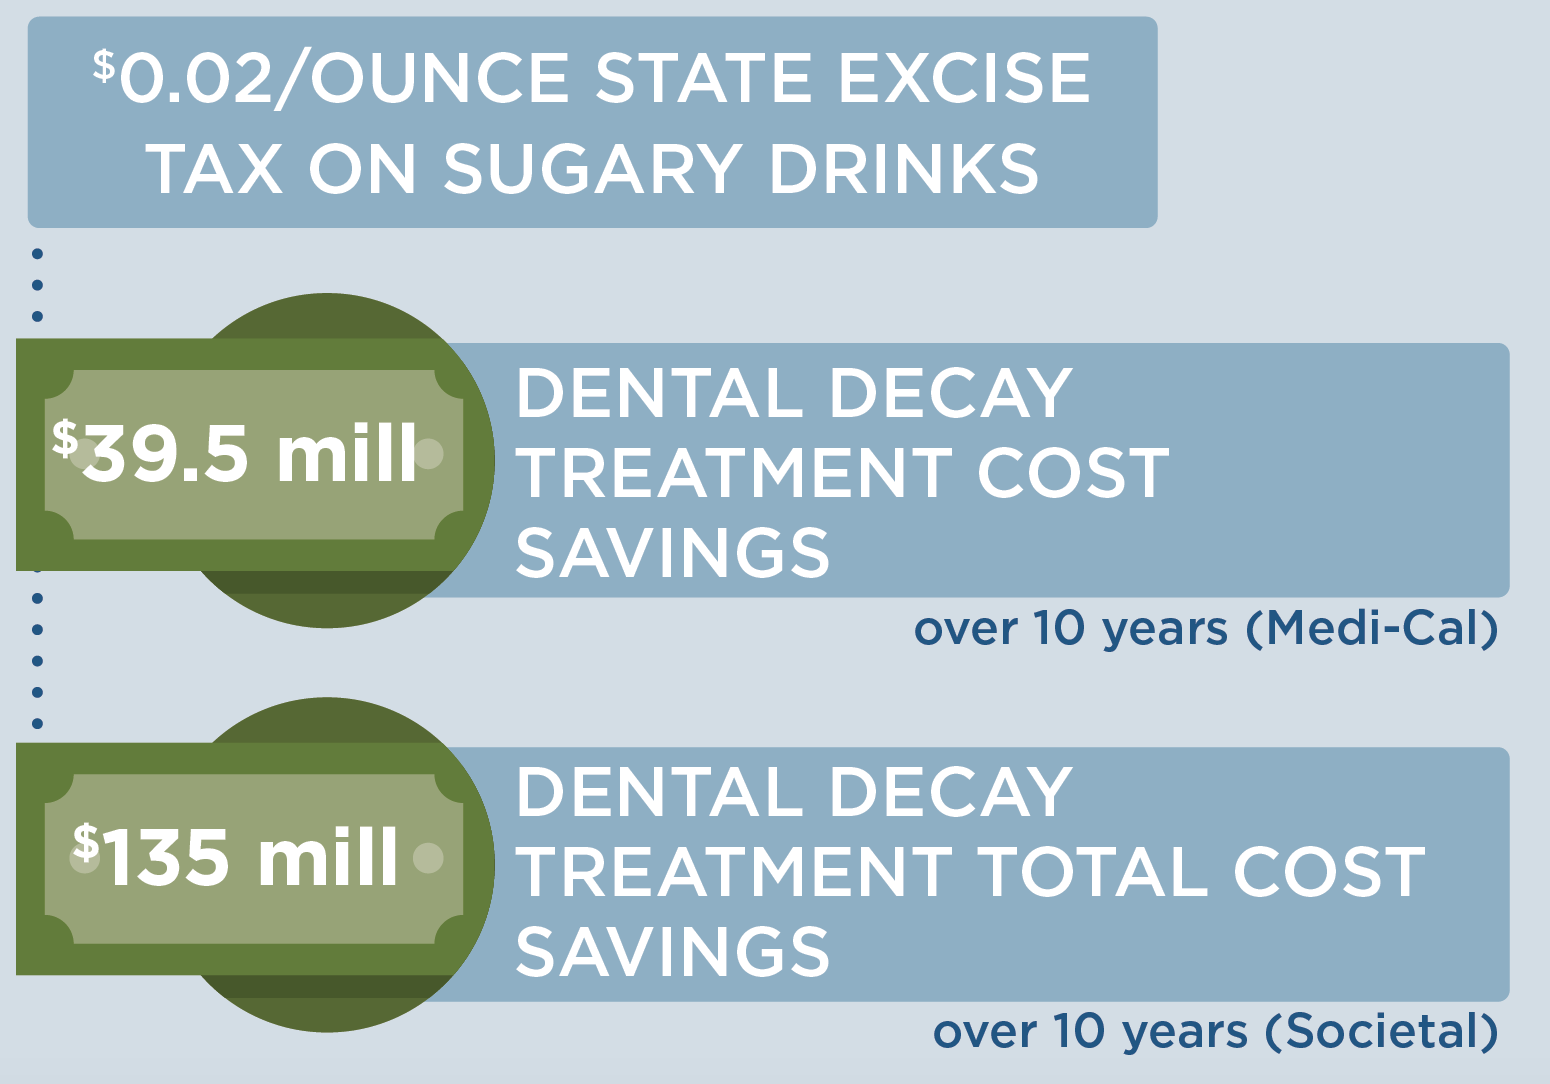
Impact on Tooth Decay
We estimated the impact of a sugary drink fee on tooth decay cost using a longitudinal analysis of the relationship between intake of sugars and tooth decay in adults. On average, for every 10 grams higher intake of sugar per day, there is an increase in decayed, missing, and filled teeth (i.e. tooth decay) of approximately 0.10 over 10 years.45 There are many studies showing a similar relationship between higher intake of sugars and tooth decay in children and youth46 and thus we assume the same relationship as found in adults.
We used 2018 Hawaii Department of Human Services Med-Quest procedure code47 data to estimate a Medicaid cost of treating tooth decay as: $234 for a permanent crown on Oahu or $562 on neighboring islands, and $39 for a filling on Oahu or $55 on neighboring islands. These codes reflect treatment for one surface and do not reflect higher reimbursement rates for multi-surface treatment, temporary crowns, or potential flat fee schedules. Based on analysis of data on tooth decay, fillings, and crowns for the U.S. population from NHANES 1988-1994 (the last year crowns and fillings were separately reported),48 we estimate that 78.9% of tooth decay in children and 43.5% of tooth decay in adults are treated. Using this same data set, we estimate that 97% of treatment for children is fillings and 82.5% of treatment for adults is fillings.
To estimate Medicaid-specific savings in costs of dental treatment, we used state estimates of the numbers of people enrolled in Medicaid and CHIP and the proportion receiving Medicaid dental services. Because of limited Medicaid dental coverage for adults in Hawaii, only children are included in the Medicaid-specific calculations. In Hawaii, we estimated that a $0.01/ounce fee would lead to a total of $173,000 in Medicaid savings over a period of 10 years due to a reduction in treatment of tooth decay. The Medicaid reimbursement fee estimates may underestimate the total cost savings of tooth decay treatment projected here as dental providers may charge higher amounts to patients.
Expected Yearly Sugary Drink Fee Revenue
The annual revenue from a state fee on sugary drinks is likely to be substantial. According to the Rudd Center Revenue Calculator for Sugary Drink Taxes49 a $0.01/ounce fee in Hawaii could raise as much as $42.9 million in 2020.
Actual fee revenue may be lower than these projected estimates due to several factors. The Rudd Center Revenue estimates are based on regional sales data adjusted for state or city specific demographics;50 sales data for specific states and/or cities within those regions may vary from the regional average. Retailers may have inventories of sugary drinks obtained before the fee was implemented. There may also be some distributors/manufacturers that are non-compliant with the fee. The Rudd Center notes that their revenue projections “should be adjusted downward by 10% – 30%.”49
|
Rudd Center Revenue Projections (2020) |
$0.01/oz fee on sugary drinks |
$0.02/oz fee on sugary drinks |
$0.03/oz fee on sugary drinks |
|
Assuming 100% of Rudd Center projections |
$42.9 million |
$65.8 million |
$68.8 million |
|
Assuming 90% of Rudd Center projections |
$38.6 million |
$59.2 million |
$62.0 million |
|
Assuming 70% of Rudd Center projections |
$30.0 million |
$46.1 million |
$48.2 million |
Considerations for Health Equity
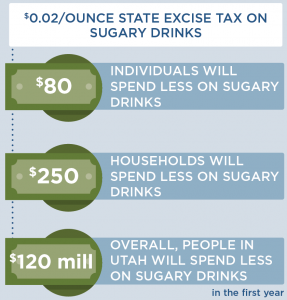
Concerns have been raised regarding the impact of the fee on households with low-income, because lower-income populations tend to consume more sugary drinks.12 Economic studies indicate that with a sugary drink tax, consumers will buy less of these products.29 This change in purchasing is substantial, so that consumers can be expected to spend less on sugary drinks after a fee is implemented. Using sales data from the Rudd Center Revenue Calculator for Sugary Drink Taxes,49 along with local price data,26,28 we project that individuals and households in Hawaii will spend less money on sugary drinks after a $0.02 per oz fee: about $104 less per year per person, and $314 per year less for an average household. This would free up disposable income for other consumer purchases. A typical consumer in Hawaii who continues to consume these beverages after the fee is in place would be expected to pay fees of about $2.50 per week, or $129/year.
In addition to these changes in spending, health benefits are projected to be greatest among low-income individuals. We project that more health benefits from this policy will accrue to low-income consumers; the same is true for a number of racial and ethnic groups. As noted above, in Hawaii, the percentage of adults who drink one or more soda per day varies by racial and ethnic group.7 Under the proposed fee, we project that Native Hawaiian, Other Pacific Islander, and Filipino Hawaii residents would see more cases of obesity prevented than expected for the average Hawaii resident. On that basis, the proposed fee should decrease disparities in obesity outcomes and improve health equity.
These expected changes in consumption and health outcomes have led economists to conclude that low-income populations benefit substantially from sugary drink taxes.51
|
Savings Per Year |
$0.01/oz fee on sugary drinks |
$0.02/oz fee on sugary drinks |
$0.03/oz fee on sugary drinks |
|
Individual savings on sugary drinks |
$36 |
$104 |
$203 |
|
Household savings on sugary drinks |
$109 |
$314 |
$614 |
|
Total Hawaii savings on sugary drinks |
$20.6 million |
$59.4 million |
$116 million |
Implementation Considerations
Revenue raised from a sugary drink fee can be reinvested in low-income communities. For instance, in Berkeley, CA, sugary drink fee revenue has been allocated for spending on school and community programs, many serving low-income populations or communities of color, to promote healthy eating and diabetes and obesity preventions.52 Public support for such fees generally increases with earmarking for preventive health activities.53
There is opposition from the food and beverage industry, which spends billions of dollars promoting their products.54 Relatively small beverage excise taxes are currently applied across many states. The proposed fee is likely to be sustainable if implemented based on the successful history of tobacco cigarette stamp excise taxes. There is potential for a shift in social norms of sugary drink consumption based on evidence from tobacco control tax and regulatory efforts.55 This shift in norms can be facilitated by assessing sugary drinks, which reduces the attractiveness of non-caloric beverages and discourages consumers from selecting any sugary drink options when making beverage decisions.
Conclusion
We project that the proposed fee policy will prevent thousands of cases of childhood and adult obesity, prevent new cases of diabetes, increase healthy life years, and save more in future health care costs than it costs to implement. Savings in future health care costs would lead to a slowing of rising health care premium costs for employers and individuals across Hawaii. Revenue from the fee can be used for education and health promotion efforts. Implementing the fee could also serve as a powerful social signal to reduce sugar consumption.
Citation
Irvin L, Inoue K, Bowie A, Ching L, Starr R, Ryan J, White BS, La Chica T, Gortmaker SL, Long MW, Ward ZJ, Giles CM, Barrett JL, Resch SC, Greatsinger A, Garrone ME, Tao H, Flax CN, Cradock AL. Hawaii: Sugary Drink Fee [Report]. Hawaii Department of Health, Hawaii Public Health Institute, Honolulu, HI, and the CHOICES Learning Collaborative Partnership at the Harvard T.H. Chan School of Public Health, Boston, MA; March 2021. For more information, please visit www.choicesproject.org
The design for this report and its graphics were developed by Molly Garrone, MA and partners at Burness.
Funding
Funded by The JPB Foundation. Results are those of the authors and not the funders.
For further information, contact choicesproject@hsph.harvard.edu
Appendices
Results for additional fee rates can be found in Appendix 1 ($0.02/ounce fee) and Appendix 2 ($0.03/ounce fee). Please see pages 15 and 16 in the PDF of the report.
References
- American Public Health Association Taxes on Sugar-Sweetened Beverages. 2012.
- Falbe J, Rojas N, Grummon AH, Madsen KA. Higher Retail Prices of Sugar-Sweetened Beverages 3 Months After Implementation of an Excise Tax in Berkeley, California. American Journal of Public Health. 2015;105(11):2194-2201.
- World Health Organization. Global action plan for the prevention and control of noncommunicable diseases 2013–2020 [Internet]. Geneva: WHO. Updated appendix 3, “Best buys” and other recommended interventions for the prevention and control of noncommunicable diseases; [updated 2017; cited 2019 Sep 17]. Available from: http://www.who.int/ncds/management/WHO_Appendix_BestBuys.pdf
- Kit BK, Fakhouri THI, Park S, Nielsen SJ, Ogden CL. Trends in sugar-sweetened beverage consumption among youth and adults in the United States: 1999-2010. American Journal of Clinical Nutrition. 2013;98(1):180-188.
- Bleich SN, Vercammen KA, Koma JW, Li ZH. Trends in Beverage Consumption Among Children and Adults, 2003-2014. Obesity. 2018;26(2):432-441.
- Vercammen KA, Moran AJ, Soto MJ, Kennedy-Shaffer L, Bleich SN (2020). Decreasing Trends in Heavy Sugar-Sweetened Beverage Consumption in the United States, 2003-2016. Journal of the Academy of Nutrition and Dietetics. 2020 Dec;120(12):1974-1985.e5.
- Hawaii Health Data Warehouse, Hawaii State Department of Health. Behavioral Risk Factor Surveillance System. 2017.
- Hawaii Health Data Warehouse, State of Hawaii. Hawaii School Health Survey: Youth Risk Behavior Survey Module. 2017.
- Hawaii State Department of Health. (2013). State Department of Health Releases Data on Teen-Focused Obesity Prevention Campaign [Press release]. Retrieved from http://health.hawaii.gov/news/files/2013/05/13-063-DOH-Releases-Data-on-Teen-Focused-Obesity-Prevention-Campaign.pdf
- Hawaii Health Data Warehouse, Hawaii State Department of Health. Behavioral Risk Factor Surveillance System. 2011-2016.
- Yancey AK, Cole BL, Brown R, et al. A cross-sectional prevalence study of ethnically targeted and general audience outdoor obesity-related advertising. Milbank Quarterly. 2009;87(1):155-184.
- Han E, Powell LM. Consumption patterns of sugar-sweetened beverages in the United States. Journal of the Academy of Nutrition and Dietetics. 2013;113(1):43-53.
- Malik VS, Pan A, Willett WC, Hu FB. Sugar-sweetened beverages and weight gain in children and adults: a systematic review and meta-analysis. American Journal of Clinical Nutrition. 2013;98(4):1084-1102.
- Chen L, Caballero B, Mitchell DC, et al. Reducing Consumption of Sugar-Sweetened Beverages Is Associated with Reduced Blood Pressure: A Prospective Study among U.S. Adults. Circulation. 2010;121(22):2398-2406.
- U.S. Department of Health and Human Services, U.S. Department of Agriculture. 2020 – 2025 Dietary Guidelines for Americans. December 2020.
- IOM (Institute of Medicine), National Research Council. Local Government Actions to Prevent Childhood Obesity. Washington, DC: The National Academies Press; 2009.
- Chaloupka F, Powell L, Chriqui J. Sugar-sweetened beverage taxes and public health: A Research Brief. Minneapolis, MN2009.
- Brownell KD, Farley T, Willett WC, et al. The Public Health and Economic Benefits of Taxing Sugar-Sweetened Beverages. New England Journal of Medicine. 2009;361(16):1599-1605.
- Long M, Gortmaker S, Ward Z, et al. Cost Effectiveness of a Sugar-Sweetened Beverage Excise Tax in the U.S. American Journal of Preventive Medicine. 2015;49(1):112-123.
- Gortmaker SL, Wang YC, Long MW, et al. Three Interventions That Reduce Childhood Obesity Are Projected To Save More Than They Cost To Implement. Health Affairs. 2015;34(11):1932-1939.
- Health Care Concerns. Honolulu Star-Advertiser. Jan 14, 2018.
- New Poll Shows Strong Support For Policies That Reduce Sugary Drink Consumption by Keiki [press release]. 2018.
- Colchero MA, Salgado JC, Unar-Munguia M, Molina M, Ng SW, Rivera-Dommarco JA. Changes in Prices After an Excise Tax to Sweetened Sugar Beverages Was Implemented in Mexico: Evidence from Urban Areas. PLOS One. 2015;10(12):11.
- Falbe J, Thompson HR, Becker CM, Rojas N, McCulloch CE, Madsen KA. Impact of the Berkeley Excise Tax on Sugar-Sweetened Beverage Consumption. American Journal of Public Health. 2016;106(10):1865-1871.
- Ng S, Silver L, Ryan-Ibarra S, et al. Berkeley Evaluation of Soda Tax (BEST) Study Preliminary Findings. Presentation at the annual meeting of the American Public Health Association. Paper presented at: Presentation at the annual meeting of the American Public Health Association; November, 2015; Chicago, IL.
- Powell L, Isgor z, Rimkus L, Chaloupka F. Sugar-sweetened beverage prices: Estimates from a national sample of food outlets. Chicago, IL: Bridging the Gap Program, Health Policy Center, Institute for Health Research and Policy, University of Illinois at Chicago; 2014.
- Centers for Disease Control and Prevention (CDC), Hawaii State Department of Health. Hawaii Behavioral Risk Factor Surveillance System Survey Data. Atlanta, Georgia: U.S Department of Health and Human Services, National Center for Chronic Disease Prevention and Health Promotion, Division of Population Health; 2014.
- Hawaii State Department of Health, personal communication, 2018.
- Powell LM, Chriqui JF, Khan T, Wada R, Chaloupka FJ. Assessing the Potential Effectiveness of Food and Beverage Taxes and Subsidies for Improving Public Health: A Systematic Review of Prices, Demand and Body Weight Outcomes. Obesity Reviews. 2013;14(2):110-128.
- Cawley J, Frisvold D, Hill A, Jones D. The impact of the Philadelphia beverage tax on purchases and consumption by adults and children. Journal of Health Economics. 2019;67:102225.
- Lee MM, Falbe J, Schillinger D, Basu S, McCulloch CE, Madsen KA. Sugar-Sweetened Beverage Consumption 3 Years After the Berkeley, California, Sugar-Sweetened Beverage Tax. American Journal of Public Health. 2019;109(4):637-639.
- Zhong Y, Auchincloss AH, Lee BK, Kanter GP. The Short-Term Impacts of the Philadelphia Beverage Tax on Beverage Consumption. American Journal of Preventive Medicine. 2018;55(1):26-34.
- Silver LD, Ng SW, Ryan-Ibarra S, et al. Changes in prices, sales, consumer spending, and beverage consumption one year after a tax on sugar-sweetened beverages in Berkeley, California, US: A before-and-after study. PLoS Medicine. 2017;14(4):e1002283
- Mozaffarian D, Hao T, Rimm EB, Willett WC, Hu FB. Changes in Diet and Lifestyle and Long-Term Weight Gain in Women and Men. New England Journal of Medicine. 2011;364(25):2392-2404.
- Palmer JR, Boggs DA, Krishnan S, Hu FB, Singer M, Rosenberg L. Sugar-Sweetened Beverages and Incidence of Type 2 Diabetes Mellitus in African American Women. Archives of Internal Medicine. 2008;168(14):1487-1492.
- Schulze MB, Manson JE, Ludwig DS, et al. Sugar-sweetened beverages, weight gain, and incidence of type 2 diabetes in young and middle-aged women. Journal of the American Medical Association. 2004;292(8):927-934.
- de Ruyter JC, Olthof MR, Seidell JC, Katan MB. A trial of sugar-free or sugar-sweetened beverages and body weight in children. New England Journal of Medicine. 2012;367(15):1397-1406.
- Healthy Food America. Implementing Sugary Drink Taxes: Outreach, Collection, and Fighting Industry Litigation. [Webinar]. 2017; http://www.healthyfoodamerica.org/webinars
- Ward ZJ, Long MW, Resch SC, Giles CM, Cradock AL, Gortmaker SL. Simulation of Growth Trajectories of Childhood Obesity into Adulthood. New England Journal of Medicine. 2017;377(22):2145-2153.
- Ward ZJ, Long MW, Resch SC, et al. Redrawing the US Obesity Landscape: Bias-Corrected Estimates of State-Specific Adult Obesity Prevalence. PLoS One. 2016;11(3):13.
- Long MW, Ward Z, Resch SC, et al. State-level estimates of childhood obesity prevalence in the United States corrected for report bias. International Journal of Obesity. 2016;40(10):1523-1528.
- Imamura F, O’Connor L, Ye Z, Mursu J, Hayashino Y, Bhupathiraju SN, Forouhi NG. Consumption of sugar sweetened beverages, artificially sweetened beverages, and fruit juice and incidence of type 2 diabetes. British Journal of Sports Medicine. 2016 Apr;50(8):496-504
- Hawaii Department of Health, 2011-2016 Hawaii Behavioral Risk Factor Surveillance System (BRFSS), personal communication, 2018.
- Hawaii Department of Health, Hawaii Health Data Warehouse, Behavioral Risk Factor Surveillance System (BRFSS), 2011-2014.
- Bernabe E, Vehkalahti MM, Sheiham A, Lundqvist A, Suominen AL. The Shape of the Dose-Response Relationship between Sugars and Caries in Adults. Journal of Dental Research. 2016;95(2):167-172.
- Sheiham A, James WPT. A new understanding of the relationship between sugars, dental caries and fluoride use: implications for limits on sugars consumption. Public Health Nutrition. 2014;17(10):2176-2184.
- Hawaii Department of Human Services. Dental Fee Schedule. 2018.
- Ward Z, et al. NHANES III Dental Examination: An Incisive Report. Unpublished report; 2018.
- UConn Rudd Center for Food Policy & Obesity. Sugary Drink Tax Calculator. https://uconnruddcenter.org/tax-calculator. Accessed February 2021.
- UCONN Rudd Center. Data and Assumptions (Tax Calculator Revision, March 2017). 2017.
- Allcott H, Lockwood BB, Taubinsky D. Should We Tax Sugar-Sweetened Beverages? An Overview of Theory and Evidence. Journal of Economic Perspectives. 2019; 33 no 3: 202–27.
- Lynn J. City Council votes to allocate ‘soda tax’ revenue to school district, city organizations. The Daily Californian. Jan. 20, 2016.
- Friedman R. Public Opinion Data, 2013. In. New Haven, CT: Yale Rudd Center for Food Policy & Obesity; 2013.
- Federal Trade Commission. A review of food marketing to children and adolescents: follow-up report. Washington, DC Dec 2012.
- Frieden TR, Mostashari F, Kerker BD, Miller N, Hajat A, Frankel M. Adult tobacco use levels after intensive tobacco control measures: New York City, 2002-2003. American Journal of Public Health. 2005;95(6):1016-1023.


 Since the cost of a sugary drink excise tax is incorporated directly into the beverage’s sticker price, an excise tax will likely influence consumer purchasing decisions more than a comparable sales tax that is added onto the item at the register. We assume 100% pass-through of the tax over 10 years and assume the tax rate would be adjusted annually for inflation. Our pass-through rate estimate is supported by empirical studies of excise taxes in Mexico and France that demonstrate near-complete pass-through rates to consumers.23 Short term studies for the local tax in Berkeley, CA indicate imperfect (or less than 100%) pass-through.3,24,25 More recent analyses from Philadelphia, PA indicate that over all the sales studied, pass-through was close to complete. The pass-through seen in pharmacies was higher than in supermarkets and mass merchandise settings.26 The expected change in sugary drink price was estimated using an average of $0.06/ounce based on national sugary drink prices.27 The price per ounce in this study was based on a weighted average of sugary drink consumption across stores, restaurants, and other sources according to the estimates from the National Health and Nutrition Examination Survey (NHANES) 2009-2010. The price per ounce of sugary drinks purchased in stores was calculated using weighted averages of two-liter bottles, 12-can cases, and single-serve containers based on 2010 Nielsen Homescan data.27 For example, a $0.02/ounce tax would raise the price of a 12-ounce can of soda from $0.72 to $0.96/can post-tax.
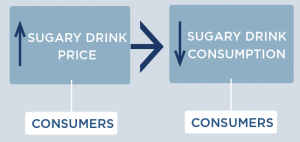 How does increasing the price of sugary drinks change individual sugary drink consumption?
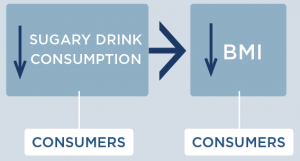

 Since the cost of a sugary drink excise tax is incorporated directly into the beverage’s sticker price, an excise tax will likely influence consumer purchasing decisions more than a comparable sales tax that is added onto the item at the register. We assume 100% pass-through of the tax over 10 years and assume the tax rate would be adjusted annually for inflation. Our pass-through rate estimate is supported by empirical studies of excise taxes in Mexico and France that demonstrate near-complete pass through rates to consumers.24 Short term studies for the local tax in Berkeley indicate imperfect, or less than 100%, pass-through.3,25,26 The expected change in sugary drink price was estimated using an average of $0.06/ounce based on national sugary drink prices.27 The price per ounce in this study was based on a weighted average of sugary drink consumption across stores, restaurants and other sources according to the estimates from the National Health and Nutrition Examination Survey (NHANES) 2009-2010. The price per ounce of sugary drinks purchased in stores was calculated using weighted averages of two-liter bottles, 12-can cases, and single-serve containers based on 2010 Nielsen Homescan data.27 For example, a $0.02/ounce tax would raise the price of a 12-ounce can of soda from $0.72 to $0.96/can post-tax.
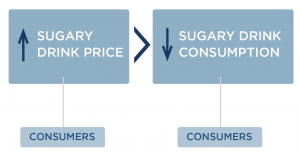 How does an excise tax on distributors affect the price paid by consumers?
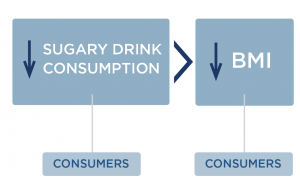

 Sugary drinks include all beverages with added caloric sweeteners. The modeled excise tax does not apply to 100% juice, milk products, or artificially-sweetened beverages. Although sugary drinks consumption has declined in recent years, adolescents and young adults in the United States consume more sugar than the Dietary Guidelines for Americans recommend, with persistent racial/ethnic disparities.5-8 Randomized trials and longitudinal studies have linked sugary drinks consumption to excess weight gain, diabetes, and cardiovascular disease. Consumption of sugary drinks increases the risk of chronic diseases through its impact on weight and other mechanisms.9,10 The Dietary Guidelines for Americans, 2015-202011 recommend that individuals reduce sugary drink intake in order to manage their body weight. Drawing on the success of tobacco taxation and decades of economic research, public health experts have studied taxes on sugary drinks and documented their likely impact.12-15 In 2009, the IOM recommended that local governments implement tax strategies to reduce consumption of “calorie-dense, nutrient-poor foods,” emphasizing sugary drinks as an appropriate target for taxation.16