The information in this resource is intended only to provide educational information. This profile describes the estimated benefits, activities, resources, and leadership needed to implement a strategy to improve child health. This information can be useful for planning and prioritization purposes.
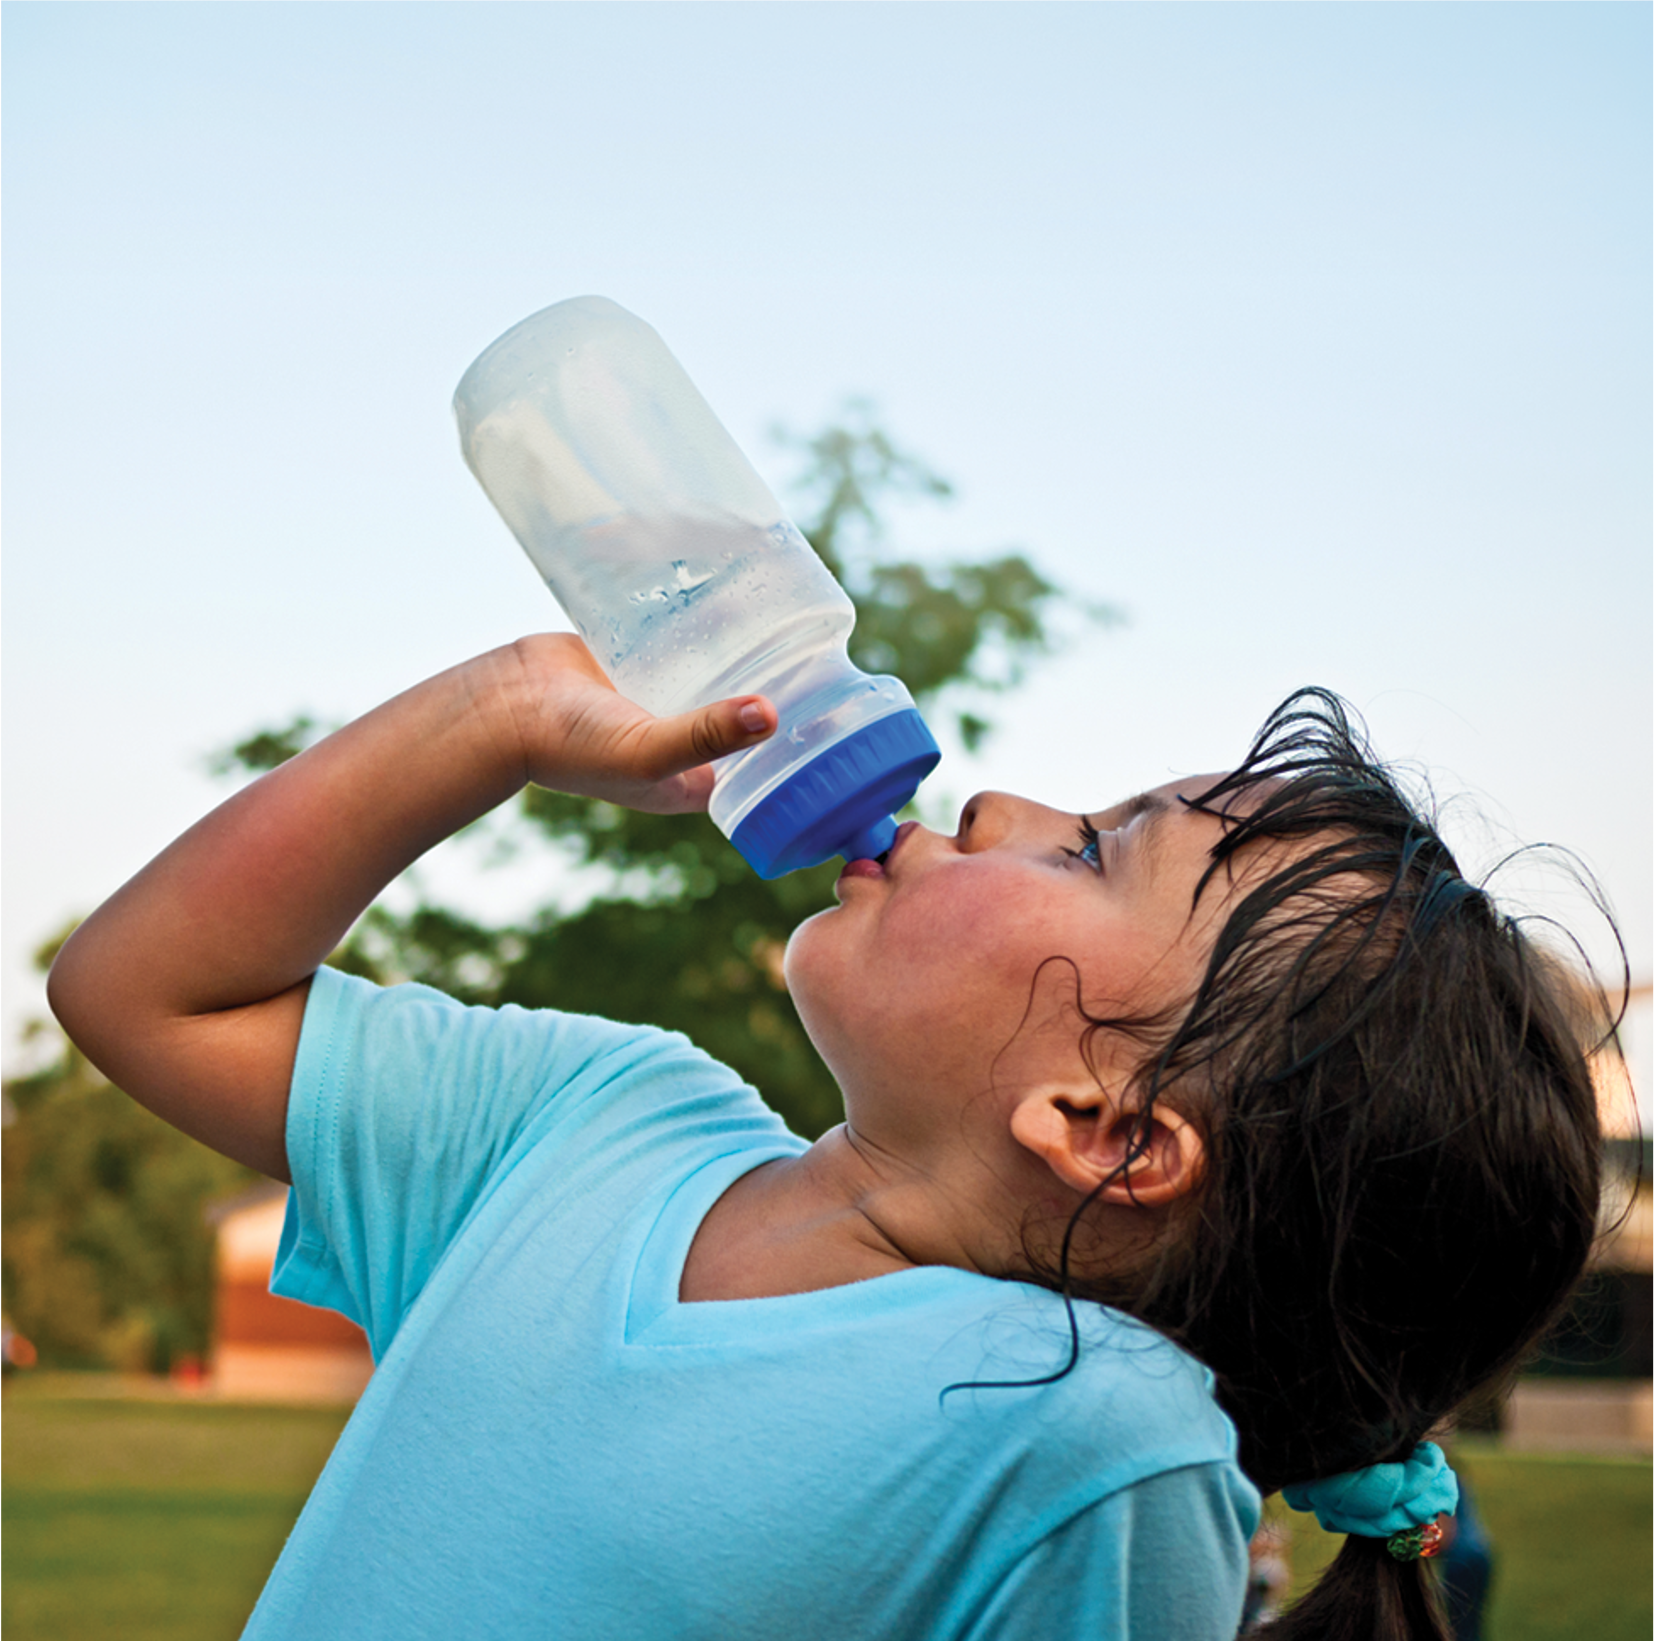
- Creating healthier afterschool environments is a strategy to improve nutrition and physical activity policies & practices through the Out of School Nutrition and Physical Activity (OSNAP) initiative for children in grades K-5 attending state-administered 21st Century Learning afterschool programs.
What population benefits?
Children in grades K-5 attending state-administered 21st Century Learning afterschool programs.
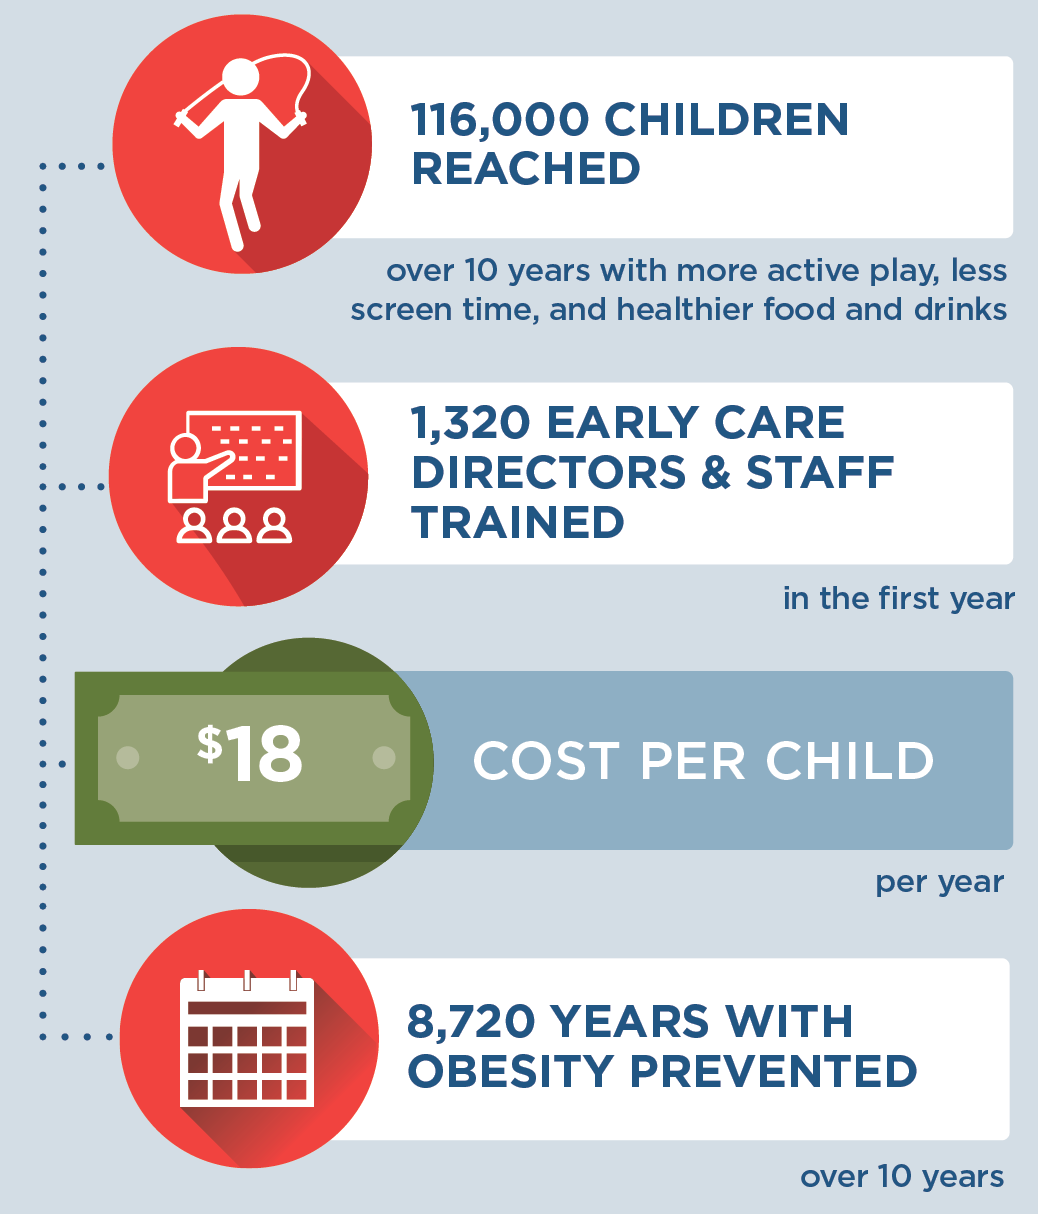
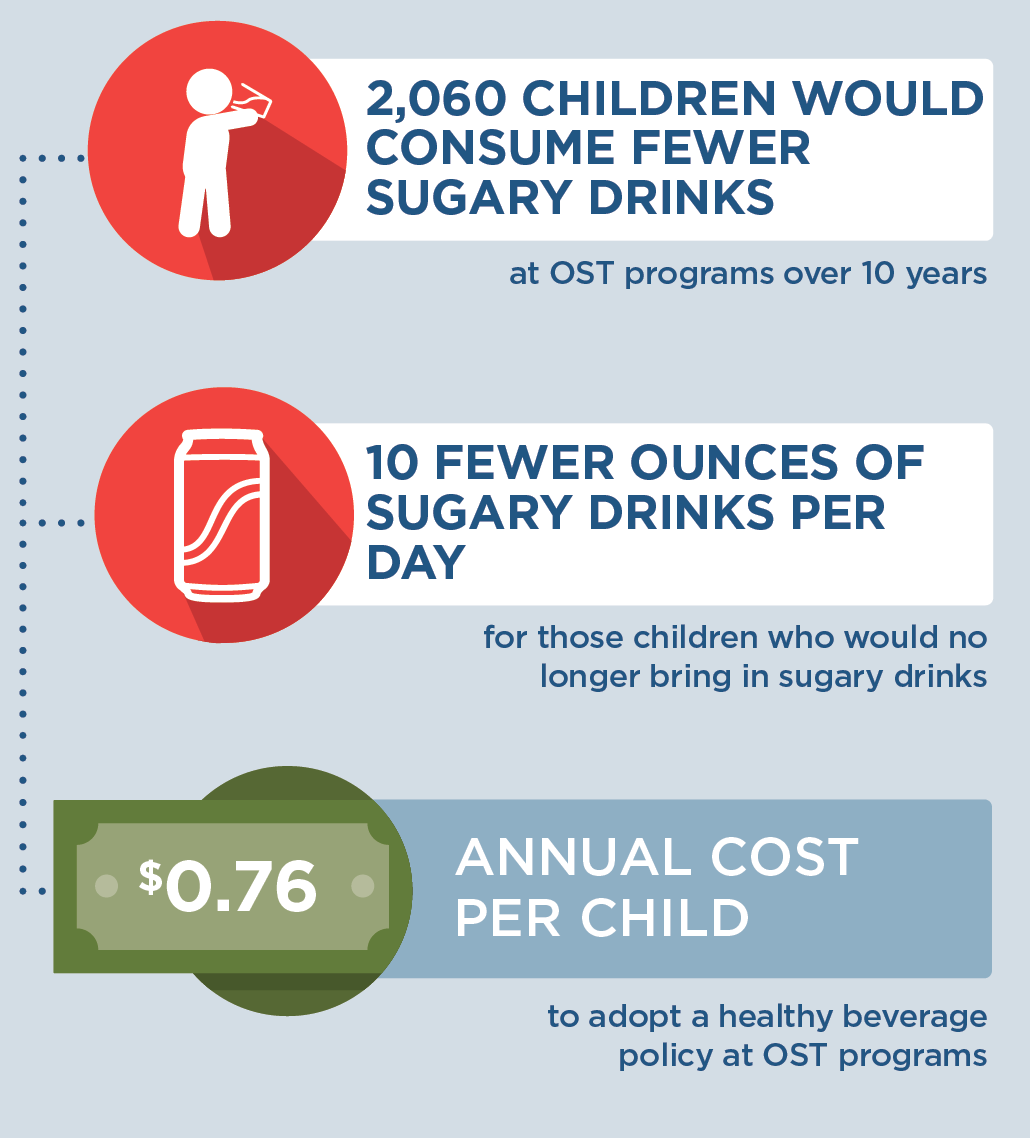
What are the estimated benefits?
Relative to not implementing the strategy
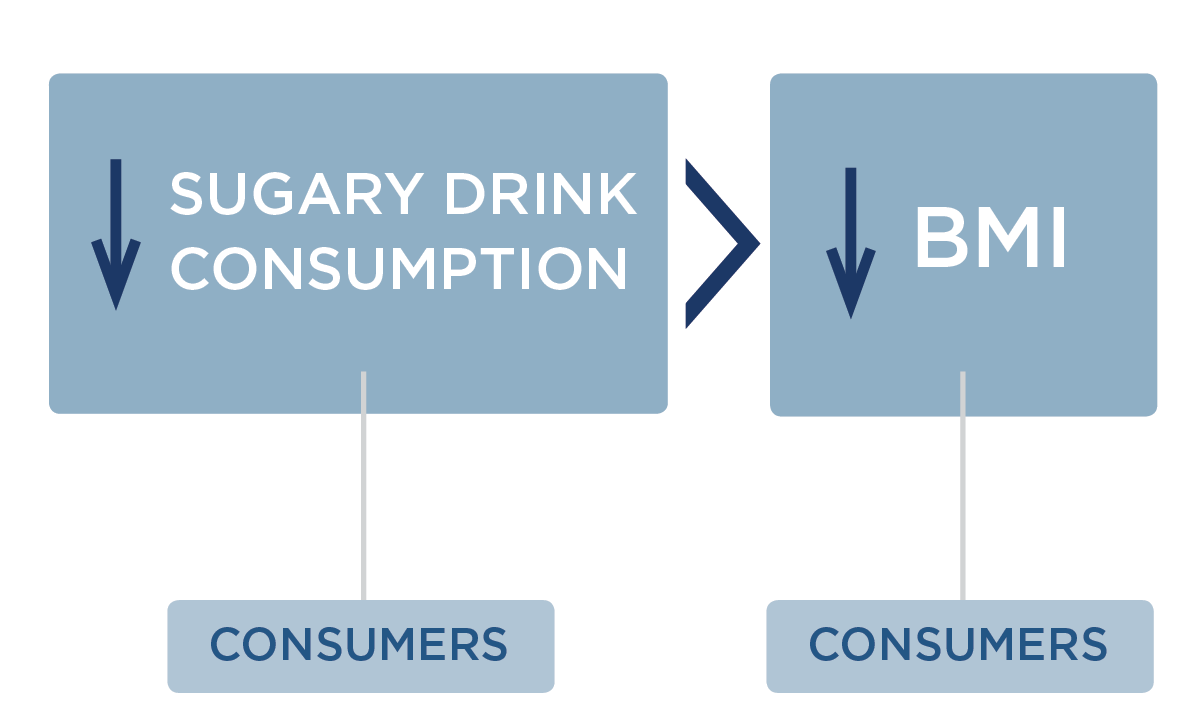
Increase vigorous physical activity and improve nutritional quality of snacks and beverages offered in afterschool programs, and, in turn, promote healthy child weight.
What activities and resources are needed?
| Activities | Resources | Who Leads? |
| Issue regulations to improve nutrition and physical activity policies and practices in afterschool programs | • Time to issue and communicate regulations | State government |
| Provide training and technical assistance to regional Healthy Afterschool trainers on how to lead learning collaborative sessions | • Time for state Healthy Afterschool coordinator to lead trainings • Time for regional Healthy Afterschool trainers to be trained and receive technical assistance • Travel costs • Training material costs |
State healthy afterschool coordinator |
| Conduct regional learning collaboratives with afterschool program staff including training and technical assistance on goals and implementation activities | • Time for regional Healthy Afterschool trainers to lead learning collaboratives and provide technical assistance • Time for afterschool program staff to attend learning collaboratives and receive technical assistance • Training material costs • Travel costs |
Regional healthy afterschool trainer |
| Assess and implement actions to change program practices to meet Healthy Afterschool standards | • Time for afterschool program staff to conduct program practice self-assessments and implement changes at their program • Increase in food costs to provide snacks in compliance with nutrition standards to children attending Healthy Afterschool programs |
Afterschool program director |
| Develop CEU-accredited course for local program staff | • Cost to create a CEU-accredited course | State healthy afterschool coordinator |
| Provide educational materials and incentives to local program staff | • Material and incentive costs | State government |
| Monitor compliance to ensure afterschool programs are following programmatic requirements | • Time for state monitoring and compliance staff to monitor compliance • Travel costs |
State government monitoring and compliance staff |
| Establish a Healthy Afterschool recognition and monitoring website | • Time to create and maintain website | State government website developer |
Strategy Modification
This strategy could be modified to benefit children who participate in out-of-school programs administered by other organizations (e.g., YMCA or Boys and Girls Club of America). With this modification, the activities necessary to carry out the voluntary recognition program may not be included (e.g., issuing regulations, creating a healthy afterschool nutrition website, and monitoring compliance). With this modification, the impact on health is expected to be similar, and the impact on reach and cost may vary.
FOR ADDITIONAL INFORMATION
Cradock AL, Barrett JL, Kenney EL, Giles CM, Ward ZJ, Long MW, Resch SC, Pipito AA, Wei ER, Gortmaker SL. Using cost-effectiveness analysis to prioritize policy and programmatic approaches to physical activity promotion and obesity prevention in childhood. Prev Med. 2017 Feb;95 Suppl: S17-S27. doi: 10.1016/j.ypmed.2016.10.017. Supplemental Appendix with strategy details available at: https://ars.els-cdn.com/ content/image/1-s2.0-S0091743516303395-mmc1.docx
- Browse more CHOICES research briefs & reports in the CHOICES Resource Library.
- Explore and compare this strategy with other strategies on the CHOICES National Action Kit.
Suggested Citation
CHOICES Strategy Profile: Creating Healthier Afterschool Environments. CHOICES Project Team at the Harvard T.H. Chan School of Public Health, Boston, MA; May 2023.
Funding
This work is supported by The JPB Foundation and the Centers for Disease Control and Prevention (U48DP006376). The information provided here is intended to be used for educational purposes. Links to other resources and websites are intended to provide additional information aligned with this educational purpose. The findings and conclusions are those of the author(s) and do not necessarily represent the official position of the Centers for Disease Control and Prevention or other funders.
Adapted from the TIDieR (Template for Intervention Description and Replication) Checklist