
The information in this brief is intended for educational use only.
This brief summarizes the CHOICES Learning Collaborative Partnership simulation model of the impact of integrating the Nutrition and Physical Activity Self-Assessment for Child Care (NAP SACC) program into Oklahoma’s Reaching for the Stars Quality Rating and Improvement System. Child care programs achieving Level 2 or higher would complete NAP SACC.
The Issue
Over the past three decades, more and more people have developed obesity.1 Today, nearly nine percent of 2-5 year olds have obesity.2 Now labeled as an epidemic, health care costs for treating obesity-related health conditions such as heart disease and diabetes were $147 billion in 2008.3 While multiple strategies are needed to reverse the epidemic, emerging prevention strategies directed at children show great promise.4 A large body of evidence shows that healthy eating, physical activity, and limited time watching TV helps kids grow up at a healthy weight.
In Oklahoma, 41% of 2-5 year olds attend a licensed child care center or family child care home, and most of them attend a program involved in Reaching for the Stars.5 Child care programs can offer healthy, nurturing environments for children; Reaching for the Stars can encourage and empower programs to voluntarily improve nutrition, physical activity, and screen time standards.
About NAP SACC and Reaching for the Stars
NAP SACC is an evidence-based, trusted intervention for helping child care programs improve their practices regarding nutrition, active play, and screen time and has demonstrated impacts on reducing childhood obesity.6,7 In NAP SACC, child care directors complete self-assessments of their nutrition, active play, and screen time practices and receive training and technical assistance to implement changes that create healthier environments. Integrating NAP SACC into Reaching for the Stars would incentivize and support participation in the program and broaden its availability.
Comparing Costs and Outcomes
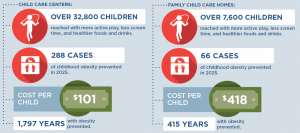
CHOICES cost-effectiveness analysis compared the costs and outcomes of integrating NAP SACC into Reaching for the Stars over 10 years with costs and outcomes associated with not implementing the program. This model assumes that 67% of OK children in child care centers and 36% in family child care homes attend a program at Level 2 or higher in Reaching for the Stars and thus will benefit. The model also accounts for swapping out some existing childhood obesity trainings for NAP SACC, making NAP SACC implementation a less costly approach.
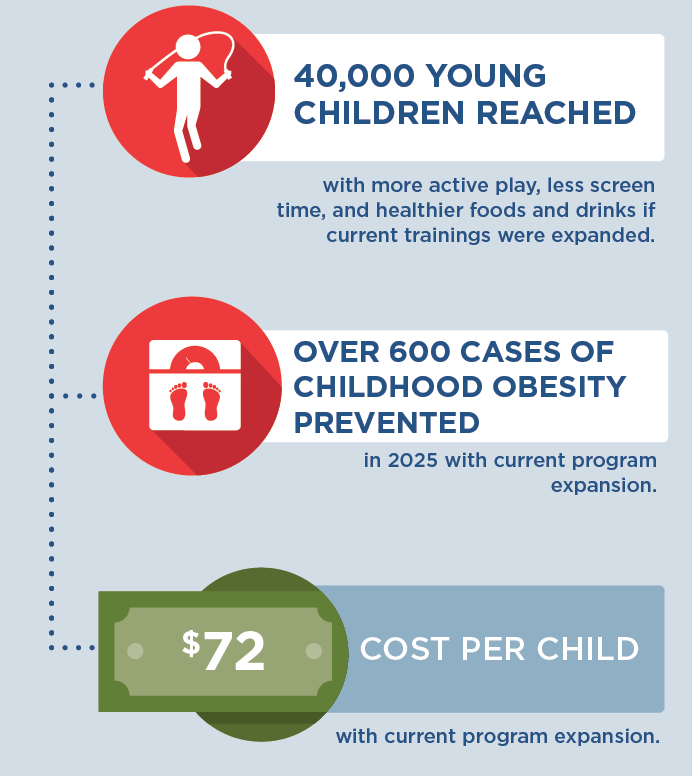
Implementing NAP SACC in child care programs throughout Oklahoma is an investment in the future. By the end of 2025: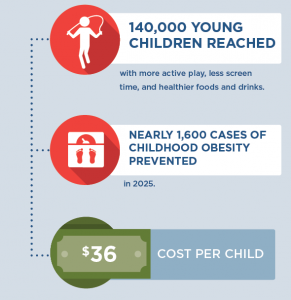 |
Conclusions and Implications
Every child deserves a healthy start in life. This includes ensuring that all kids in child care have opportunities to eat healthy foods and be physically active, no matter where they live or where they go for child care. A state-level initiative to bring NAP SACC to Oklahoma’s child care programs through Reaching for the Stars could prevent almost 1,600 cases of childhood obesity in 2025 and ensure healthy child care environments for 140,000 of Oklahoma’s young children.
For every $1.00 spent on implementing NAP SACC in Reaching for the Stars, we would save $0.15 in health care costs. These results reinforce the importance of investing in prevention efforts, relative to other treatment interventions, to reduce the prevalence of obesity. Shortchanging prevention efforts can lead to more costly and complicated treatment options in the future, whereas introducing small changes to young children can help them develop healthy habits for life.
Evidence is growing about how to help children achieve a healthy weight. Programs such as NAP SACC are laying the foundation for a healthier future by helping child care providers create environments that nurture healthy habits. Leaders at the federal, state, and local level should use the best available evidence to determine which evidence-based programs and policies hold the most promise to help children eat healthier diets and be more active.
References
- Flegal KM, Kruszon-Moran D, Carroll MD, Fryar CD, Ogden CL. Trends in Obesity Among Adults in the United States, 2005 to 2014. JAMA. 2016 Jun 7;315(21):2284-91.
- Ogden CL, Carroll MD, Lawman HG, Fryar CD, Kruszon-Moran D, Kit BK, Flegal KM. Trends in obesity prevalence among children and adolescents in the United States, 1988-1994 through 2013-2014. JAMA. 2016 Jun 7;315(21):2292-9.
- Finkelstein EA, Trogdon JG, Cohen JW, Dietz W. Annual Medical Spending Attributable To Obesity: Payer-And Service-Specific Estimates. Health Affairs. 2009;28(5).
- Gortmaker SL, Wang YC, Long MW, Giles CM, Ward ZJ, Barrett JL, Kenney EL, Sonneville KR, Afzal AS, Resch SC, Cradock AL. Three interventions that reduce childhood obesity are projected to save more than they cost to implement. Health Aff (Millwood). 2015 Nov;34(11):1932-9.
- Oklahoma Department of Health Services (DHS). Early Care & Education Licensing Database (2016)
- Ward DS, Benjamin SE, Ammerman AS, Ball SC, Neelon BH, Bangdiwala SI. Nutrition and physical activity in child care: results from an environmental intervention. Am J Prev Med. 2008 Oct;35(4):352-6.
- Alkon A, Crowley AA, Neelon SE, Hill S, Pan Y, Nguyen V, Rose R, Savage E, Forestieri N, Shipman L, Kotch JB. Nutrition and physical activity randomized control trial in child care centers improves knowledge, policies, and children’s body mass index. BMC Public Health. 2014 Mar 1;14:215.
Suggested Citation:Macedo C, Case S, Simpson K, Khan F, U’ren S, Giles CM, Flax CN, Cradock AL, Gortmaker SL, Ward ZJ, Kenney EL. Oklahoma: Nutrition and Physical Activity Self-Assessment For Child Care (NAP SACC) Intervention {Issue Brief}. Oklahoma State Department of Health and Oklahoma State Department of Human Services, Oklahoma City, OK, and the CHOICES Learning Collaborative Partnership at the Harvard T.H. Chan School of Public Health, Boston, MA; October 2017. |
The design for this brief and its graphics were developed by Molly Garrone, MA and partners at Burness.
This issue brief was developed at the Harvard T.H. Chan School of Public Health in collaboration with the Oklahoma Department of Health and Human Services through participation in the Childhood Obesity Intervention Cost-Effectiveness Study (CHOICES) Learning Collaborative Partnership. This brief is intended for educational use only. Funded by The JPB Foundation. Results are those of the authors and not the funders.


 Though national guidelines from the U.S. Department of Health and Human Services (2008) recommend that both children and adolescents participate in 60 minutes or more of moderate to vigorous physical activity (MVPA) per day, many in this age group throughout the U.S. do not meet this standard. A variety of interventions can increase physical activity among youth, but implementation can be challenging for decision makers who have limited resources and implementation guidance.
 Upon visiting an elementary school physical education (PE) class, you would expect to find children engaged in exercise. In reality, the typical PE class in the US may not be so active. While most elementary schools do require some PE, students on average spend less than half of class time engaged in moderate-to-vigorous physical activity (MVPA). Additionally, PE activity levels are lower when more class time is spent organizing students or reviewing rules and techniques, and when PE classes are led by classroom teachers instead of trained PE specialists.