A research brief detailing which strategies provide the most value for money spent to reduce early childhood obesity.
Topic: Active Living
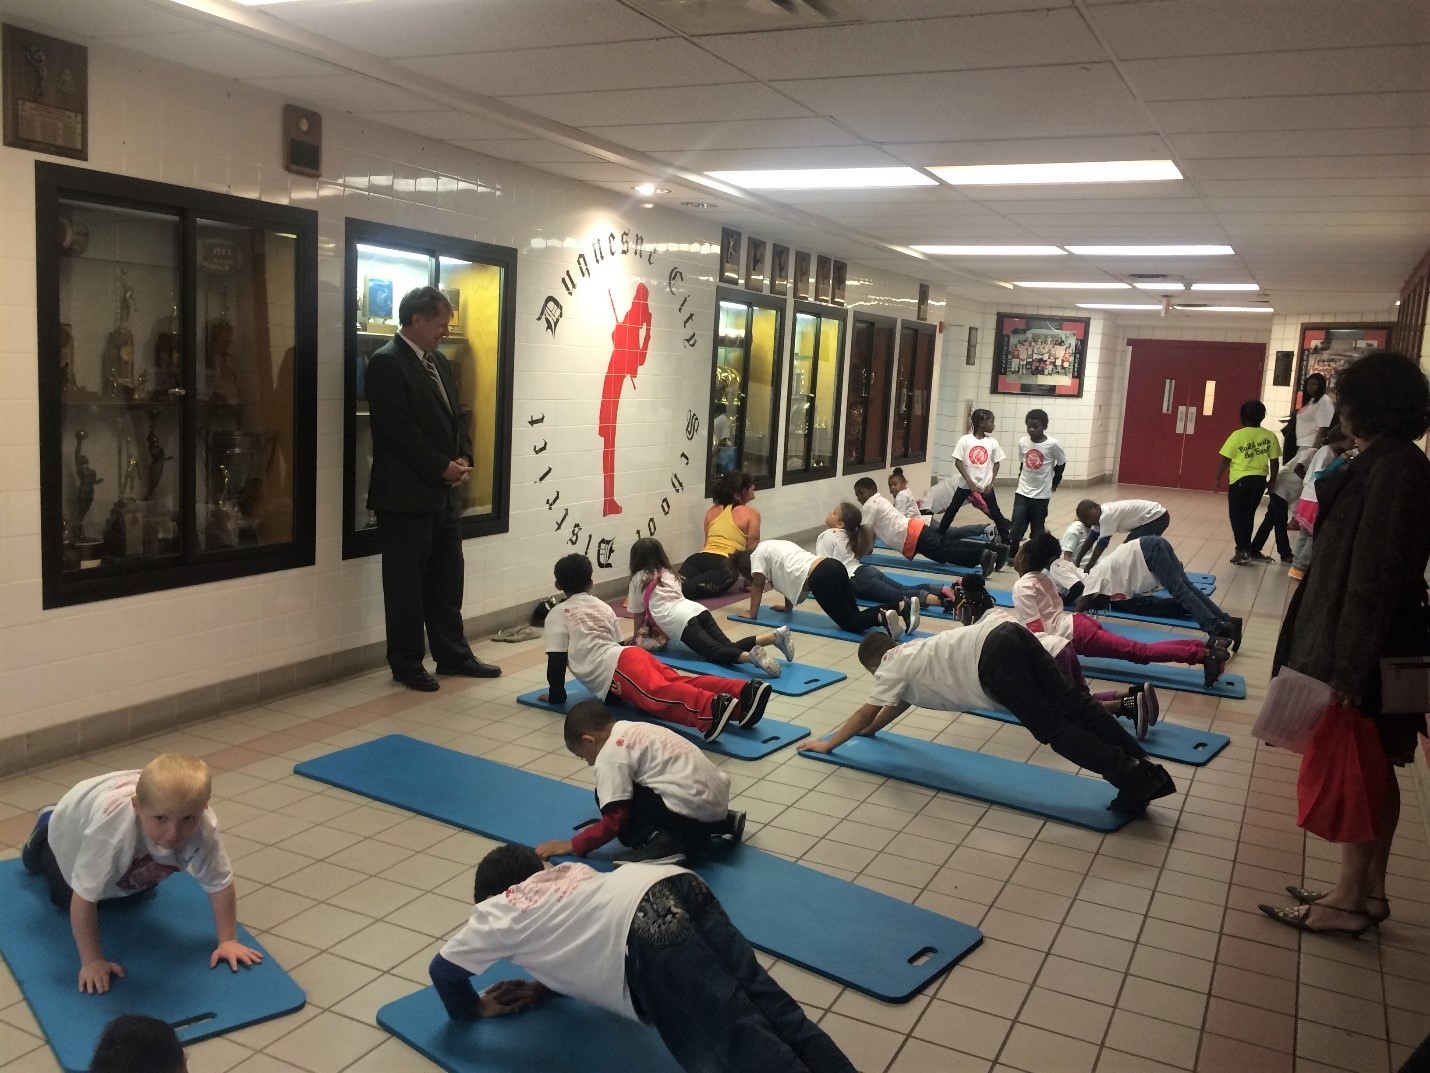
Brief: Active Physical Education (PE) in Allegheny County, Pennsylvania
The information in this brief is intended only to provide educational information.
This brief summarizes findings from the CHOICES Learning Collaborative Partnership simulation model of implementing an Active Physical Education (PE) program in school districts participating in the Live Well Allegheny initiative in Allegheny County, Pennsylvania. Live Well Allegheny Schools will commit that 50% of PE class time be dedicated to moderate-to-vigorous physical activity (MVPA).
The Issue
One objective of the Allegheny County Health Department (ACHD) Community Health Improvement Plan is to decrease obesity in school-age children. Research shows that physical activity helps kids grow up at a healthy weight and reduces the risk of future chronic disease.1 However, many kids do not get enough daily physical activity,2 and without action, a majority of today’s children will have obesity at age 35.3 This has substantial financial implications. The health care costs for treating obesity-related health conditions like heart disease and diabetes were $147 billion in 2008.4
PE programs in schools can help students get the recommended amount of physical activity per day.1 However, research shows that children often spend less than half of PE class being physically active.5 Improving the quality of PE classes in ways that ensure that children are more active during class time will not only help children get more physical activity, but can also encourage children to develop habits to ensure an active and healthy lifestyle.1 The purpose of this study is to estimate the cost-effectiveness of implementing Active PE, which requires that at least 50% of PE class time be spent in MVPA.
About Active PE
The ACHD envisions that Active PE could be implemented in school districts that have partnered with Live Well Allegheny, a county-wide campaign to improve the health and wellness of Allegheny County residents. Implementation of Active PE would include dissemination of the evidence-based program SPARK PE to eligible elementary and middle schools. SPARK is a well-evaluated and widely used curriculum and training program that has been found to increase MVPA time in PE class.6
SPARK trainers would lead two-day workshops to train PE teachers on how to use and implement the SPARK PE curriculum. Participating schools would receive SPARK curricula, instructional materials, and equipment. Implementation would include a county-level PE Educational Specialist to provide oversight and monitoring of policy implementation, as well as ongoing training and support for teachers and schools each year.
Comparing Costs and Outcomes
CHOICES cost-effectiveness analysis compared the costs and outcomes of the implementation of the Active PE program in designated Live Well Allegheny school districts over a 10-year time horizon with the costs and outcomes of not implementing the intervention. We assumed that all elementary and middle schools serving grades K-8 that are part of the 18 designated Live Well Allegheny school districts would receive training from SPARK. The model assumes that 70% of the PE teachers trained would implement Active PE program in their schools.7,8
Implementing Active PE is an investment in the future. By the end of 2027: |
Conclusions and Implications
The implementation of Active PE using the evidence-based program SPARK within Live Well Allegheny Schools is projected to improve the health of many children in Allegheny County. The intervention would help ensure that 62,100 children attend schools with more active PE classes and would cost $2.29 million dollars to implement over 10 years, at an average of $37 per child. In schools that implement the Active PE program, on average we estimate that students would get 7 additional minutes of MVPA per school week, which is a 3% increase in MVPA. We estimate there will be 13 fewer cases of childhood obesity in the final year of the model as a result of implementation of Active PE.
SPARK training offers a professional development opportunity for teachers to improve instructional strategies to foster a fun and enjoyable environment where children can gain lifelong skills to engage in physical activity.10 There are also other likely positive benefits from physical activity related to improved bone health, aerobic and muscular fitness, cognition, and academic performance1 that are not quantified in this analysis but are important outcomes for children’s education and well-being.
Active PE is one evidence-based strategy that can benefit the majority of students in a school where most children attend PE classes and can be incorporated into a comprehensive plan to address childhood obesity. Leaders should use the best available evidence to select strategies to help children be more active.
References
- 2018 Physical Activity Guidelines Advisory Committee. 2018 Physical Activity Guidelines Advisory Committee Scientific Report. Washington, DC: U.S. Department of Health and Human Services, 2018. Accessed September 7, 2018.
- Child and Adolescent Health Measurement Initiative. 2016-2017 National Survey of Children’s Health (NSCH) data query. Data Resource Center for Child and Adolescent Health supported by Cooperative Agreement U59MC27866 from the U.S. Department of Health and Human Services, Health Resources and Services Administration’s Maternal and Child Health Bureau (HRSA MCHB). Retrieved [02/08/2019] from www. childhealthdata.org. CAHMI: www.cahmi.org.
- Ward Z, Long M, Resch S, Giles C, Cradock A, Gortmaker S. Simulation of Growth Trajectories of Childhood Obesity into Adulthood. New England Journal of Medicine. 2017; 377(22): 2145-2153.
- Finkelstein EA, Trogdon JG, Cohen JW, Dietz W. Annual Medical Spending Attributable To Obesity: Payer-And Service-Specific Estimates. Health Affairs. 2009;28(5).
- Institute of Medicine. Educating the Student Body: Taking Physical Activity and Physical Education to School. Washington, DC: National Academies Press; 2013.
Sallis, J. F., McKenzie, T. L., Alcaraz, J. E., Kolody, B., Faucette, N., & Hovell, M. F. (1997). The effects of a 2-year physical education program (SPARK) on physical activity and fitness in elementary school students. Sports, Play and Active Recreation for Kids. American Journal of Public Health, 87(8), 1328-1334. - Hoelscher DM, Feldman HA, Johnson CC, et al. School-based health education programs can be maintained overtime: results from the CATCH Institutionalization study. Prev Med. May 2004;38(5):594-606.
- McKenzie TL, Li D, Derby CA, Webber LS, Luepker RV, Cribb P. Maintenance of effects of the CATCH physical education program: results from the CATCH-ON study. Health Education Behavior. Aug 2003;30(4):447-462.
- Cradock, A. L., Barrett, J. L., Kenney, E. L., Giles, C. M., Ward, Z. J., Long, M. W., … & Gortmaker, S. L. Using cost-effectiveness analysis to prioritize policy and programmatic approaches to physical activity promotion and obesity prevention in childhood. Preventive Medicine. 2017; 95, S17-S27.
- Society of Health and Physical Educators (SHAPE). Physical Education Guidelines. Retrieved from: https://www.shapeamerica.org/standards/guidelines/peguidelines.aspx Accessed 13 April 2018.
- McKenzie, T. L., Sallis, J. F., & Rosengard, P. (2009). Beyond the stucco tower: Design, development, and dissemination of the SPARK physical education programs. Quest, 61(1), 114-127.
Suggested Citation:Pagnotta M, Hardy H, Reiner J, Barrett J, Cradock A. Allegheny County Active Physical Education (PE) [Issue Brief]. Allegheny County Health Department, Pittsburgh, PA, and the CHOICES Learning Collaborative Partnership at the Harvard T.H. Chan School of Public Health, Boston, MA; December, 2019. |
This issue brief was developed at the Harvard T.H. Chan School of Public Health in collaboration with the Allegheny County Health Department (ACHD) through participation in the Childhood Obesity Intervention Cost-Effectiveness Study (CHOICES) Learning Collaborative Partnership. This brief is intended for educational use only.
Brief: Safe Routes to School (SRTS) in Houston, Texas

The information in this brief is intended only to provide educational information.
This brief summarizes findings from the CHOICES Learning Collaborative Partnership simulation model of implementing Safe Routes to School (SRTS) initiatives in elementary and middle schools in Houston Independent School District. SRTS aims to help children safely walk and bicycle to school through infrastructure improvements, education, and promotional activities.
The Issue
Research shows that physical activity helps kids grow up at a healthy weight and reduces the risk of future chronic disease;1 however, many kids do not get enough daily physical activity,2 and without action, a majority of today’s children will have obesity at age 35.3 This has substantial financial implications. The healthcare costs for treating obesity-related health conditions like heart disease and diabetes were $147 billion in 2008.4
Every child deserves the opportunity to be healthy, and all kids need opportunities to be physically active, no matter where they live or where they go to school. Over recent decades, the declining rates of using physically active transportation modes like walking and bicycling to school may have contributed to lower than recommended levels of physical activity among youth.5 In Houston, concerns over pedestrian and bicycle safety may deter parents from allowing their child walk or bike to school. SRTS initiatives are an effective strategy to increase physical activity by promoting safer walking and bicycling opportunities6 and would be an important component of the City’s effort to create safe, efficient and effective alternatives to traveling by car.
About Safe Routes to School
Houston envisions implementing SRTS as part of Houston’s Vision Zero initiative, a comprehensive approach to address traffic safety to eliminate all traffic fatalities and serious injuries. Vision Zero can support SRTS initiatives to improve street safety and encourage more kids and families to walk and bike to and from school.
We estimated the cost to implement SRTS initiatives in Houston, including transportation infrastructure projects to improve the local physical environments around schools and education, encouragement and enforcement activities. Other necessary resources include a program coordinator and a Committee Taskforce to provide city-level oversight, administration, and project selection support.
Comparing Costs and Outcomes
CHOICES cost-effectiveness analysis compared the costs and outcomes over a 10-year time horizon (2017-2027) of implementing SRTS in Houston with the costs and outcomes associated with not implementing the program. We estimated that 199 elementary and middle schools serving grades K-8 in Houston Independent School District would implement a new SRTS program. Additional research suggests that 5.5% of students would shift from cars to active travel modes after SRTS implementation.6 This shift would result in some projected cost savings due to reduced vehicle use for school transportation trips.
Implementing Safe Routes to School in Houston is an investment in the future. By the end of 2027: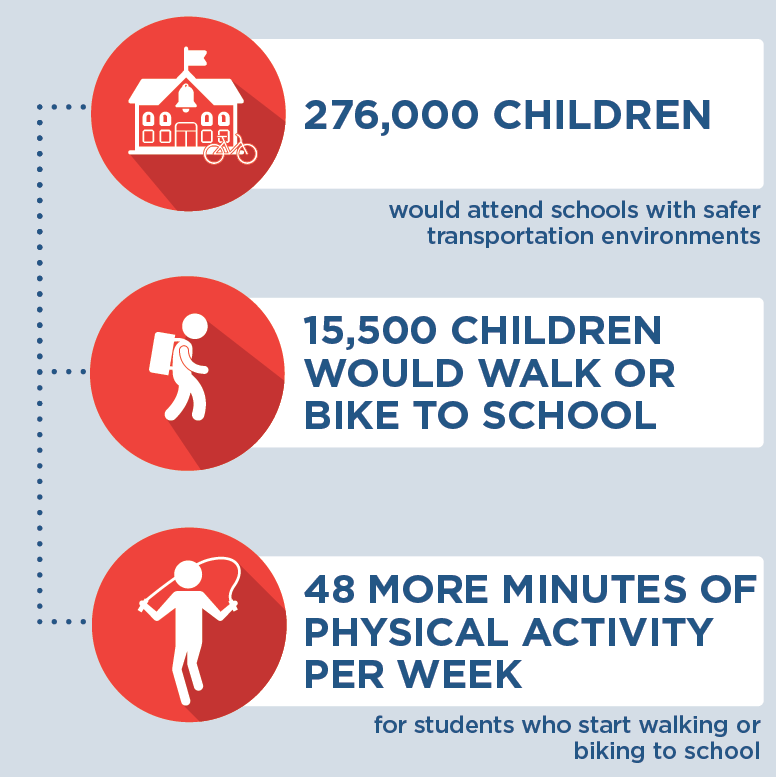 |
Conclusions and Implications
Investing in initiatives that make it safer and more appealing to walk or bicycle to and from school can help more children accumulate recommended levels of physical activity. We estimate that over ten years, over 276,000 students in the Houston Independent School District would benefit from improved safety around schools and those that start walking or biking to school would engage in 48 more minutes of physical activity during the school week.
Implementing SRTS in Houston Independent School District would require an investment of $19.5 million dollars over 10 years. When accounting for cost offsets due to reduced vehicle traffic for students who shift travel modes, the projected 10-year implementation costs are estimated to be cost-saving. In Houston, SRTS project implementation costs could be offset by savings associated with reduced vehicle travel that include $4 million in environment-related cost savings. Additionally, families whose students start walking or bicycling and thus drive less for school transportation trips could average $1,080 in savings.
SRTS initiatives, which include a combination of infrastructure improvements (e.g., adding sidewalks or traffic calming) and non-infrastructure activities (e.g., safety education, promotional events, enforcement and evaluation activities) may also reduce the risk of pedestrian and bicycle injury.7,8 Investing in SRTS projects that make walking and bicycling to school safer and easier opens opportunities for those families who want to allow their child to walk or bike but cannot because of safety concerns.9
These multiple benefits reinforce the importance of investing in effective strategies that promote accessible, safe, and convenient walking and biking options to improve the health of our students and the environments of our local communities.
References
- 2018 Physical Activity Guidelines Advisory Committee. 2018 Physical Activity Guidelines Advisory Committee Scientific Report. Washington, DC: U.S. Department of Health and Human Services, 2018. Accessed September 7, 2018.2.
- Child and Adolescent Health Measurement Initiative. 2016-2017 National Survey of Children’s Health (NSCH) data query. Data Resource Center for Child and Adolescent Health supported by Cooperative Agreement U59MC27866 from the U.S. Department of Health and Human Services, Health Resources and Services Administration’s Maternal and Child Health Bureau (HRSA MCHB). Retrieved [02/08/2019] from www.childhealthdata.org. CAHMI: www.cahmi.org.
- Ward Z, Long M, Resch S, Giles C, Cradock A, Gortmaker S. Simulation of Growth Trajectories of Childhood Obesity into Adulthood. N Engl J Med. 2017; 377(22): 2145-2153.
- Finkelstein EA, Trogdon JG, Cohen JW, Dietz W. Annual Medical Spending Attributable To Obesity: Payer-And Service-Specific Estimates. Health Affairs. 2009;28(5).
- McDonald, NC. Active transportation to school: trends among US schoolchildren, 1969–2001. American Journal of Preventive Medicine. 2007; 32(6), 509-516
- McDonald C, Steiner RL, Lee C, Smith TR, Zhu X, & Yang Y. Impact of the Safe Routes to School Program on Walking and Bicycling, Journal of the American Planning Association. 2014; 80:2, 153-167
- DiMaggio, C, & Li, G. Effectiveness of a safe routes to school program in preventing school-aged pedestrian injury. Pediatrics. 2013; 131(2), 290-296.
- DiMaggio C, Chen Q, Muennig PA, Li G. Timing and effect of a safe routes to school program on child pedestrian injury risk during school travel hours: Bayesian changepoint and difference-in-difference analysis. Injury Epidemiology 2014; 1:17
- McDonald, NC & Aalborg, AE. Why Parents Drive Children to School: Implications for Safe Routes to School Programs, Journal of the American Planning Association. 2009; 75:3, 331-342, DOI: 10.1080/01944360902988794
Suggested Citation:Reiner J, Barrett J, Giles C, Cradock A. Houston Safe Routes to School [Issue Brief]. Houston Health Department, Houston, TX and the CHOICES Learning Collaborative Partnership at the Harvard T.H. Chan School of Public Health, Boston, MA; December 2019. |
This issue brief was developed at the Harvard T.H. Chan School of Public Health in collaboration with the Houston Health Department and the Houston Planning and Development Department through participation in the Childhood Obesity Intervention Cost-Effectiveness Study (CHOICES) Learning Collaborative Partnership. This brief is intended for educational use only.
Brief: Active Recess in Salt Lake County, Utah

The information in this brief is intended only to provide educational information.
The following provides a summary of findings from the CHOICES Learning Collaborative Partnership simulation model of an Active Recess policy in schools in Salt Lake County, UT to increase students’ physical activity levels during recess by installing playground markings, providing portable play equipment, and/or providing adult-led engaging activity options.
The Issue
Over the past three decades, obesity has nearly tripled in Utah.1 In the United States, health care costs for treating obesity-related health conditions such as heart disease and diabetes were $147 billion in 2008.2 Emerging prevention strategies directed at children show great promise for addressing this issue.3 Evidence shows that physical activity helps kids grow up at a healthy weight.
In Utah, only 19% of children meet the recommended 60 minutes of daily physical activity.4 Among all counties in Utah, Salt Lake County has the second highest rate of children with obesity.5 Recess periods during the school day typically last 10-15 minutes or more and are scheduled as isolated breaks or in association with lunch.6,7 Elementary school children generally spend more time in recess than physical education weekly.8 Schools often lack resources that can encourage physical activity during recess such as supportive supervision, play facilities, and equipment.9,10 On average, children spend less than 50% of recess time engaged in moderate-to-vigorous physical activity (MVPA).10
About Active Recess
We assumed that implementation would occur district-wide in public elementary and charter schools in the four school districts in Salt Lake County that provide recess but do not currently require the use of Active Recess strategies. Future grant funding would provide for installation of playground markings, provision of portable play equipment, and/or provision of adult-led engaging activities designed to increase students’ physical activity levels during school recess time. Playground markings would be installed for adult-led games that engage children in physical activity (e.g., four square, hop-scotch) and participating schools would receive portable playground equipment for use during recess time.
Comparing Costs and Outcomes
CHOICES cost-effectiveness analysis compared the costs and outcomes of implementing an Active Recess policy over 10 years (2017-2027) to costs and outcomes if the policy is not implemented. The approach assumes that no school is currently implementing Active Recess practices in these four districts, and 94% of these schools adopt Active Recess practices where all students benefit.
Implementing Active Recess is an investment in the future. By the end of 2027: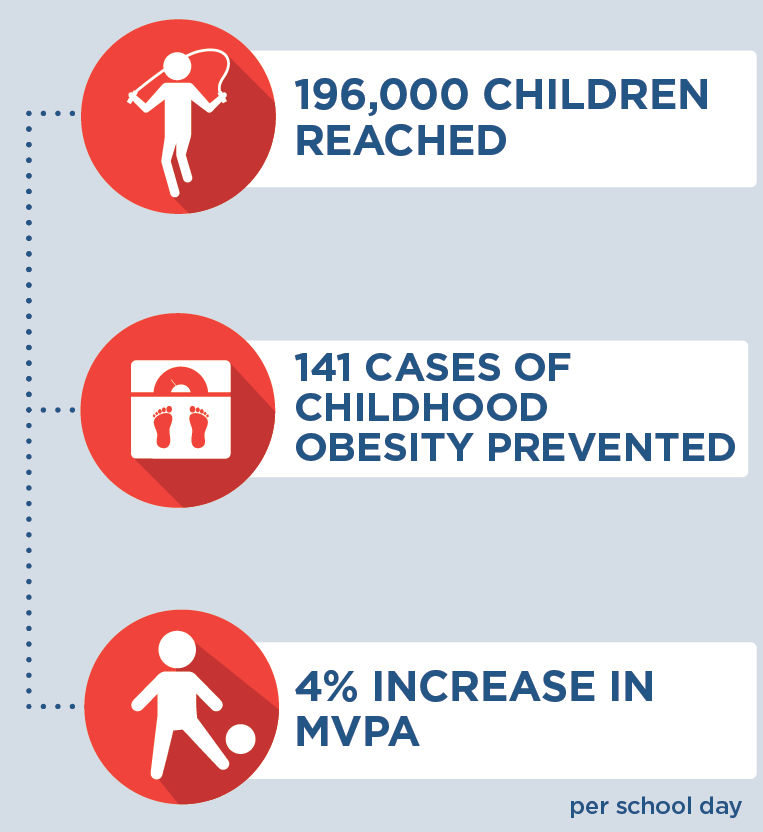 |
Conclusions and Implications
Every child deserves a healthy start in life. An Active Recess policy in Salt Lake County could help ensure that more kids have opportunities to be physically active during recess, no matter which school district they are in. Implementing a district-level policy in these Salt Lake County public elementary schools and charter schools would require an investment of $24 per student to provide the equipment and resources needed to increase physical activity levels during recess.
These results reinforce the importance of investing in prevention efforts to reduce the prevalence of obesity. This intervention would prevent 141 cases of childhood obesity in 2027 and provide the opportunity for 196,000 children to engage in active recess opportunities. For every $1.00 spent on implementing the Active Recess policy, $0.06 in health care costs would be saved. While not quantified in this analysis, there are also other positive benefits from physical activity related to cognition and academic performance that may also result in additional cost savings.11
Evidence is growing about how to help children grow up at a healthy weight. Strategies such as Active Recess are laying the foundation for a healthier future by helping schools create environments that nurture healthy habits.
References
- Utah Department of Health. (2018). Public Health Indicator Basied Information System (IBIS) Utah’s Public Health Data Resource, Health Indicator Report of Overweight or Obese. https://ibis.health.utah.gov/ibisph-view/indicator/view/OvrwtObe.UT_US.html
- Finkelstein EA, Trogdon JG, Cohen JW, Dietz W. Annual Medical Spending Attributable To Obesity: Payer-And Service-Specific Estimates. Health Affairs. 2009;28(5).
- Gortmaker, S.L., Wang, Y.C., Long, M.W., et al. Three Interventions That Reduce Childhood Obesity are Projected to Save More Than They Cost to Implement. Health Affairs, 2015, 34(11), 1932–193
- Utah Department of Health. (2018). Public Health Indicator Basied Information System (IBIS) Utah’s Public Health Data Resource, Health Indicator Report of Physical Activity Among Adolesents. https://ibis.health.utah.gov/ibisph-view/indicator/view/PhysActAdol.UT_US.html
- Utah Department of Health. (2018). Public Health Indicator Basied Information System (IBIS) Utah’s Public Health Data Resource, Health Indicator Report of Obesity Among Children and Adolescents. https://ibis.health.utah.gov/ibisph-view/indicator/view/OvrwtChild.LHD.html
- Parsad, B. & Lewis, L .Calories In, Calories Out: Food and Exercise in Public Elementary Schools, 2005, National Center for Education Statistics, U.S. Department of Education Report No. NCES 2006–057, (2006). https://nces.ed.gov/pubs2006/2006057.pdf. Accessed January 24, 2017.
- Centers for Disease Control and Prevention. The Association Between School-Based Physical Activity, Including Physical Education, and Academic Performance. Atlanta, GA: U.S. Department of Health and Human Services; (2010). https://www.cdc.gov/ healthyyouth/health_and_academics/pdf/pa-pe_paper.pdf. Accessed January 24, 2017.
- Robert Wood Johnson Foundation. Recess Rules: Why the Undervalued Playtime May Be America’s Best Investment for Healthy Kids and Healthy Schools. Princetown, NJ: Robert Wood Johnson Foundation; 2007.
- National Association for Sport and Physical Education. Recess for Elementary School Students: A Position Paper, Council on Physical Education for Children Report, (2006). http://files.eric.ed.gov/fulltext/ED497155.pdf. Accessed January 24, 2017.
- Stratton G. Promoting Children’s Physical Activity in Primary School: An Intervention Study Using Playground Markings. Ergonomics, 2000, 43(10), 538-1546.
- 2018 Physical Activity Guidelines Advisory Committee. 2018 Physical Activity Guidelines Advisory Committee Scientific Report. Washington, DC: U.S. Department of Health and Human Services, 2018. Accessed September 7, 2018
Suggested Citation:McKinnon A, Barrett J, Cradock A, Flax C. Salt Lake County: Active Recess [Issue Brief]. Salt Lake County Health Department, Salt Lake City, UT, and the CHOICES Learning Collaborative Partnership at the Harvard T.H. Chan School of Public Health, Boston, MA; December 2019. |
This issue brief was developed at the Harvard T.H. Chan School of Public Health in collaboration with the Salt Lake County Health Department through participation in the Childhood Obesity Intervention Cost-Effectiveness Study (CHOICES) Learning Collaborative Partnership. This brief is intended for educational use only.
Brief: Active Physical Education (PE) in Hawaii
The information in this brief is intended only to provide educational information.
This brief summarizes the findings from a CHOICES Learning Collaborative Partnership simulation model of statewide implementation of the Hawaii State Department of Education (DOE) “Active PE” Wellness Guideline that requires 50% of physical education (PE) class be dedicated to moderate-to-vigorous physical activity (MVPA).
The Issue
Every child deserves the opportunity to be healthy. Research shows that physical activity helps kids grow up at a healthy weight and reduces risk of future chronic disease.1 If current trends continue in the United States, more than half of today’s children will have obesity at age 35.2 Health care costs for treating obesity-related health conditions such as heart disease and diabetes were $147 billion in 2008.3 The best chance we have to make sure kids grow up to be healthy is while they are still growing.
Although participation in physical education (PE) can help students meet the national recommendation of 60 minutes of physical activity per day,1 less than half of PE minutes are typically active.4 Hawaii DOE wellness guidelines say that elementary school students in DOE schools should receive at least 45 minutes of PE per week.5 The purpose of this study is to estimate the cost-effectiveness of implementing the Active PE guideline, which requires that at least 50% of PE time be spent in MVPA.
About Active PE
The hypothetical statewide implementation of the Active PE wellness guideline would include dissemination of the evidence-based program SPARK PE to elementary schools in Hawaii. SPARK is a widely used program that has been found to increase MVPA time in PE class.6
District PE Resource Teachers would receive professional development to become SPARK certified trainers, and then would train elementary PE teachers in subsequent years. All trained teachers would receive SPARK curricula and instructional materials, and all eligible schools would receive SPARK equipment. Implementation would include a state-level PE Educational Specialist to provide oversight and monitoring of policy implementation, as well as ongoing training and support for teachers and schools each year.
Comparing Costs and Outcomes
CHOICES cost-effectiveness analysis compared the costs and outcomes over a 10-year time horizon (2017-2027) of the statewide implementation of the Active PE wellness guideline with the costs and outcomes associated with not developing a comprehensive plan to fully implement the guideline. We assumed that all designated PE specialists, who are employed in 65% of schools, would be trained in SPARK. In schools without a PE specialist, one general classroom teacher per grade would be trained. Using this approach, 58% of students in grades K-6 would benefit from this intervention.
Implementing Active PE is an investment in the future. By the end of 2027: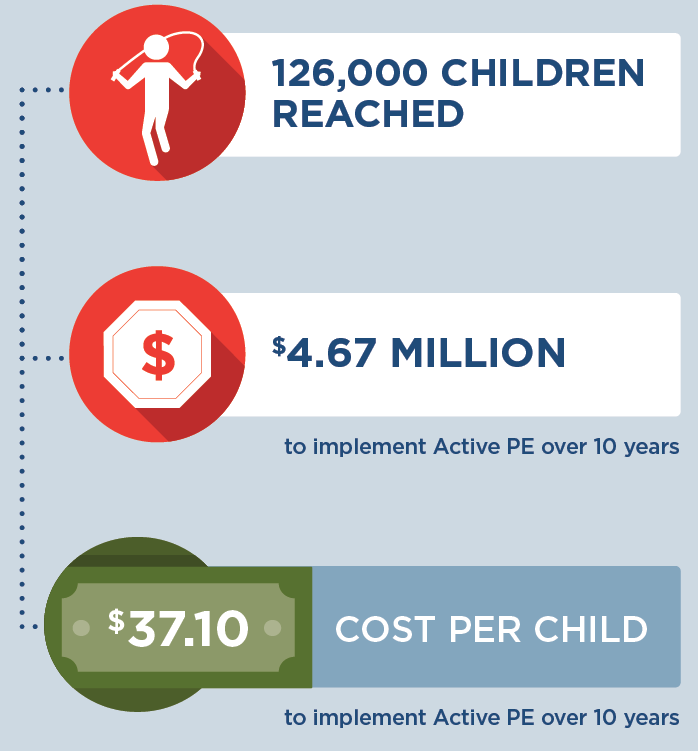 |
Conclusions and Implications
The statewide implementation of the Active PE guideline, using the evidence-based program SPARK, is projected to have a widespread reach and positive impact, at an investment cost that appears reasonable compared to alternative approaches for increasing physical activity among children.7 The intervention would reach 126,000 children and would cost $37.10 per child to implement over 10 years. We project that Active PE implementation would increase MVPA by nearly 3 minutes per PE class for each child. We estimate there will be 19 fewer cases of childhood obesity in the final year of the model as a result of implementation of the Active PE guideline.
If Hawaii DOE schools were able to offer 150 minutes per week for elementary school students,8 we project the health benefits for children to be even higher. MVPA would increase by over 9 minutes per week per child and 65 cases of childhood obesity would be prevented in the final year of the model.
SPARK training offers a professional development opportunity for teachers to learn new instructional strategies to foster a fun and enjoyable environment where children can gain lifelong skills to engage in physical activity.9 There are likely positive benefits from physical activity related to improved bone health, aerobic and muscular fitness, cognition and academic performance1 that are not quantified in this analysis, but are important outcomes for children’s education and well-being.
While evidence is growing about how to help children achieve a healthy weight, there is currently not one single strategy that will reverse the obesity epidemic on its own. Active PE is one evidence-based strategy that can benefit the majority of students and can be incorporated into a comprehensive plan to address childhood obesity. Leaders at the state level should use the best available evidence to select strategies to help children be more active.
References
- 2018 Physical Activity Guidelines Advisory Committee. 2018 Physical Activity Guidelines Advisory Committee Scientific Report. Washington, DC: U.S. Department of Health and Human Services, 2018. Accessed September 7, 2018.
- Ward ZJ, Long MW, Resch S, Giles CM, Cradock AL, Gortmaker SL. Simulation of Growth Trajectories of Childhood Obesity into Adulthood. New England Journal of Medicine. 2017; 377(22): 2145-2153.
- Finkelstein EA, Trogdon JG, Cohen JW, Dietz W. Annual Medical Spending Attributable To Obesity: Payer-And Service-Specific Estimates. Health Affairs. 2009;28(5).
- Institute of Medicine. Educating the Student Body: Taking Physical Activity and Physical Education to School. Washington, DC: National Academies Press; 2013.
- Hawaii State Department of Education. Hawaii State Department of Education Wellness Guidelines. Retrieved from: http://www.hawaiipublicschools.org/DOE%20Forms/Health%20and%20Nutrition/Wellness-Guidelines-Implementation-Checklist.pdf. Accessed 12 April 2018.
- Sallis JF, McKenzie TL, Alcaraz JE, Kolody B, Faucette N, & Hovell MF. The effects of a 2-year physical education program (SPARK) on physical activity and fitness in elementary school students. Sports, Play and Active Recreation for Kids. American Journal of Public Health. 1997; 87(8), 1328-1334.
- Cradock AL, Barrett JL, Kenney EL, Giles CM, Ward ZJ, Long MW, … & Gortmaker SL. Using cost-effectiveness analysis to prioritize policy and programmatic approaches to physical activity promotion and obesity prevention in childhood. Preventive Medicine. 2017; 95, S17-S27.
- Society of Health and Physical Educators (SHAPE). Physical Education Guidelines. Retrieved from: https://www.shapeamerica.org/standards/guidelines/peguidelines.aspx. Accessed 13 April 2018.
- McKenzie TL, Sallis JK, & Rosengard P. Beyond the stucco tower: Design, development, and dissemination of the SPARK physical education programs. Quest. 2009;61(1), 114-127.
Suggested Citation:Irvin L, Ryan J, Ching L, Starr R, Yamauchi J, La Chica T, Reiner JF, Barrett JL, Giles CM, Tao H, Gortmaker SL, Ward ZJ, Cradock AL. Hawaii: Active Physical Education (PE) {Issue Brief}. Hawaii Department of Public Health, Honolulu, HI, and the CHOICES Learning Collaborative Partnership at the Harvard T.H. Chan School of Public Health, Boston, MA; July 2019. |
The design for this brief and its graphics were developed by Molly Garrone, MA and partners at Burness.
This issue brief was developed at the Harvard T.H. Chan School of Public Health in collaboration with the Hawaii Department of Health (MDH) through participation in the Childhood Obesity Intervention Cost-Effectiveness Study (CHOICES) Learning Collaborative Partnership. This brief is intended for educational use only. Funded by The JPB Foundation. Results are those of the authors and not the funders.
Brief: Safe Routes to School (SRTS) in Minnesota

The information in this brief is intended only to provide educational information.
This brief summarizes findings from a CHOICES Learning Collaborative Partnership (LCP) simulation model and cost-effectiveness analysis of the expansion of Safe Routes to School (SRTS) initiatives in elementary and middle schools in Minnesota. SRTS aims to help children safely walk and bicycle to school through infrastructure improvements, education, and promotional activities.
The Issue
Research shows that physical activity helps kids grow up at a healthy weight and reduces the risk of future chronic disease;1 however, the majority of kids do not get enough daily physical activity.2 Without action, a majority of today’s children will have obesity at age 353 with substantial financial implications as the costs for treating obesity-related health conditions such as heart disease and diabetes can total over $3 billion per year in Minnesota.4
Every child deserves the opportunity to be healthy, and all kids need opportunities to be physically active, no matter where they live or where they go to school. Over recent decades, the declining rates of using physically active transportation modes like walking and bicycling to school may have contributed to lower than recommended levels of physical activity among youth.5 In Minnesota, only 12.3% of students walk or bicycle to school.6 However, SRTS initiatives are an effective strategy to increase physical activity by promoting safe walking and bicycling opportunities.7
About Safe Routes to School
Minnesota SRTS initiatives are supported by a combination of state and federal transportation funding. This analysis assumes a continued allocation of $1 million per biennium to support the implementation of SRTS initiatives in Minnesota, in addition to a one-time increase of $6 million in state funding. As a portion of these state funds could be used as a match to leverage $2.6 million in additional federal funding, this investment would increase total funding support by $8.6 million. The expanded funding would support individual SRTS project implementation costs for infrastructure, planning and construction, and state program administration, including increased time in program coordination and project selection.
Comparing Costs and Outcomes
CHOICES cost-effectiveness analysis compared the costs and outcomes over a 10-year time horizon (2017-2027) of expanding SRTS in one biennium with the costs and outcomes associated with not expanding the program. Based on prior program expenditures, we estimated that 96 schools would implement a new SRTS program with the increase in state and leveraged federal funds. Additional research suggests that 5.5% of Minnesota’s students would shift from cars to active travel modes after SRTS implementation,6 a 45% increase in the current active transportation mode share in Minnesota. This shift would result in some projected cost savings due to reduced vehicle use for school transportation trips.
Implementing Safe Routes to School in Minnesota is an investment in the future. By the end of 2027: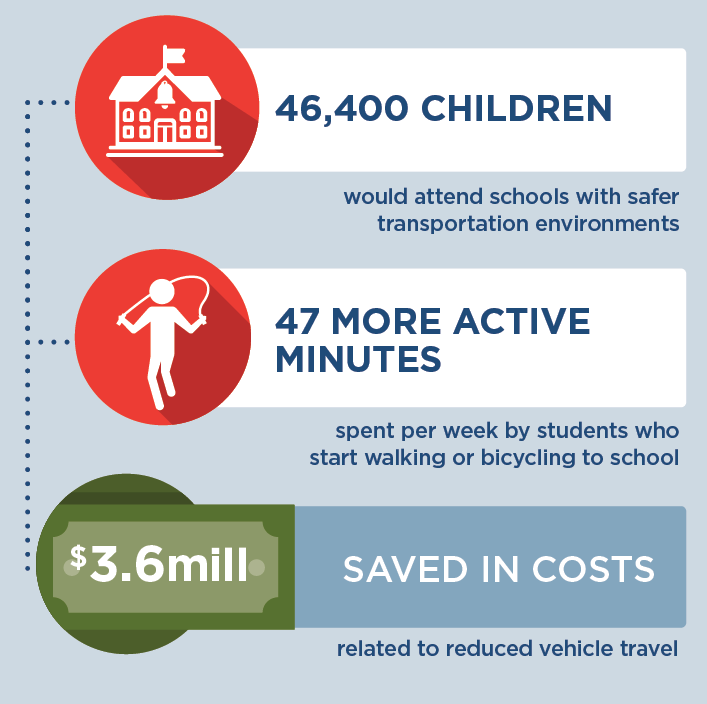 |
Conclusions and Implications
Over 46,000 students in Minnesota would benefit from safer transportation environments. Investing in SRTS initiatives helps children accumulate the recommended levels of physical activity; on average, those who start walking or bicycling to school engage in 47 more minutes of physical activity during the school week. We also estimate 6 fewer cases of obesity in 2027 as students shift to more physically active travel. There are likely positive benefits from physical activity related to improved bone health, aerobic and muscular fitness, cognition and academic performance1 that are not quantified in this analysis, but are important outcomes for children’s education and well-being.
The 10-year total intervention implementation costs, including projected cost savings due to reduced vehicle use, are estimated to be $6,550,000. In Minnesota, one-third of SRTS implementation costs could be offset by savings associated with reduced vehicle travel that include $607,000 in environment-related cost savings. Additionally, families whose students start walking or bicycling and thus drive less for school transportation trips could average $985 in savings over 10 years.
Strategic SRTS initiatives may reduce the risk of pedestrian and bicycle injury.8 We estimated that there is a 78% probability that the SRTS program as conceptualized for Minnesota would not result in additional injuries, even though more students may be walking or bicycling than in the past. Additionally, we estimate that there is a 66% probability that the SRTS program in Minnesota could prevent injury-related healthcare costs. Investing in SRTS projects that make walking and bicycling to school safer and easier opens opportunities for those families who want to allow their child to walk or bicycle but cannot because of safety concerns.9
These multiple benefits reinforce the importance of investing in effective strategies that promote accessible, safe, and convenient walking and bicycling options to improve the health of our students and the environments of our local communities.
References
- 2018 Physical Activity Guidelines Advisory Committee. 2018 Physical Activity Guidelines Advisory Committee Scientific Report. Washington, DC: U.S. Department of Health and Human Services, 2018. Accessed September 7, 2018.
- Child and Adolescent Health Measurement Initiative. 2016-2017 National Survey of Children’s Health (NSCH) data query. Data Resource Center for Child and Adolescent Health supported by Cooperative Agreement U59MC27866 from the U.S. Department of Health and Human Services, Health Resources and Services Administration’s Maternal and Child Health Bureau (HRSA MCHB). Retrieved [02/08/2019] from www.childhealthdata.org. CAHMI: www.cahmi.org.
- Ward Z, Long M, Resch S, Giles C, Cradock A, Gortmaker S. Simulation of Growth Trajectories of Childhood Obesity into Adulthood. New England Journal of Medicine. 2017; 377(22): 2145-2153.
- Trogdon JG, Finkelstein EA, Feagan, W, Cohen JW. State- and payer-specific estimates of annual medical expenditures attributable to obesity. Obesity. 2012; 20(1), 214-220.
- McDonald, NC. Active transportation to school: trends among US schoolchildren, 1969–2001. American Journal of Preventive Medicine. 2007; 32(6), 509-516
- Pelletier J. (2018). Minnesota Student Travel Tally Data from 2011-2015. [Unpublished Raw data].
- McDonald C, Steiner RL, Lee C, Smith TR, Zhu X, & Yang Y. Impact of the Safe Routes to School Program on Walking and Bicycling, Journal of the American Planning Association. 2014; 80:2, 153-167
- DiMaggio C, Li G. Effectiveness of a safe routes to school program in preventing school-aged pedestrian injury. Pediatrics. 2013; 131(2), 290-296.
- McDonald NC, Aalborg AE. Why Parents Drive Children to School: Implications for Safe Routes to School Programs, Journal of the American Planning Association. 2009; 75:3, 331-342, DOI: 10.1080/01944360902988794
Suggested Citation:Pelletier J, Reiner JR, Barrett JL, Cradock AL, Giles CM. Minnesota: Safe Routes to School (SRTS) {Issue Brief}. Minnesota Department of Health (MDH), St. Paul, MN, and the CHOICES Learning Collaborative Partnership at the Harvard T.H. Chan School of Public Health, Boston, MA; March 2019. |
The design for this brief and its graphics were developed by Molly Garrone, MA and partners at Burness.
This issue brief was developed at the Harvard T.H. Chan School of Public Health in collaboration with the Minnesota Department of Health (MDH) through participation in the Childhood Obesity Intervention Cost-Effectiveness Study (CHOICES) Learning Collaborative Partnership. This brief is intended for educational use only. Funded by The JPB Foundation. Results are those of the authors and not the funders.
Brief: Nutrition and Physical Activity Self-Assessment for Child Care (NAP SACC) Intervention in West Virginia
The information in this brief is intended for educational use only.
This brief provides a summary of the CHOICES Learning Collaborative Partnership simulation model of integrating Key 2 a Healthy Start, West Virginia’s implementation of Nutrition and Physical Activity Self-Assessment for Child Care (NAP SACC), into the state’s Tiered Reimbursement system, which provides subsidy incentives to child care centers meeting quality standards.
The Issue
Over the past four decades, childhood obesity has tripled.1 In WV, obesity rates in 2-4 year old WIC participants increased from 14% up to 16.4% in 2014.2 WV was one of four states that experienced increasing rates in this young population. Now labeled as an epidemic, health care costs for treating obesity-related health conditions such as heart disease and diabetes range from $147 billion to $210 billion per year.3 While multiple strategies are needed to reverse the epidemic, emerging prevention strategies directed at children show great promise for addressing the epidemic.4 A large body of evidence shows that healthy eating, physical activity, and limiting sugary drinks and screen time helps kids grow up at a healthy weight.
In West Virginia, 41% of 2-5 year olds attend a licensed child care center. Licensed centers can offer healthy, nurturing environments for children. Tiered Reimbursement can encourage and empower centers to voluntarily improve nutrition, physical activity, and screen time standards while increasing financial incentives.
About Key 2 A Healthy Start
Key 2 a Healthy Start is based on NAP SACC, an evidence-based intervention for helping child care centers attain best practices regarding nutrition, active play, and screen time.5,6 The program enables child care directors and staff to complete self-assessments of their nutrition, active play, and screen time practices and receive training and technical assistance to implement changes that create healthier environments and policies. Integrating Key 2 a Healthy Start into West Virginia’s Tiered Reimbursement system would incentivize and support participation in the intervention and broaden its availability.
Comparing Costs and Outcomes
CHOICES cost-effectiveness analysis compared the costs and outcomes of integrating Key 2 a Healthy Start into Tiered Reimbursement over 10 years versus the costs and outcomes of not implementing the intervention. This model assumes that 44% of licensed child care centers will participate in Tiered Reimbursement and thus participate in Key 2 a Healthy Start.
Implementing Key 2 a Healthy Start in child care centers throughout West Virginia is an investment in the future: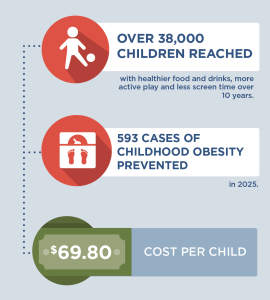 |
Conclusions and Implications
Every child deserves a healthy start in life. This includes ensuring that all kids have access to healthy foods and drinks and to be physically active, no matter where they live or which child care they attend. A state-level initiative to bring Key 2 a Healthy Start to West Virginia’s child care centers through the Tiered Reimbursement system could prevent 593 cases of childhood obesity in the last year of the model. Additionally, healthy child care environments and policies would be implemented for over 38,000 children.
For every $1.00 spent on implementing Key 2 a Healthy Start, a savings of $0.10 in health care costs is estimated. These results reinforce the importance of Key 2 a Healthy Start as primary obesity prevention. Implementing small changes early for young children can help them develop healthy habits for life, thereby avoiding more costly and ineffective treatment options in the future.
Evidence is growing about how to help children achieve a healthy weight. Programs such as Key 2 a Healthy Start are laying the foundation for healthier futures by helping child care centers create environments and policies that nurture healthy habits. Leaders at the federal, state, and local level should use the best available evidence to determine which evidence-based interventions hold the most promise for children to develop and maintain a healthy weight.
References
- Fryar CD, Carroll MD, Ogden CL, Prevalence of overweight and obesity among children and adolescents: United States, 1963-1965 through 2011-2012. Atlanta, GA: National Center for Health Statistics, 2014.
- Pan L, Freedman DS, Sharma AJ, et al. Trends in Obesity Among Participants Aged 2-4 Years in the Special Supplemental Nutrition Program for Women, Infants, and Children – United States, 2000–2014. Morbidity and Mortality Weekly Report (MMWR) 2016;65:1256–1260. DOI.
- Gortmaker SL, Wang YC, Long MW, Giles CM, Ward ZJ, Barrett JL, Kenney EL, Sonneville KR, Afzal AS, Resch SC, Cradock AL. Three interventions that reduce childhood obesity are projected to save more than they cost to implement. Health Aff (Millwood). 2015 Nov;34(11):1932-9.
- West Virginia Bureau of Children and Families (2015).
- Ward DS, Benjamin SE, Ammerman AS, Ball SC, Neelon BH, Bangdiwala SI. Nutrition and physical activity in child care: results from an environmental intervention. Am J Prev Med. 2008 Oct;35(4):352-6.
- Alkon A, Crowley AA, Neelon SE, Hill S, Pan Y, Nguyen V, Rose R, Savage E, Forestieri N, Shipman L, Kotch JB. Nutrition and physical activity randomized control trial in child care centers improves knowledge, policies, and children’s body mass index. BMC Public Health. 2014 Mar 1;14:215.
Suggested Citation:Jeffrey J, Giles C, Flax C, Cradock A, Gortmaker S, Ward Z, Kenney E. West Virginia Key 2 a Healthy Start Intervention [Issue Brief]. West Virginia Department of Health and Human Resources, Charleston, WV, and the CHOICES Learning Collaborative Partnership at the Harvard T.H. Chan School of Public Health, Boston, MA; April, 2018. |
This issue brief was developed at the Harvard T.H. Chan School of Public Health in collaboration with the West Virginia Department of Health and Human Resources through participation in the Childhood Obesity Intervention Cost-Effectiveness Study (CHOICES) Learning Collaborative Partnership. This brief is intended for educational use only.
Brief: Active Recess Intervention in Washington State
The information in this brief is intended for educational use only.
This brief provides a summary of the CHOICES Learning Collaborative Partnership simulation model in Washington of a potential Active Recess program in public elementary schools to increase students’ physical activity levels during recess via installation of playground markings, provision of portable play equipment, and/or provision of structured activities.
The Issue
Over the past three decades, more and more people have developed obesity.1 Health care costs for treating obesity-related health conditions such as heart disease and diabetes were$147 billion in 2008.2 Emerging cost-effective prevention strategies directed at children show great promise for addressing this issue.3 Evidence shows that physical activity helps kids grow up at a healthy weight.
In Washington, 98% of schools serving elementary grades provide at least one daily recess.4 Recess is typically allocated in bouts of 10-15 minutes or more as isolated breaks and/or in association with lunch.5,6 Elementary school children generally spend more time in recess than physical education weekly.7 Schools often lack resources that encourage physical activity among children including supervision, play facilities, and equipment.8,9 On average, children spend less than 50% of recess engaged in moderate-to-vigorous physical activity.9
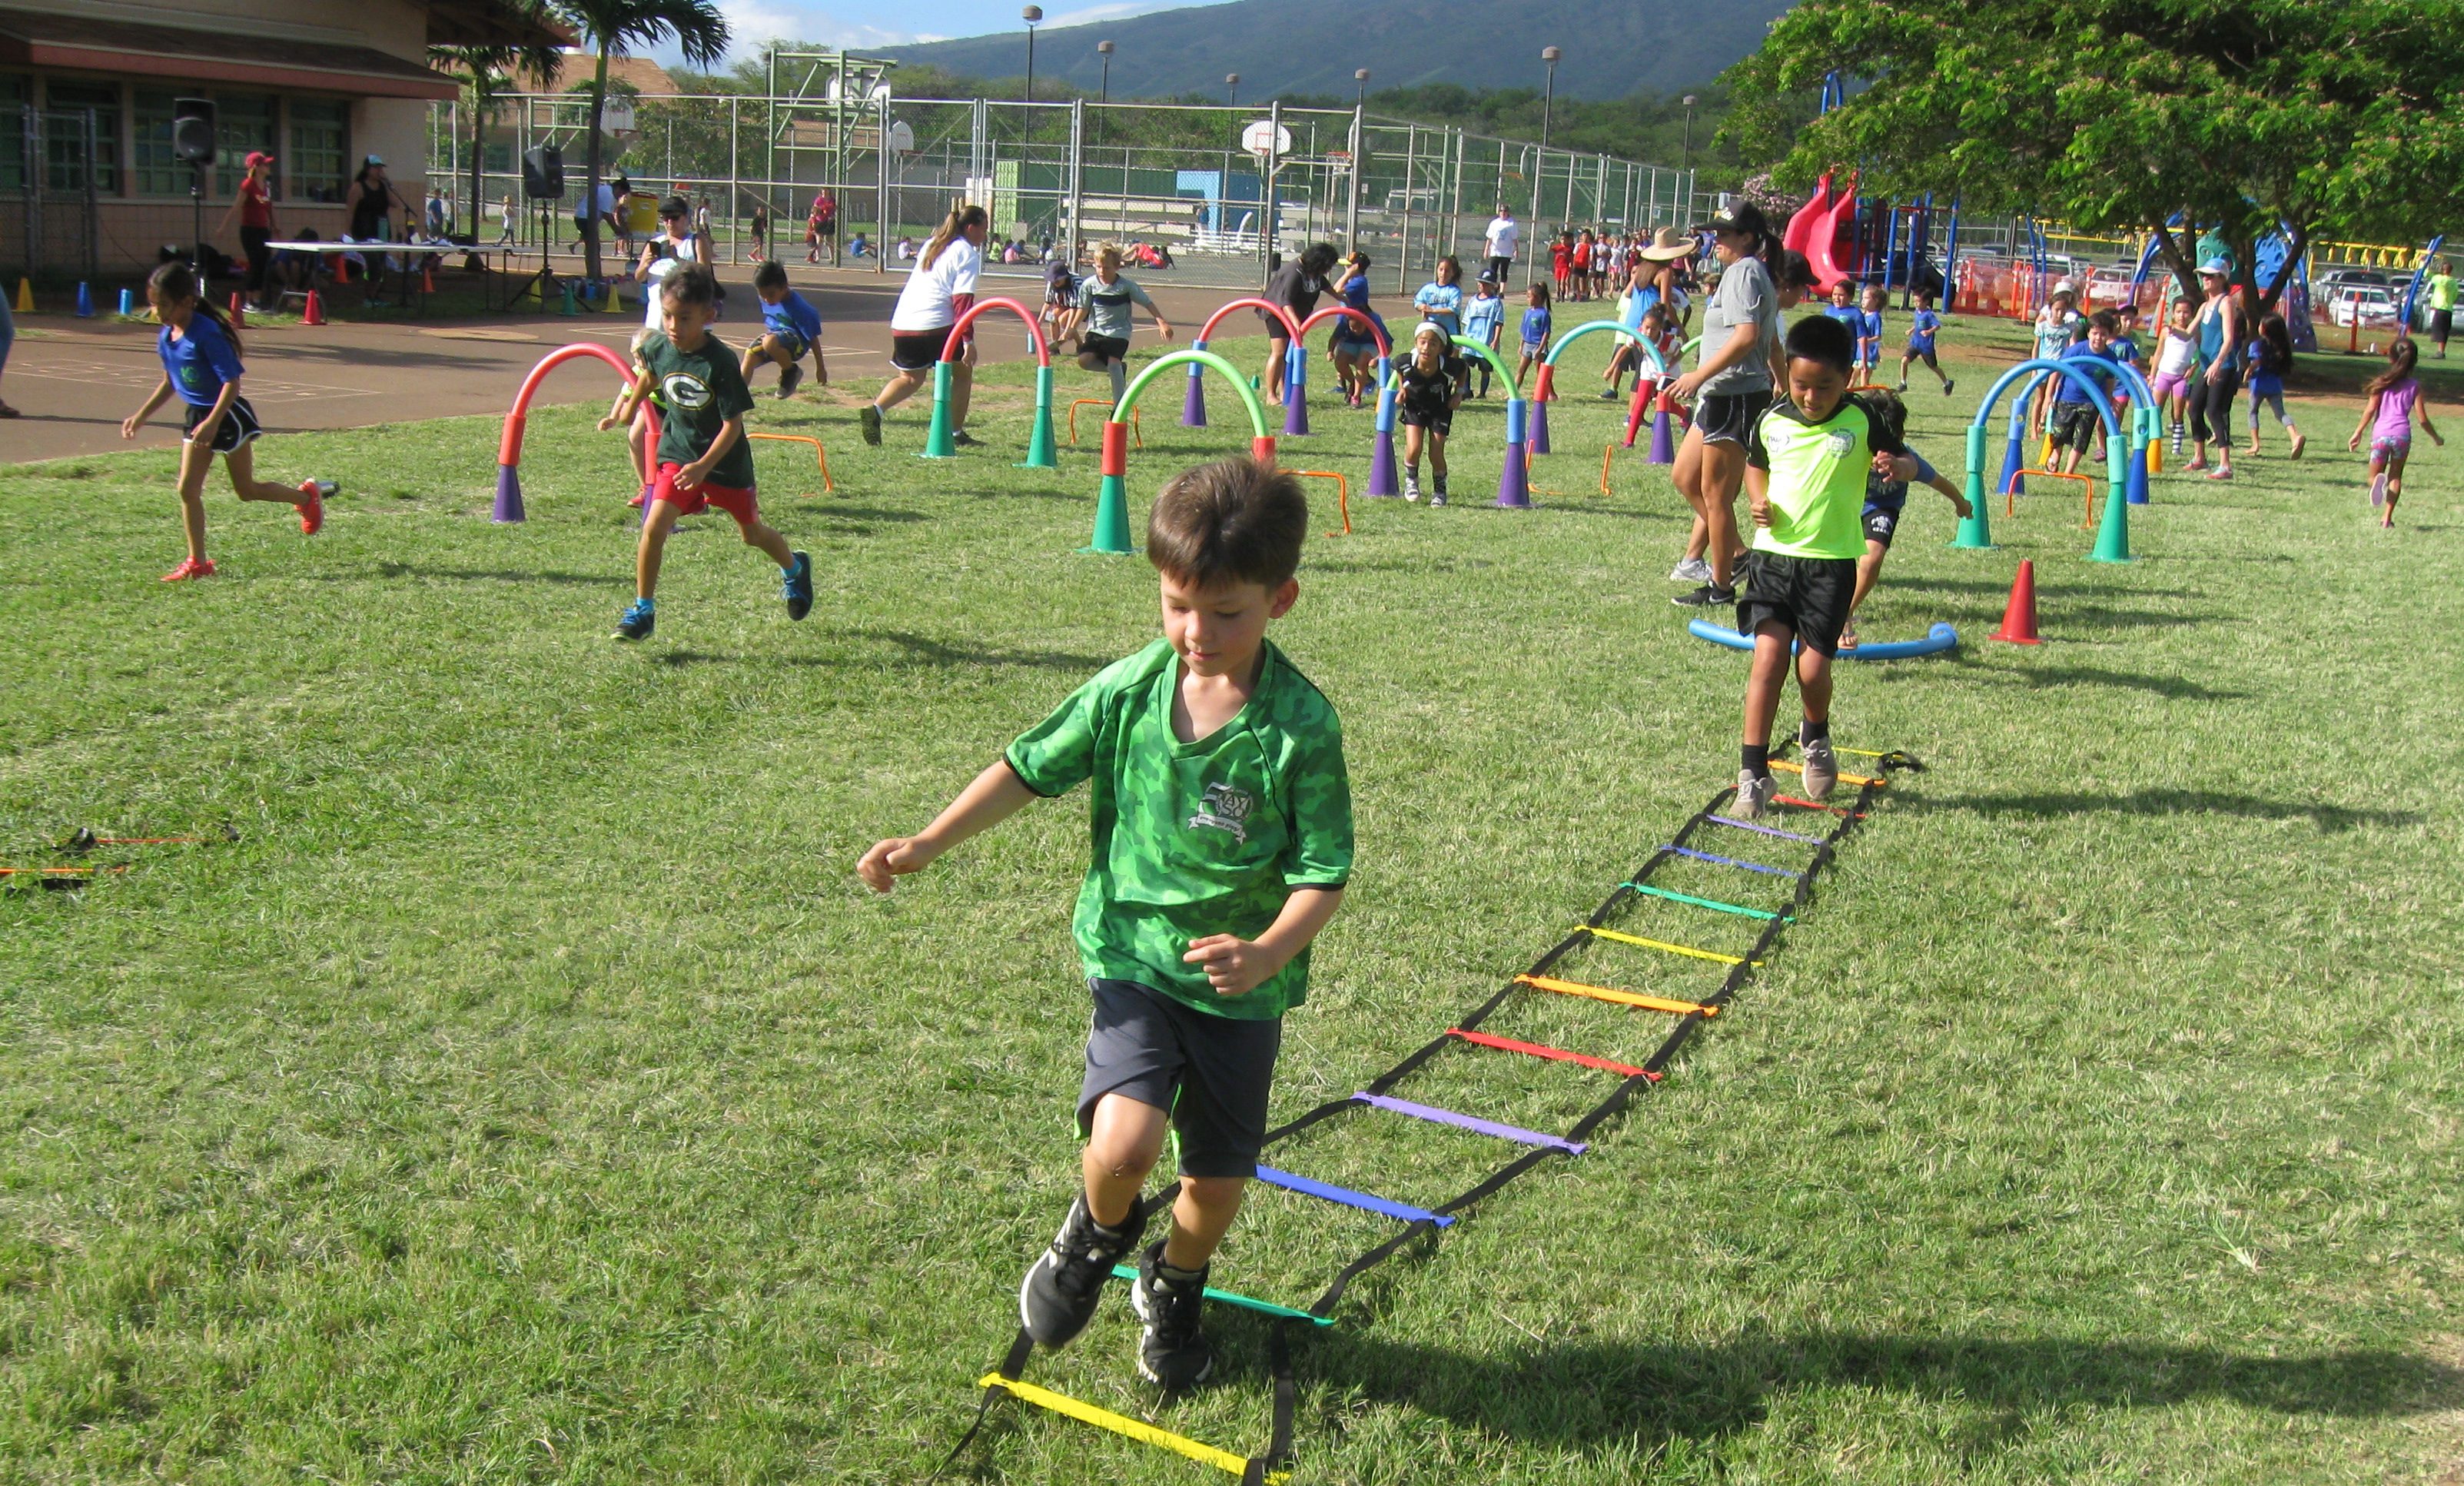
About Active Recess
Implementation of this voluntary school-level intervention would occur in public elementary schools in Washington that provide recess but not Active Recess strategies. It would include installation of playground markings, provision of portable play equipment, and/or provision of structured activities designed to increase students’ activity levels during school recess time. Through grant proposals, school personnel and parent volunteers would support creation of playground markings for structured games for the children to be physically active (e.g., four square, hop-scotch) and each participating school would receive portable playground equipment to be used during recess time.
Comparing Costs and Outcomes
CHOICES cost-effectiveness analysis compared the costs and outcomes of Active Recess over 10 years (2015-2025) with costs and outcomes associated with not implementing the program. The approach assumes that 90% of children attend schools without an Active Recess program, and 100% of these schools adopt Active Recess practices where all students benefit.
Implementing Active Recess in Washington is an investment in the future. By the end of 2025: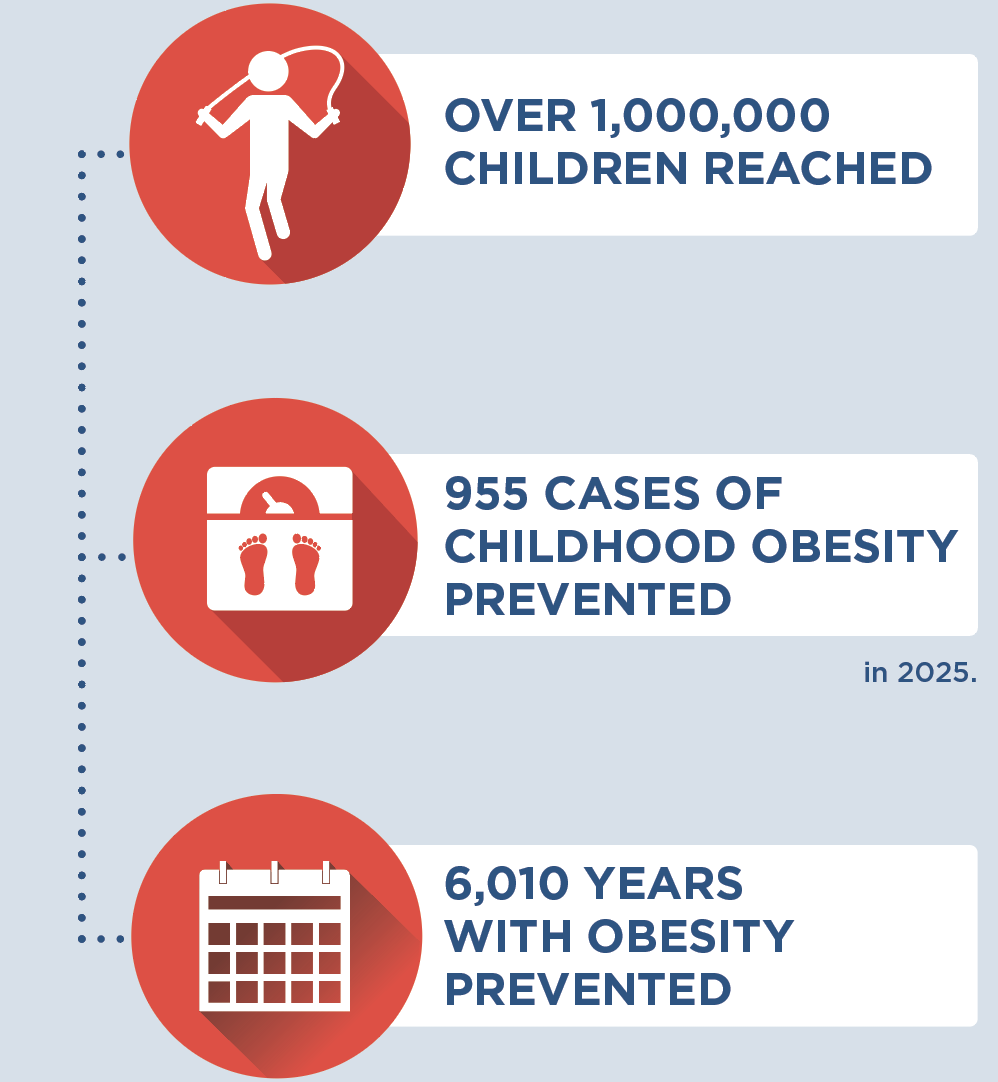 |
Conclusions and Implications
Every child deserves a healthy start in life. This includes ensuring that all kids have the same opportunities to be physically active during recess, no matter where they live or where they go to school. A state-level program in Washington to assist public elementary schools invest in equipment and resources to increase physical activity during recess may be a cost-effective strategy for reducing obesity at $23.30 per child. This intervention would prevent 955 cases of childhood obesity in 2025 and provide the opportunity for over 1 million children to engage in active recess opportunities. There are also likely positive benefits from physical activity related to cognition and academic performance which are not quantified in this analysis, but may result in additional cost savings.10,11,12
For every $1.00 spent on implementing the Active Recess intervention, we would save $0.10 in health care costs. These results reinforce the importance of investing in prevention efforts to reduce the prevalence of obesity. Shortchanging prevention efforts can lead to more costly and complicated treatment options in the future. Introducing small changes to school-aged children can inform healthy habits that carry into adulthood.
Evidence is growing about how to help children achieve a healthy weight. Interventions such as Active Recess are laying the foundation for a healthier future by helping schools create environments that nurture healthy habits. Leaders at the federal, state, and local level should use the best available evidence to help children eat healthier diets and be more active.
References
- Flegal KM, Kruszon-Moran D, Carroll MD, Fryar CD, Ogden CL. Trends in Obesity Among Adults in the United States, 2005 to 2014. JAMA, 2016;315(21), 2284-91.
- Finkelstein EA, Trogdon JG, Cohen JW, Dietz W. Annual Medical Spending Attributable To Obesity: Payer-And Service-Specific Estimates. Health Affairs. 2009;28(5).
- Gortmaker SL, Claire Wang Y, Long MW, Giles CM, Ward ZJ, Barrett JL, Kenney EL, Sonneville KR, Afzal AS, Resch SC, Cradock AL. Three Interventions That Reduce Childhood Obesity Are Projected to Save More Than They Cost to Implement. Health Affairs, 34, no. 11 (2015):1304-1311.
- Howard K & Rakoz L. Survey Regarding Recess Periods for Elementary School Students: Report to the Legislature. Office of Superintendent of Public Instruction, Dec 2009. http://www.k12.wa.us/LegisGov/2009documents/RecessPeriodsforElementarySchoolStudents.pdf
- Parsad B & Lewis L .Calories In, Calories Out: Food and Exercise in Public Elementary Schools, 2005, National Center for Education Statistics, U.S. Department of Education Report No. NCES 2006–057, (2006). https://nces.ed.gov/pubs2006/2006057.pdf. Accessed January 24, 2017.
- Centers for Disease Control and Prevention. The Association Between School-Based Physical Activity, Including Physical Education, and Academic Performance. Atlanta, GA: U.S. Department of Health and Human Services; (2010). https://www.cdc.gov/healthyyouth/health_and_academics/pdf/pa-pe_paper.pdf. Accessed January 24, 2017.
- Robert Wood Johnson Foundation. Recess Rules: Why the Undervalued Playtime May Be America’s Best Investment for Healthy Kids and Healthy Schools. Princetown, NJ: Robert Wood Johnson Foundation; 2007.
- National Association for Sport and Physical Education. Recess for Elementary School Students: A Position Paper, Council on Physical Education for Children Report, (2006). http://files.eric.ed.gov/fulltext/ED497155.pdf. Accessed January 24, 2017.
- Stratton G. Promoting Children’s Physical Activity in Primary School: An Intervention Study Using Playground Markings. Ergonomics, 2000, 43(10), 538-1546.
- Lees C & Hopkins J. Effect of Aerobic Exercise on Cognition, Academic Achievement, and Psychosocial Function in Children: A Systematic Review of Randomized Control Trials. Prev Chronic Dis, 2013, 10, E174.
- Fedewa AL & Ahn S. The Effects of Physical Activity and Physical Fitness on Children’s Achievement and Cognitive Outcomes: A Meta-Analysis. Res Q Exerc Sport. 2011, 82(3), 521–535.
- IOM. Educating the Student Body: Taking Physical Activity and Physical Education to School. Washington, DC: National Academies Press; 2013.
Suggested Citation:Cradock AL, Gortmaker SL, Pipito A, Kenney EL, Giles CM. Washington: Active Recess Intervention {Issue Brief}. Washington State Department of Health, Olympia, WA, and the CHOICES Learning Collaborative Partnership at the Harvard T.H. Chan School of Public Health, Boston, MA; August 2017. |
|
The design for this brief and its graphics were developed by Molly Garrone, MA and partners at Burness. This issue brief was developed at the Harvard T.H. Chan School of Public Health in collaboration with the Washington State Department of Health through participation in the Childhood Obesity Intervention Cost-Effectiveness Study (CHOICES) Learning Collaborative Partnership. This brief is intended for educational use only. Funded by The JPB Foundation. Results are those of the authors and not the funders. For more information, please visit: http://www.doh.wa.gov/CommunityandEnvironment/HealthiestNextGeneration/CHOICES |
Brief: Nutrition and Physical Activity Self-Assessment for Child Care (NAP SACC) Intervention in Oklahoma

The information in this brief is intended for educational use only.
This brief summarizes the CHOICES Learning Collaborative Partnership simulation model of the impact of integrating the Nutrition and Physical Activity Self-Assessment for Child Care (NAP SACC) program into Oklahoma’s Reaching for the Stars Quality Rating and Improvement System. Child care programs achieving Level 2 or higher would complete NAP SACC.
The Issue
Over the past three decades, more and more people have developed obesity.1 Today, nearly nine percent of 2-5 year olds have obesity.2 Now labeled as an epidemic, health care costs for treating obesity-related health conditions such as heart disease and diabetes were $147 billion in 2008.3 While multiple strategies are needed to reverse the epidemic, emerging prevention strategies directed at children show great promise.4 A large body of evidence shows that healthy eating, physical activity, and limited time watching TV helps kids grow up at a healthy weight.
In Oklahoma, 41% of 2-5 year olds attend a licensed child care center or family child care home, and most of them attend a program involved in Reaching for the Stars.5 Child care programs can offer healthy, nurturing environments for children; Reaching for the Stars can encourage and empower programs to voluntarily improve nutrition, physical activity, and screen time standards.
About NAP SACC and Reaching for the Stars
NAP SACC is an evidence-based, trusted intervention for helping child care programs improve their practices regarding nutrition, active play, and screen time and has demonstrated impacts on reducing childhood obesity.6,7 In NAP SACC, child care directors complete self-assessments of their nutrition, active play, and screen time practices and receive training and technical assistance to implement changes that create healthier environments. Integrating NAP SACC into Reaching for the Stars would incentivize and support participation in the program and broaden its availability.
Comparing Costs and Outcomes
CHOICES cost-effectiveness analysis compared the costs and outcomes of integrating NAP SACC into Reaching for the Stars over 10 years with costs and outcomes associated with not implementing the program. This model assumes that 67% of OK children in child care centers and 36% in family child care homes attend a program at Level 2 or higher in Reaching for the Stars and thus will benefit. The model also accounts for swapping out some existing childhood obesity trainings for NAP SACC, making NAP SACC implementation a less costly approach.
Implementing NAP SACC in child care programs throughout Oklahoma is an investment in the future. By the end of 2025: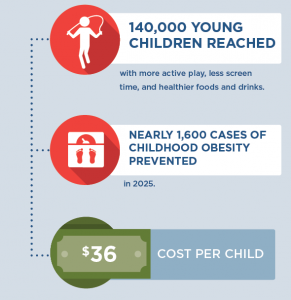 |
Conclusions and Implications
Every child deserves a healthy start in life. This includes ensuring that all kids in child care have opportunities to eat healthy foods and be physically active, no matter where they live or where they go for child care. A state-level initiative to bring NAP SACC to Oklahoma’s child care programs through Reaching for the Stars could prevent almost 1,600 cases of childhood obesity in 2025 and ensure healthy child care environments for 140,000 of Oklahoma’s young children.
For every $1.00 spent on implementing NAP SACC in Reaching for the Stars, we would save $0.15 in health care costs. These results reinforce the importance of investing in prevention efforts, relative to other treatment interventions, to reduce the prevalence of obesity. Shortchanging prevention efforts can lead to more costly and complicated treatment options in the future, whereas introducing small changes to young children can help them develop healthy habits for life.
Evidence is growing about how to help children achieve a healthy weight. Programs such as NAP SACC are laying the foundation for a healthier future by helping child care providers create environments that nurture healthy habits. Leaders at the federal, state, and local level should use the best available evidence to determine which evidence-based programs and policies hold the most promise to help children eat healthier diets and be more active.
References
- Flegal KM, Kruszon-Moran D, Carroll MD, Fryar CD, Ogden CL. Trends in Obesity Among Adults in the United States, 2005 to 2014. JAMA. 2016 Jun 7;315(21):2284-91.
- Ogden CL, Carroll MD, Lawman HG, Fryar CD, Kruszon-Moran D, Kit BK, Flegal KM. Trends in obesity prevalence among children and adolescents in the United States, 1988-1994 through 2013-2014. JAMA. 2016 Jun 7;315(21):2292-9.
- Finkelstein EA, Trogdon JG, Cohen JW, Dietz W. Annual Medical Spending Attributable To Obesity: Payer-And Service-Specific Estimates. Health Affairs. 2009;28(5).
- Gortmaker SL, Wang YC, Long MW, Giles CM, Ward ZJ, Barrett JL, Kenney EL, Sonneville KR, Afzal AS, Resch SC, Cradock AL. Three interventions that reduce childhood obesity are projected to save more than they cost to implement. Health Aff (Millwood). 2015 Nov;34(11):1932-9.
- Oklahoma Department of Health Services (DHS). Early Care & Education Licensing Database (2016)
- Ward DS, Benjamin SE, Ammerman AS, Ball SC, Neelon BH, Bangdiwala SI. Nutrition and physical activity in child care: results from an environmental intervention. Am J Prev Med. 2008 Oct;35(4):352-6.
- Alkon A, Crowley AA, Neelon SE, Hill S, Pan Y, Nguyen V, Rose R, Savage E, Forestieri N, Shipman L, Kotch JB. Nutrition and physical activity randomized control trial in child care centers improves knowledge, policies, and children’s body mass index. BMC Public Health. 2014 Mar 1;14:215.
Suggested Citation:Macedo C, Case S, Simpson K, Khan F, U’ren S, Giles CM, Flax CN, Cradock AL, Gortmaker SL, Ward ZJ, Kenney EL. Oklahoma: Nutrition and Physical Activity Self-Assessment For Child Care (NAP SACC) Intervention {Issue Brief}. Oklahoma State Department of Health and Oklahoma State Department of Human Services, Oklahoma City, OK, and the CHOICES Learning Collaborative Partnership at the Harvard T.H. Chan School of Public Health, Boston, MA; October 2017. |
The design for this brief and its graphics were developed by Molly Garrone, MA and partners at Burness.
This issue brief was developed at the Harvard T.H. Chan School of Public Health in collaboration with the Oklahoma Department of Health and Human Services through participation in the Childhood Obesity Intervention Cost-Effectiveness Study (CHOICES) Learning Collaborative Partnership. This brief is intended for educational use only. Funded by The JPB Foundation. Results are those of the authors and not the funders.
Brief: Nutrition and Physical Activity Self-Assessment for Child Care (NAP SACC) Intervention in New Hampshire

The information in this brief is intended for educational use only.
This brief summarizes a CHOICES Learning Collaborative Partnership simulation model in New Hampshire examining a potential strategy to expand child care providers’ access to the Nutrition and Physical Activity Self-Assessment for Child Care (Go NAP SACC) by targeting the state’s largest providers via contracted training and technical assistance.
The Issue
Over the past three decades, more and more people have developed obesity.1 Today, nearly nine percent of 2-5 year olds have obesity.2 Now labeled as an epidemic, health care costs for treating obesity-related conditions such as heart disease and diabetes were $147 billion in 2008.3 While multiple strategies are needed to reverse the epidemic, emerging prevention strategies directed at children show great promise.4 A large body of evidence shows that healthy eating, physical activity, and less time watching TV helps kids grow up at a healthy weight.
In New Hampshire, 40% of 2-5 year olds attend licensed child care centers; 24% attend a large center or family child care program.5 Making NAP SACC more available can encourage and empower programs to voluntarily improve nutrition, physical activity, and screen time standards.
About NAP SACC and Expanding Access for NH Child Care Programs
Go NAP SACC is an evidence-based, trusted intervention that helps child care programs improve practices for nutrition, active play, and screen time and can reduce childhood obesity.6,7 Child care providers complete self-assessments of their nutrition, active play, and screen time practices and receive training and technical assistance to implement self-selected changes to create healthier environments. Increasing the number of provider slots offered through a contract with child care training and technical assistance specialists at Keene State College, managed by New Hampshire’s Department of Health and Human Services, Division of Public Health Services (DPHS), could broaden the current reach of the Go NAP SACC project, allowing more licensed child care programs to improve nutrition and physical activity policies and practices. Currently, Keene State works with 22 child care providers. Since 2010, over ninety licensed child care programs, caring for nearly 8,000 children, have participated in DPHS funded opportunities to improve 465 nutrition and physical activity policies and practices.
Comparing Costs and Outcomes
CHOICES cost-effectiveness analysis compared the costs and outcomes of expanding New Hampshire’s NAP SACC program led by partners at Keene State College over 10 years.
Implementing NAP SACC in New Hampshire’s largest child care programs is an investment in the future. By the end of 2025: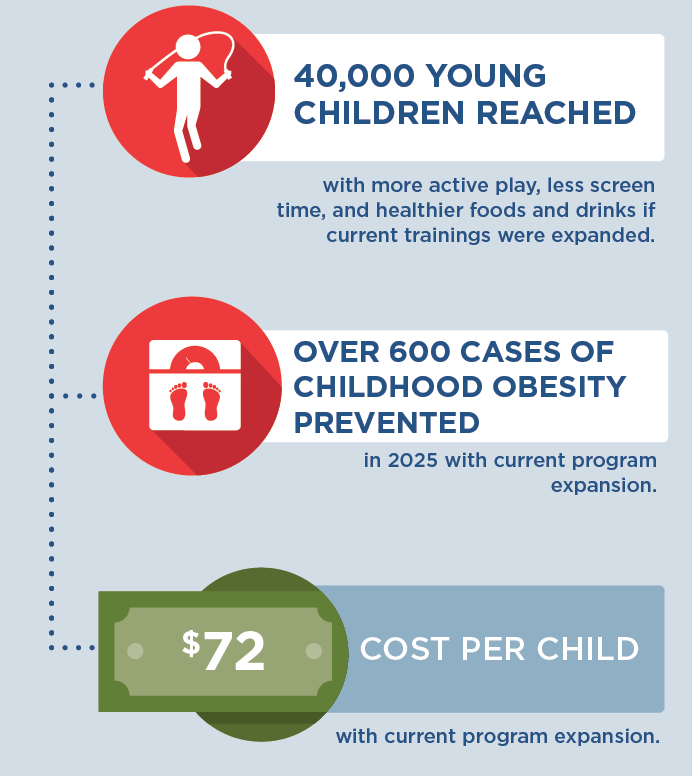 |
Conclusions and Implications
Every child deserves a healthy start in life. This includes ensuring that all kids in child care have opportunities to eat healthy foods and be physically active, no matter where they live or where they go for child care. A state-level initiative to bring NAP SACC to New Hampshire’s largest child care programs by expanding its current opportunities could prevent over 600 cases of childhood obesity in 2025 and ensure healthy child care environments for 40,000 young children.
A separate model examined the potential for expanding access to Go NAP SACC via the state’s Quality Rating Improvement System, which is a single-tiered system referred to as Licensed Plus. While such an initiative could be a useful policy tool for creating sustainable access to Go NAP SACC for NH child care providers, the results of that model indicated that fewer children (12,000) would be reached and fewer cases of obesity prevented in 2025 (100) at a slightly higher cost per child ($81). The results of the two models suggest that New Hampshire’s current contracted strategy targeting the state’s largest providers may be more cost-effective. Results from both models reinforce the importance of investing in prevention efforts to reduce the prevalence of obesity. Shortchanging prevention efforts can lead to more costly and complicated treatment options in the future, whereas introducing small changes to young children can help them develop healthy habits for life.
The first few years of childhood may be the best time to promote healthy eating behaviors in children. Programs such as Go NAP SACC lay the foundation by helping child care providers create environments to nurture healthy eating habits and increase opportunities for physical activity for all of the children.
References
- Flegal KM, Kruszon-Moran D, Carroll MD, Fryar CD, Ogden CL. Trends in Obesity Among Adults in the United States, 2005 to 2014. JAMA. 2016 Jun 7;315(21):2284-91.
- Ogden CL, Carroll MD, Lawman HG, Fryar CD, Kruszon-Moran D, Kit BK, Flegal KM. Trends in obesity prevalence among children and adolescents in the United States, 1988-1994 through 2013-2014. JAMA. 2016 Jun 7;315(21):2292-9.
- Finkelstein EA, Trogdon JG, Cohen JW, Dietz W. Annual Medical Spending Attributable To Obesity: Payer-And Service-Specific Estimates. Health Affairs. 2009;28(5).
- Gortmaker SL, Wang YC, Long MW, Giles CM, Ward ZJ, Barrett JL, Kenney EL, Sonneville KR, Afzal AS, Resch SC, Cradock AL. Three interventions that reduce childhood obesity are projected to save more than they cost to implement. Health Aff (Millwood). 2015 Nov;34(11):1932-9.5
- Child Care Aware. State Child Care Facts in the State of New Hampshire, 2016. Accessed 8/17/17 at: http://childcareaware.org/wp-content/uploads/2016/08/New-Hampshire.pdf; Personal communication from NH Division of Public Health Services.
- Ward DS, Benjamin SE, Ammerman AS, Ball SC, Neelon BH, Bangdiwala SI. Nutrition and physical activity in child care: results from an environmental intervention. Am J Prev Med. 2008 Oct;35(4):352-6.
- Alkon A, Crowley AA, Neelon SE, Hill S, Pan Y, Nguyen V, Rose R, Savage E, Forestieri N, Shipman L, Kotch JB. Nutrition and physical activity randomized control trial in child care centers improves knowledge, policies, and children’s body mass index. BMC Public Health. 2014 Mar 1;14:215.
- Birch, L., Savage, J. S., & Ventura, A. (2007). Influences on the Development of Children’s Eating Behaviours: From Infancy to Adolescence. Canadian Journal of Dietetic Practice and Research : A Publication of Dietitians of Canada = Revue Canadienne de La Pratique et de La Recherche En Dietetique : Une Publication Des Dietetistes Du Canada, 68(1), s1–s56.
Suggested Citation:Kenney EL, Giles CM, Flax CN, Gortmaker SL, Cradock AL, Ward ZJ, Foster S, Hammond W. New Hampshire: Nutrition and Physical Activity Self-Assessment for Child Care (NAP SACC) Intervention {Issue Brief}. New Hampshire Department of Health and Human Services, Concord, NH, and the CHOICES Learning Collaborative Partnership at the Harvard T.H. Chan School of Public Health, Boston, MA; October 2017. |
The design for this brief and its graphics were developed by Molly Garrone, MA and partners at Burness.
This issue brief was developed at the Harvard T.H. Chan School of Public Health in collaboration with the New Hampshire Department of Health and Human Services through participation in the Childhood Obesity Intervention Cost-Effectiveness Study (CHOICES) Learning Collaborative Partnership. This brief is intended for educational use only. Funded by The JPB Foundation. Results are those of the authors and not the funders. For more information, please visit: https://www.dhhs.nh.gov