The CHOICES team partnered with the Maine-Harvard Prevention Research Center and the Maine Obesity Policy Committee to evaluate two state-level obesity prevention strategies– a sugar-sweetened beverage (SSB) excise tax and a policy removing SSBs as SNAP-eligible products. Both policies were estimated to save society more than they cost to implement. However, the SNAP restriction raised greater equity concerns among stakeholders.
Long MW, Polacsek M, Bruno P, Giles CM, Ward ZJ, Cradock AL, Gortmaker SL. Cost-Effectiveness Analysis and Stakeholder Evaluation of 2 Obesity Prevention Policies in Maine, US. J Nutr Educ Behav. 2019 Aug [Epub ahead of print], pii: S1499-4046(19)30922-4.
Obesity prevention is a priority item for many policymakers at the state level. The goal of this study was to not only predict the health impact of two obesity prevention policies in Maine, but also to gauge stakeholder interest and level of support for these policies.
Two obesity prevention policies were focused on:
– A $0.01/ounce sugar-sweetened beverage (SSB) excise tax for the state of Maine
– A Supplemental Nutrition Assistance Program (SNAP) policy that would not allow SSBs to be bought using SNAP money (SNAP SSB restriction policy)
The stakeholder engagement process developed over more than 10 years as a result of a relationship between the Maine Obesity Policy Committee (Maine OPC) and the Maine-Harvard Prevention Research Center (MHPRC). The Maine OPC consists of individuals from the Maine Public Health Association, American Heart Association of Maine, American Cancer Society, the State Department of Health and Human Services, legislators, lobbyists, and health systems. The stakeholder interview process was conducted in two phases: Phase 1 in 2013 focused on an SSB excise tax and Phase 2 in 2016 focused on a SNAP SSB restriction policy.
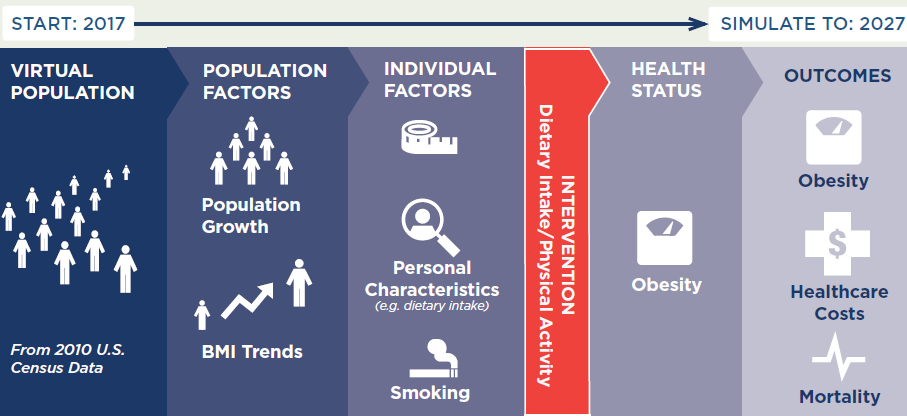
The study authors also measured the health impact of these two policies on a virtual population that was developed for the state of Maine. The CHOICES model was used to project these policies’ impact on obesity prevalence and health care costs over 10 years (2017-2027).
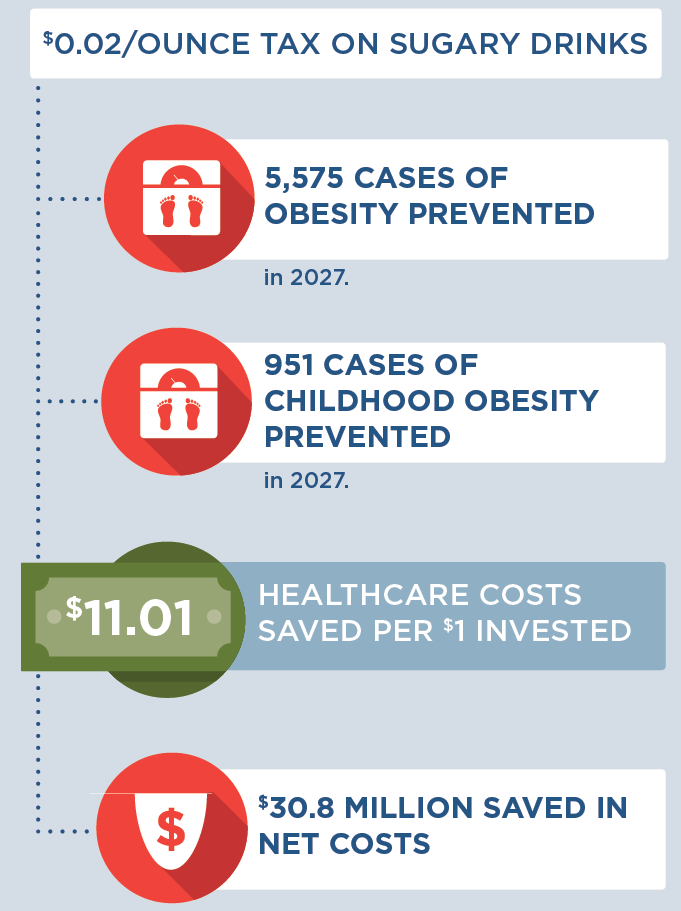
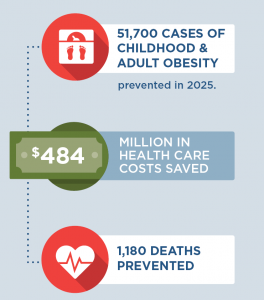
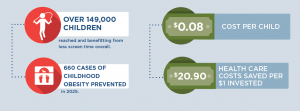
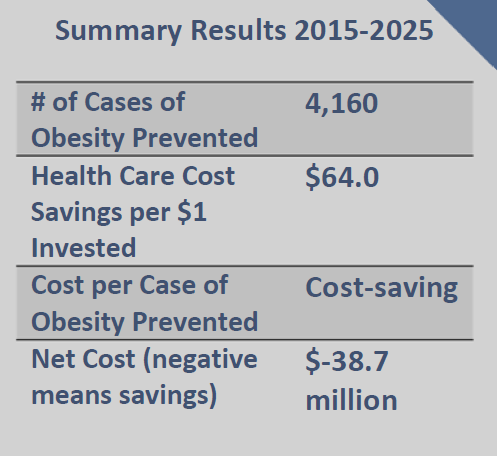
The results from the CHOICES model showed the potential for both health improvement and cost-savings. In particular:
Metric* |
$0.01/ounce SSB excise tax |
SNAP SSB restriction policy |
|---|---|---|
Health care cost savings |
$78.3 million | $15.3 million |
Quality-adjusted life years (QALYs) saved |
3,560 | 749 |
*For metric definitions, please visit the CHOICES Modeled Outputs Glossary
Study authors noted mixed levels of support for each policy by Maine stakeholders, with less support for the SNAP SSB restriction policy. Opposition to the SNAP restriction policy was based on concern that SNAP recipients were being unfairly targeted and stigmatized. This study used strategic science thinking to inform obesity prevention policy in Maine by strengthening the capacity of existing stakeholder groups and local applied researchers to integrate advanced cost-effectiveness modeling into their already well-developed policy input process. Results of the modeling were presented to the state’s legislature, which was holding hearings on a proposed SSB tax. This study points to the need for stronger, long-term partnerships between local public health researchers, cost-effectiveness modeling groups, and local policy stakeholder groups.

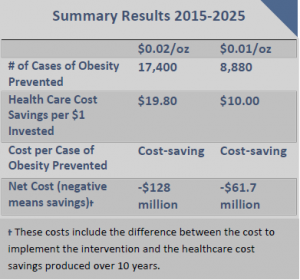
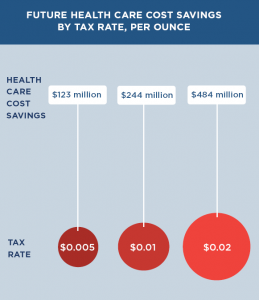
 Since the cost of a sugary drink excise tax is incorporated directly into the beverage’s sticker price, an excise tax will likely influence consumer purchasing decisions more than a comparable sales tax that is added onto the item at the register. We assume 100% pass-through of the tax over 10 years and assume the tax rate would be adjusted annually for inflation. Our pass-through rate estimate is supported by empirical studies of excise taxes in Mexico and France that demonstrate near-complete pass through rates to consumers.24 Short term studies for the local tax in Berkeley indicate imperfect, or less than 100%, pass-through.3,25,26 The expected change in sugary drink price was estimated using an average of $0.06/ounce based on national sugary drink prices.27 The price per ounce in this study was based on a weighted average of sugary drink consumption across stores, restaurants and other sources according to the estimates from the National Health and Nutrition Examination Survey (NHANES) 2009-2010. The price per ounce of sugary drinks purchased in stores was calculated using weighted averages of two-liter bottles, 12-can cases, and single-serve containers based on 2010 Nielsen Homescan data.27 For example, a $0.02/ounce tax would raise the price of a 12-ounce can of soda from $0.72 to $0.96/can post-tax.
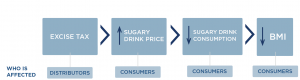
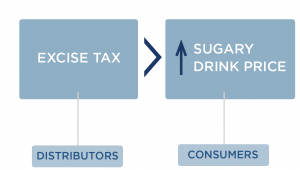
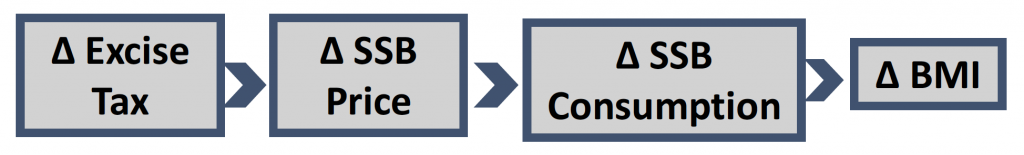
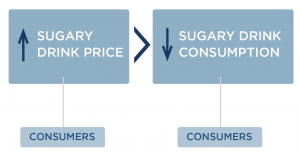 How does an excise tax on distributors affect the price paid by consumers?
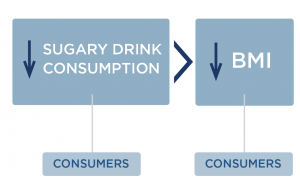
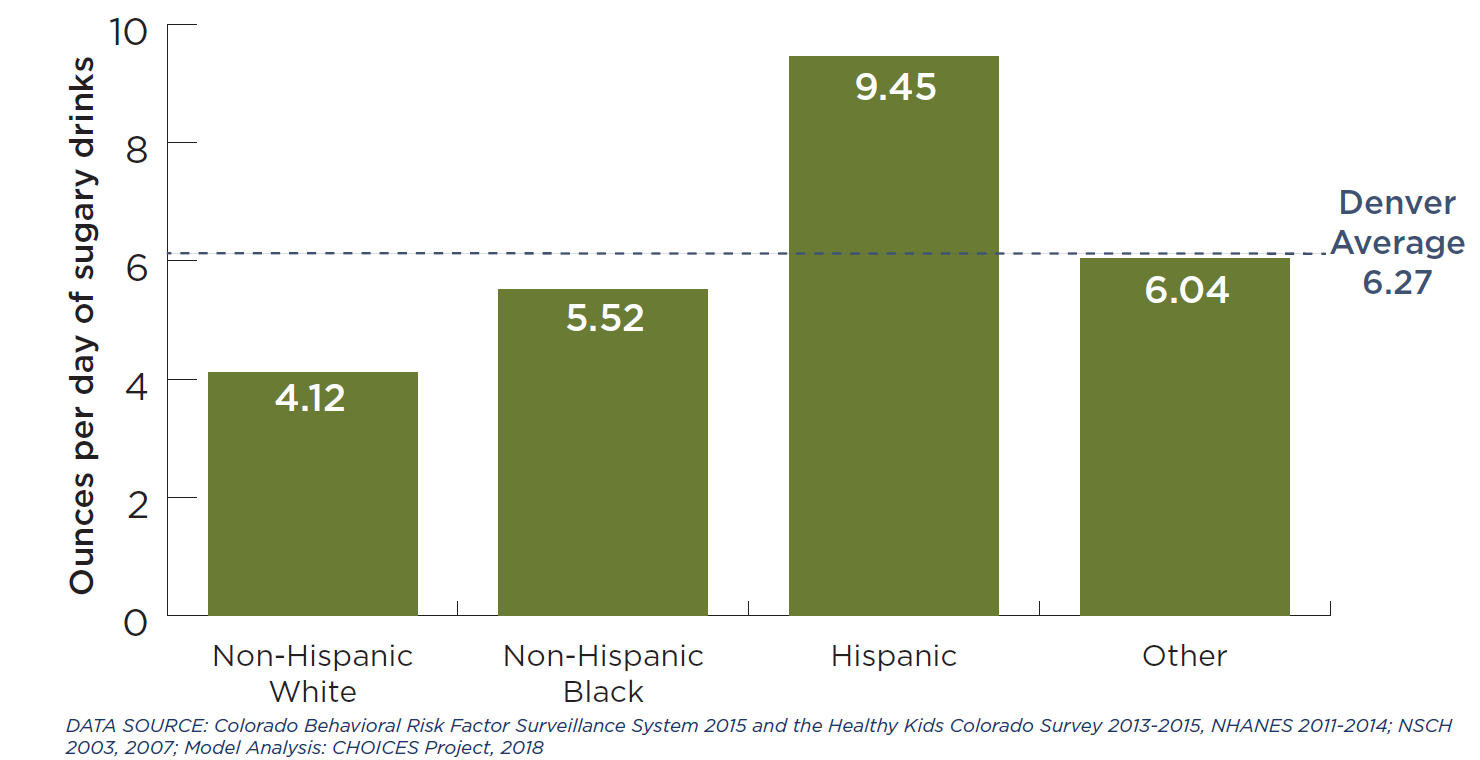
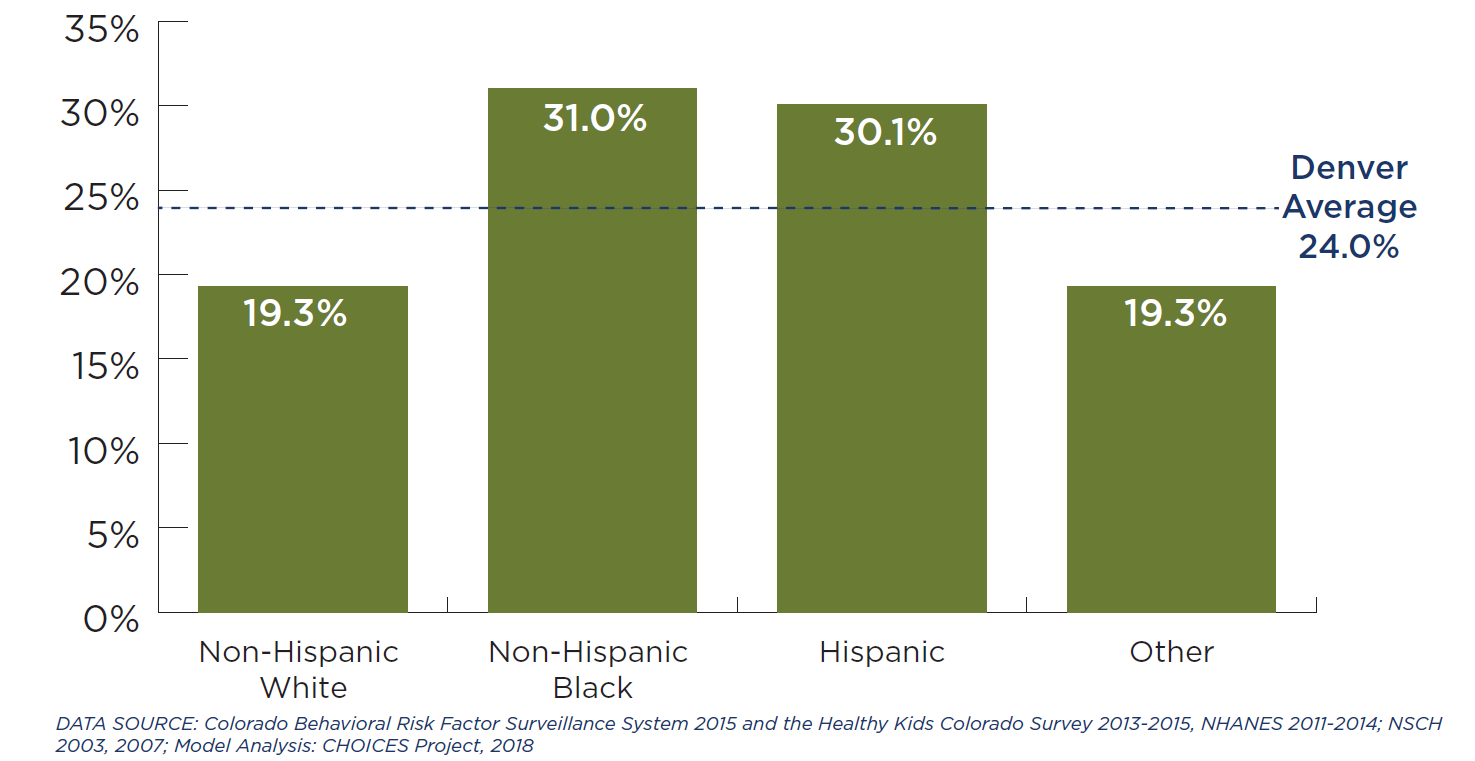
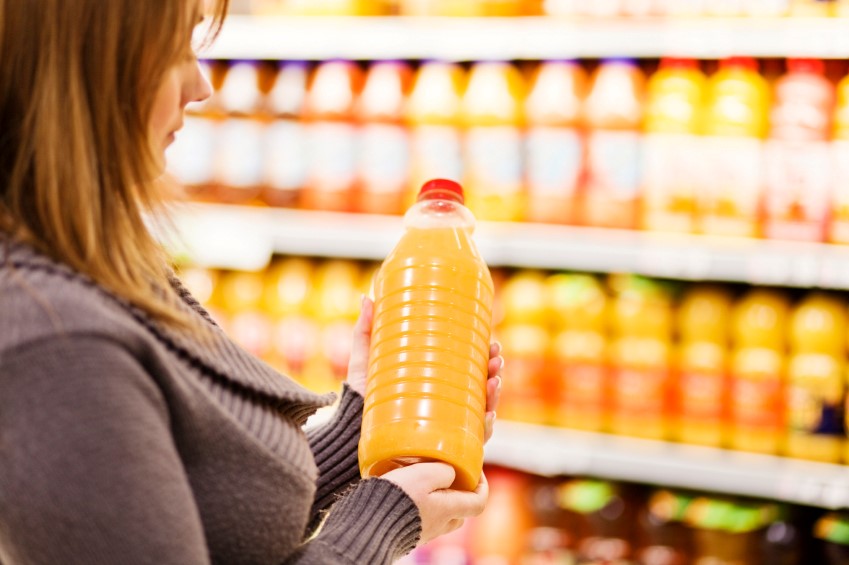
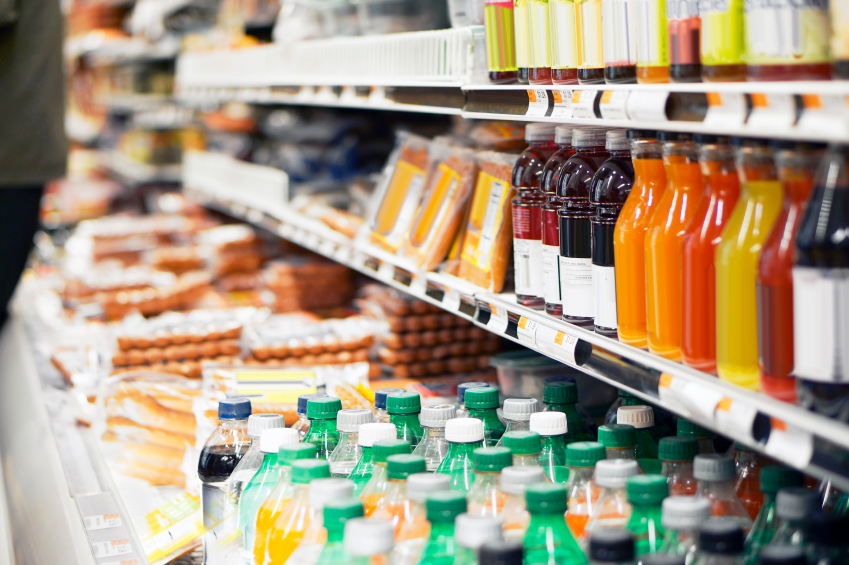
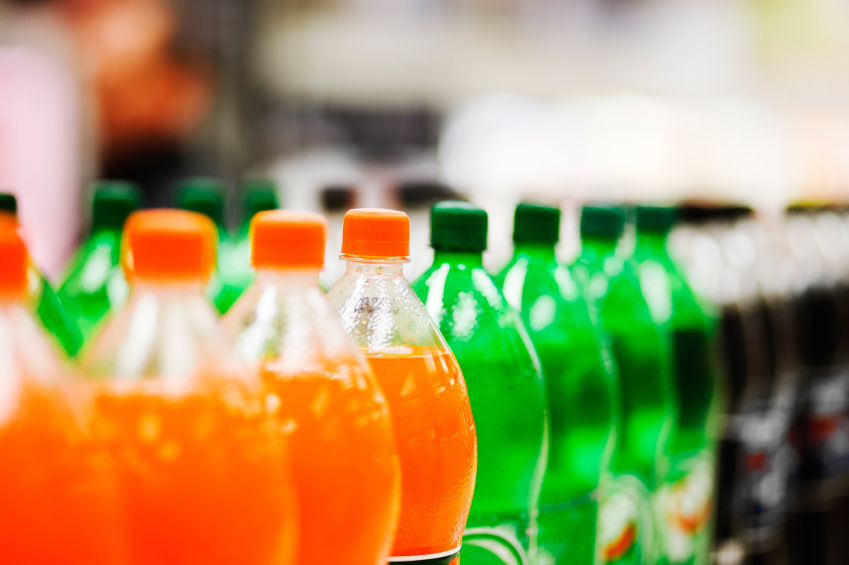
 Sugary drinks include all beverages with added caloric sweeteners. The modeled excise tax does not apply to 100% juice, milk products, or artificially-sweetened beverages. Although sugary drinks consumption has declined in recent years, adolescents and young adults in the United States consume more sugar than the Dietary Guidelines for Americans recommend, with persistent racial/ethnic disparities.5-8 Randomized trials and longitudinal studies have linked sugary drinks consumption to excess weight gain, diabetes, and cardiovascular disease. Consumption of sugary drinks increases the risk of chronic diseases through its impact on weight and other mechanisms.9,10 The Dietary Guidelines for Americans, 2015-202011 recommend that individuals reduce sugary drink intake in order to manage their body weight. Drawing on the success of tobacco taxation and decades of economic research, public health experts have studied taxes on sugary drinks and documented their likely impact.12-15 In 2009, the IOM recommended that local governments implement tax strategies to reduce consumption of “calorie-dense, nutrient-poor foods,” emphasizing sugary drinks as an appropriate target for taxation.16

 SSBs include all beverages with added caloric sweeteners. The modeled excise tax does not apply to 100% juice, milk products, or artificially-sweetened beverages. Although sugary drinks consumption has declined in recent years, adolescents and young adults in the United States consume more sugary drinks than the Dietary Guidelines for Americans recommends, with persistent racial/ethnic disparities.5-8 Randomized trials and longitudinal studies have linked SSB consumption to excess weight gain, diabetes, and cardiovascular disease. Consumption of SSBs increases the risk of chronic diseases through its impact on BMI and other mechanisms.9,10 The Dietary Guidelines for Americans, 201511 recommends that individuals reduce SSB intake in order to manage their body weight. Drawing on the success of tobacco taxation and decades of economic research, public health experts have called for higher taxes on SSBs and documented their likely impact.12-15 In 2009, the IOM recommended that local governments implement tax strategies to reduce consumption of “calorie-dense, nutrient-poor foods,” emphasizing SSBs as an apt target for taxation.16
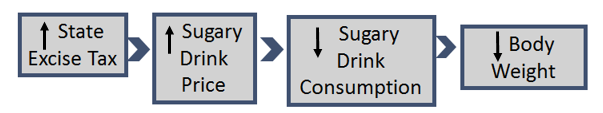


 Impact of Tax on Price to Consumers