In this advanced teaching case, which builds on Case 1, a fictional health department continues to work with the CHOICES Project’s Learning Collaborative Partnership to determine how to implement an evidence-based strategy that requires substantial investment, but they face a variety of additional challenges such as state politics and the complexities of health policy.


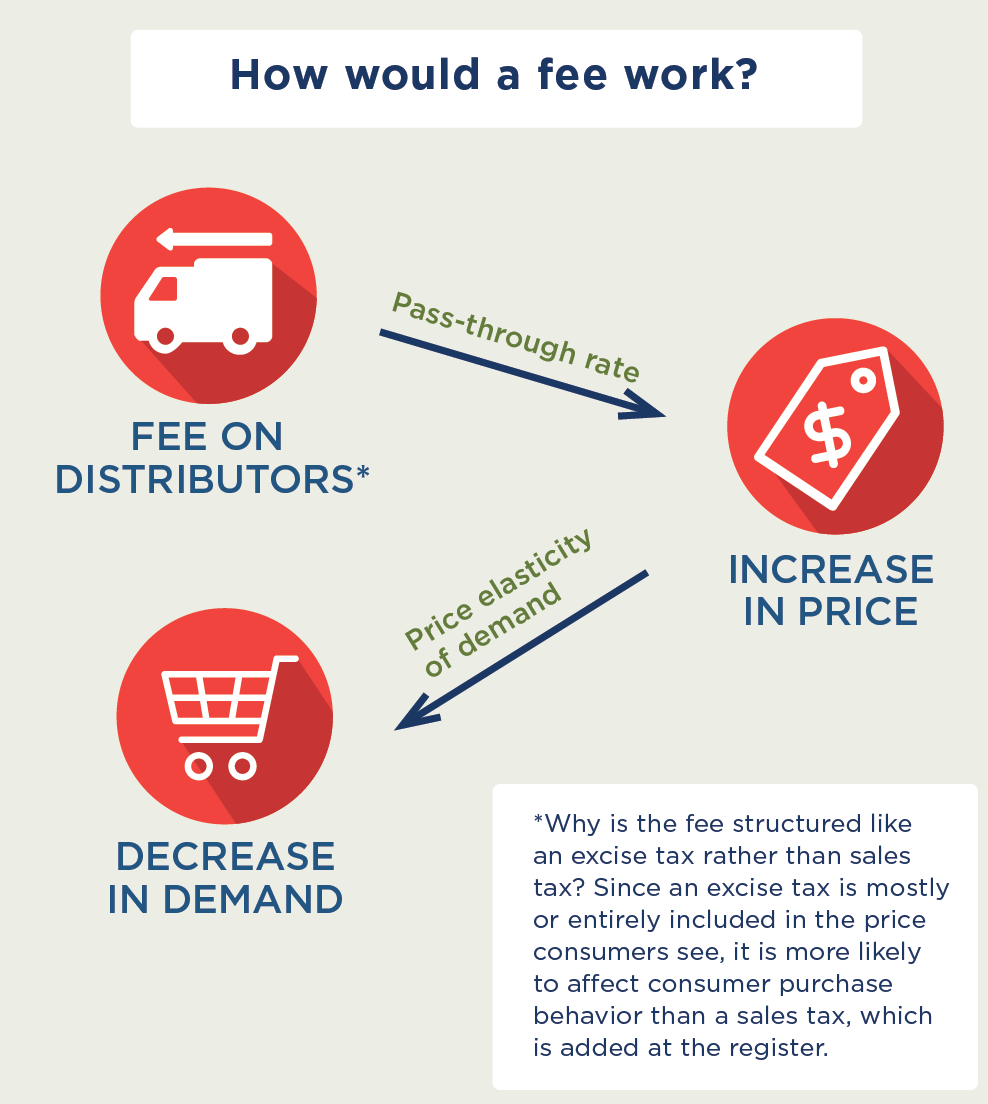
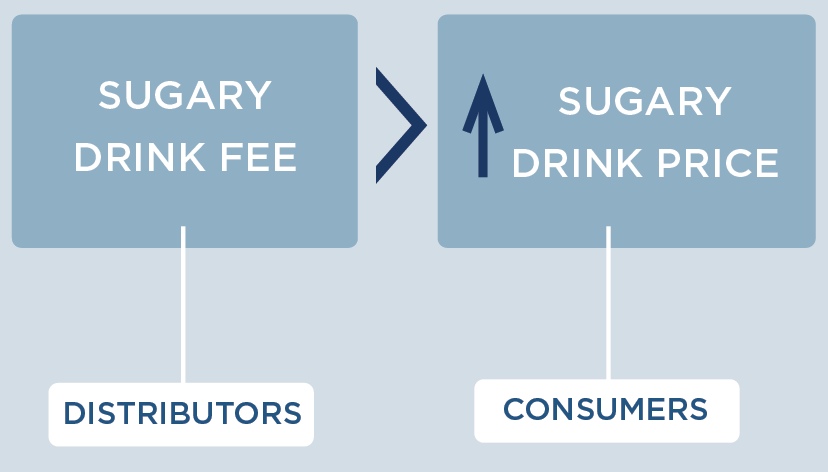
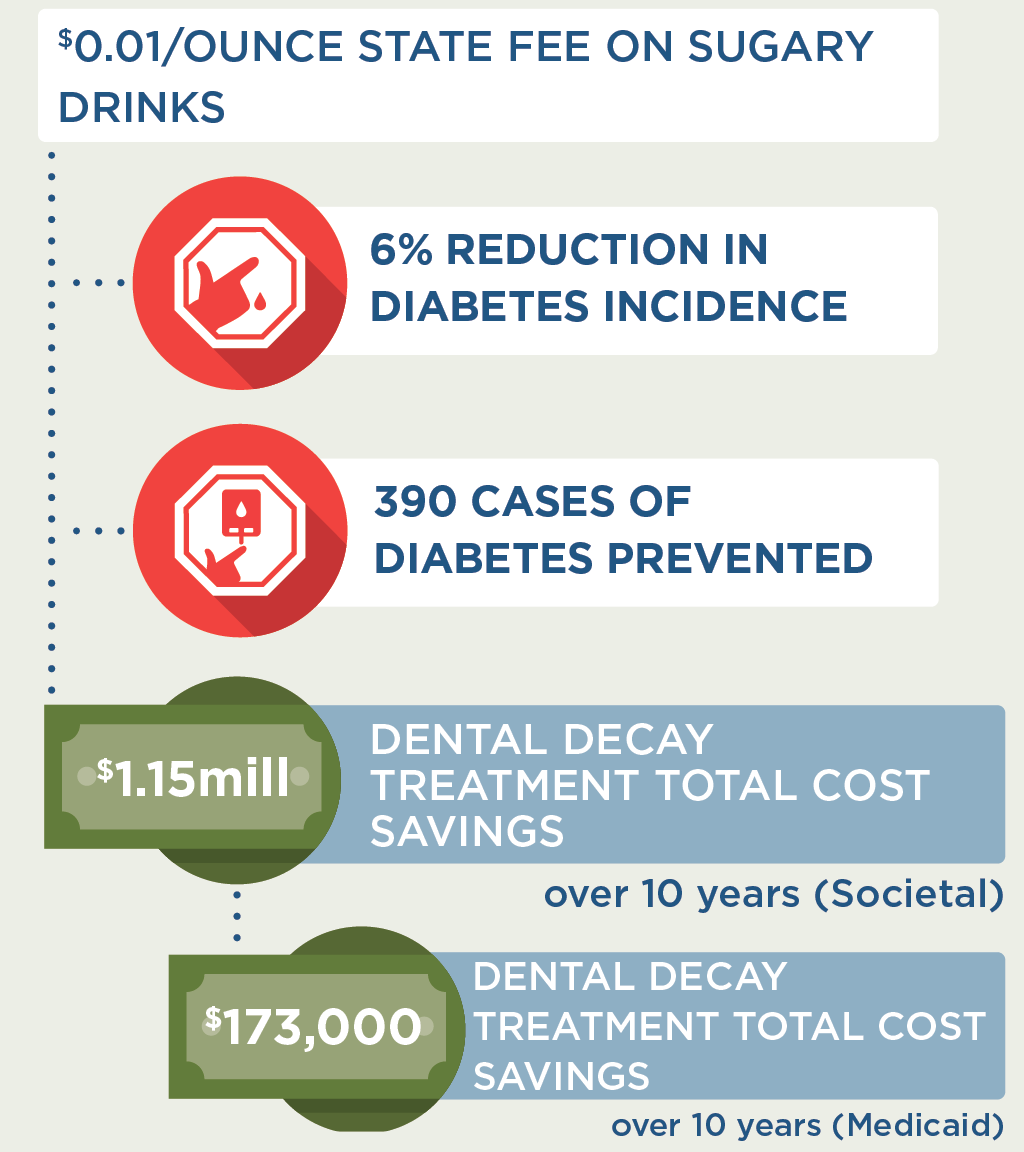
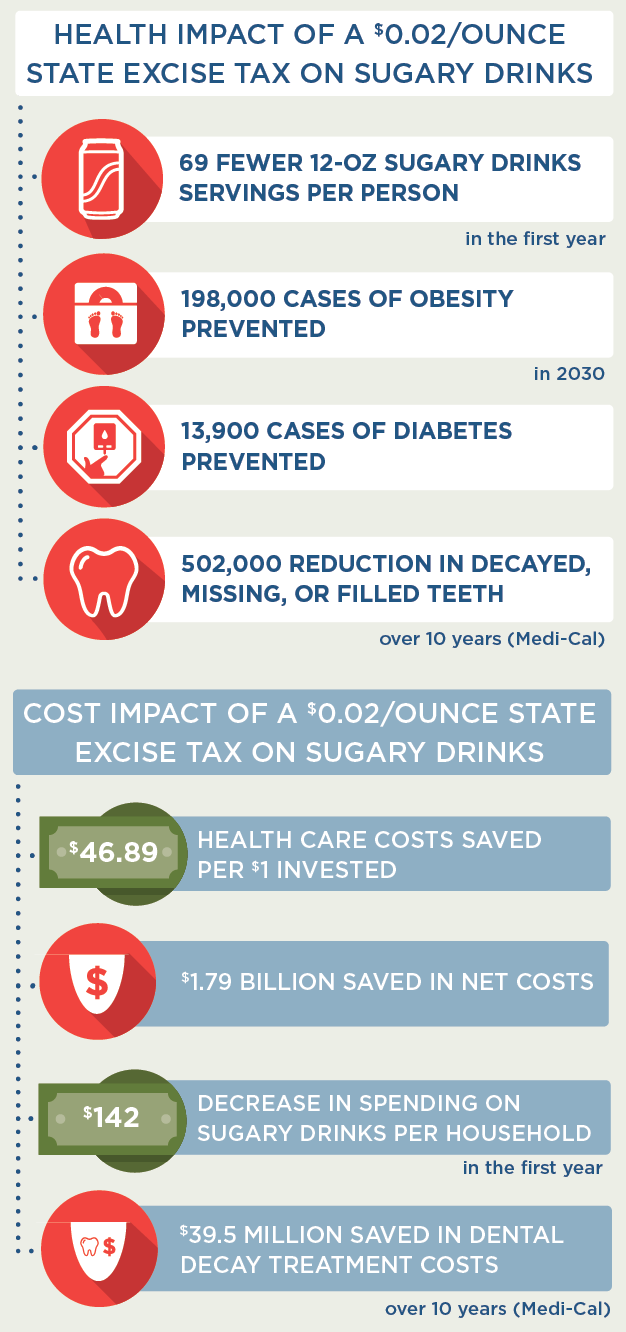
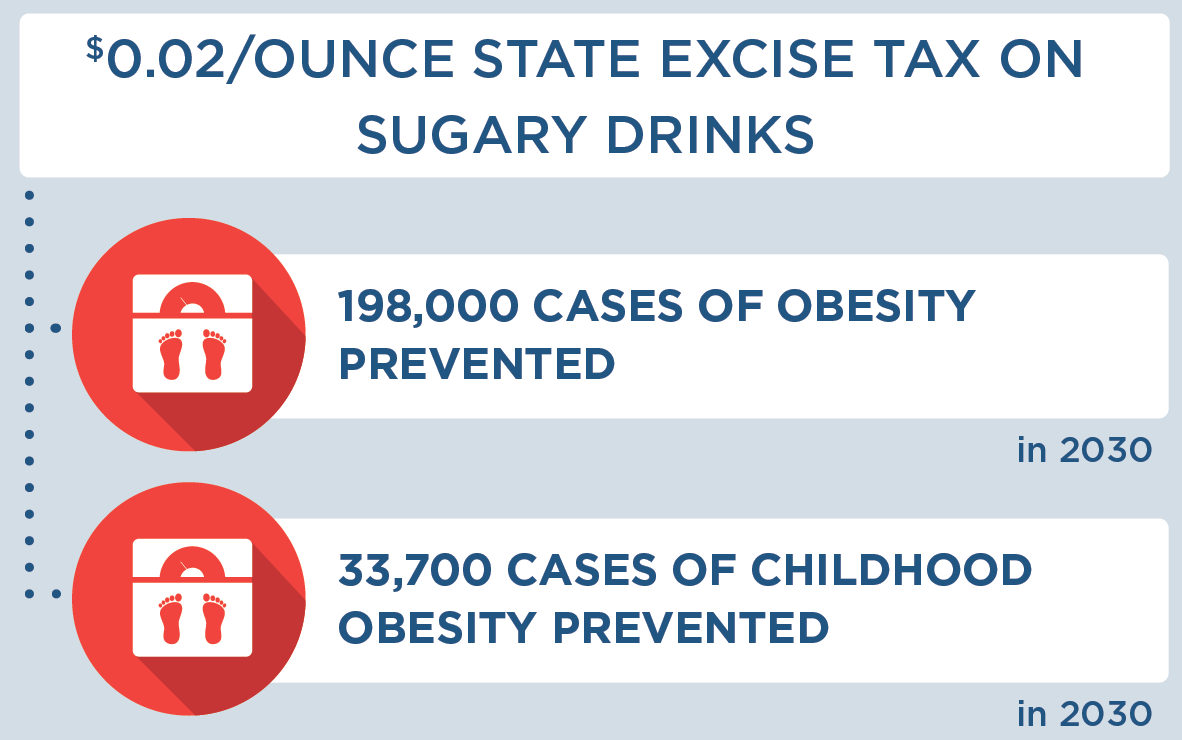
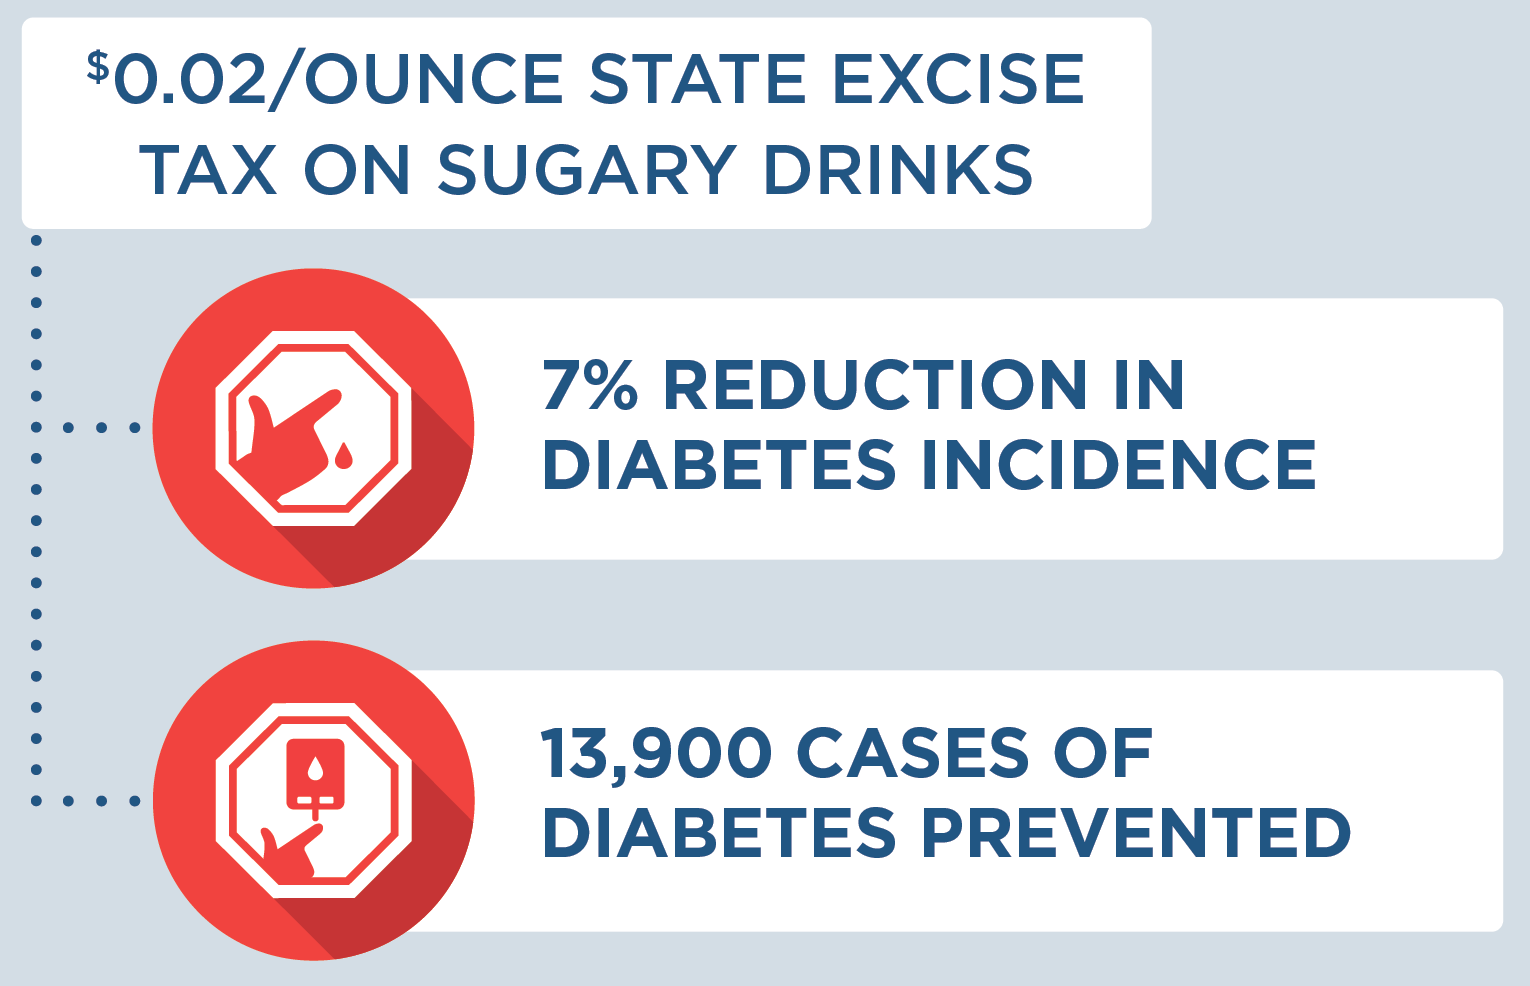
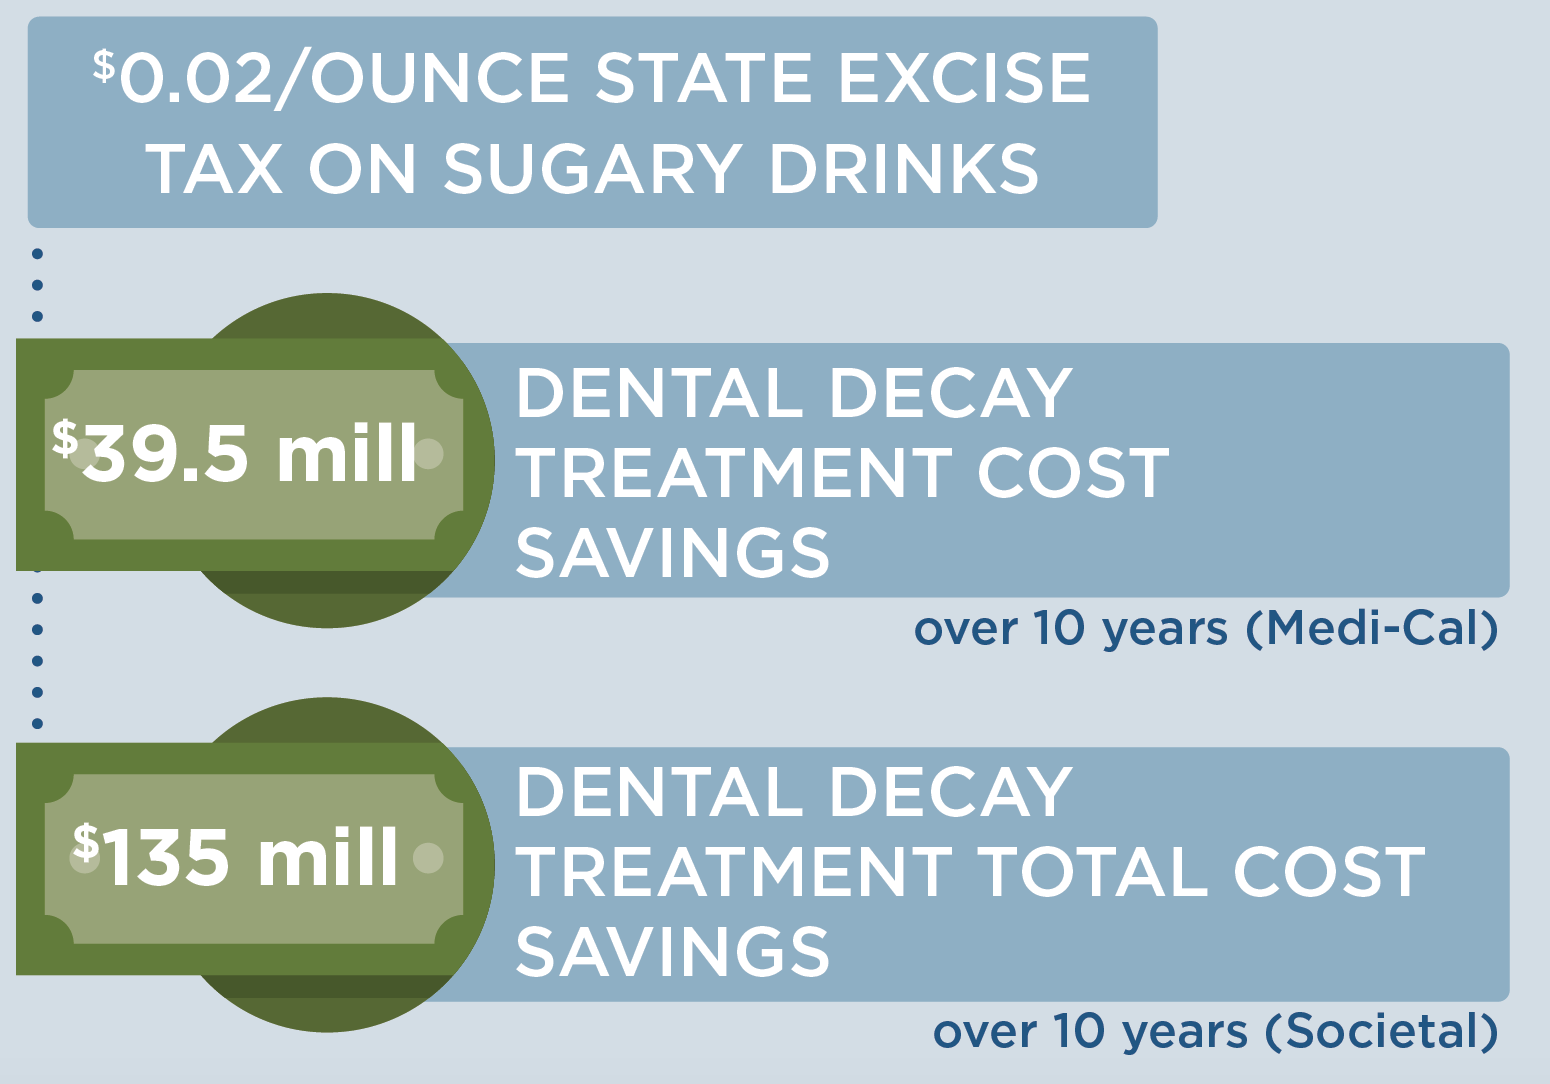


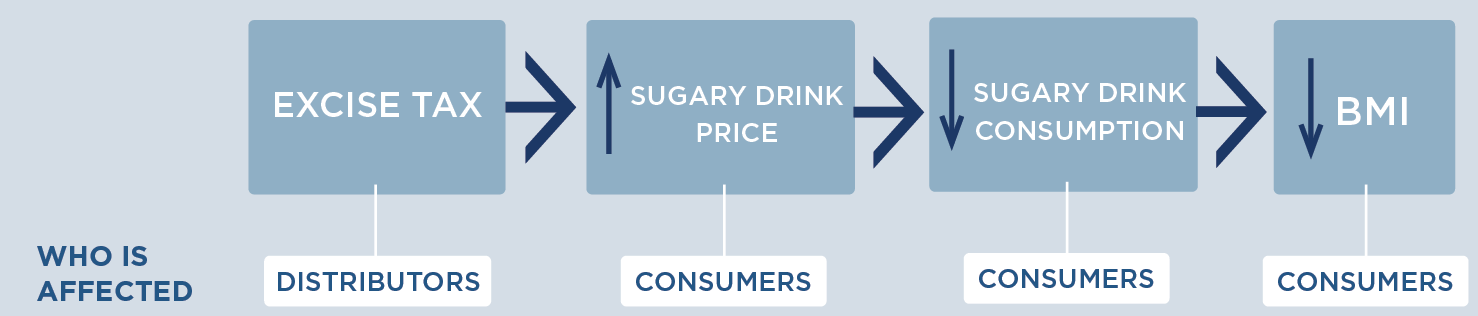
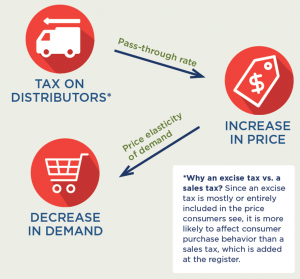
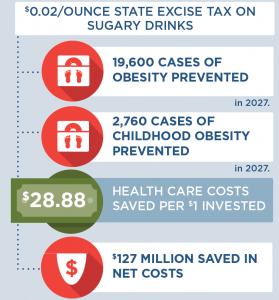
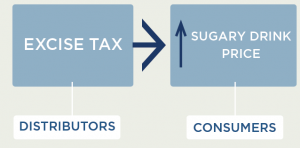 Since the cost of a sugary drink excise tax is incorporated directly into the beverage’s sticker price, an excise tax will likely influence consumer purchasing decisions more than a comparable sales tax that is added onto the item at the register. We assume 100% pass-through of the tax over 10 years and assume the tax rate would be adjusted annually for inflation. Our pass-through rate estimate is supported by empirical studies of excise taxes in Mexico and France that demonstrate near-complete pass-through rates to consumers.23 Short term studies for the local tax in Berkeley, CA indicate imperfect (or less than 100%) pass-through.3,24,25 More recent analyses from Philadelphia, PA indicate that over all the sales studied, pass-through was close to complete. The pass-through seen in pharmacies was higher than in supermarkets and mass merchandise settings.26 The expected change in sugary drink price was estimated using an average of $0.06/ounce based on national sugary drink prices.27 The price per ounce in this study was based on a weighted average of sugary drink consumption across stores, restaurants, and other sources according to the estimates from the National Health and Nutrition Examination Survey (NHANES) 2009-2010. The price per ounce of sugary drinks purchased in stores was calculated using weighted averages of two-liter bottles, 12-can cases, and single-serve containers based on 2010 Nielsen Homescan data.27 For example, a $0.02/ounce tax would raise the price of a 12-ounce can of soda from $0.72 to $0.96/can post-tax.
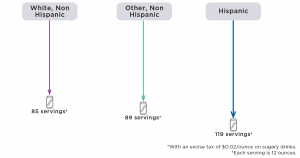
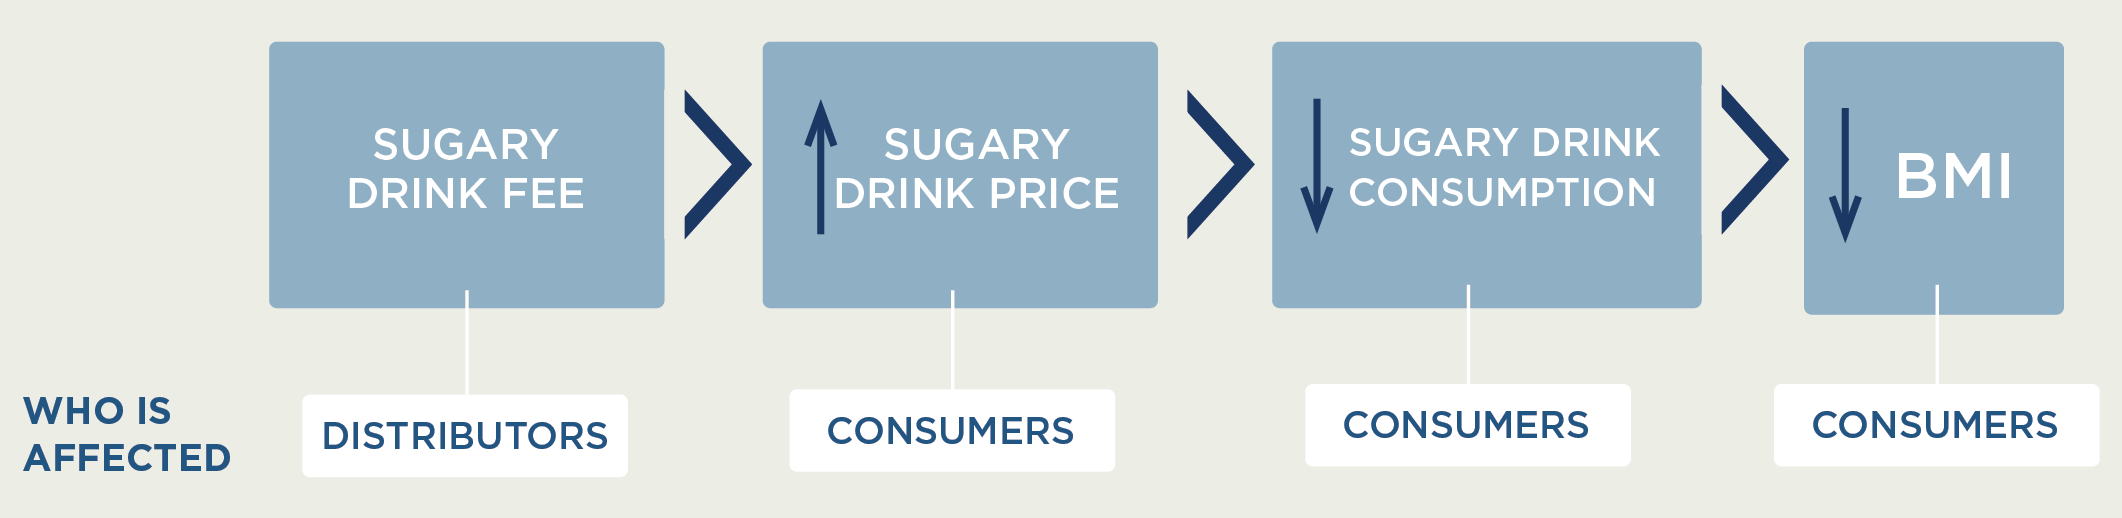
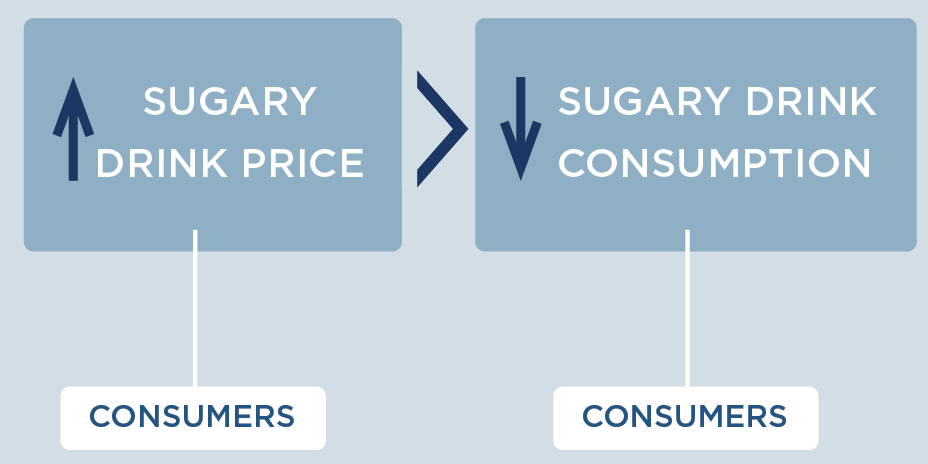
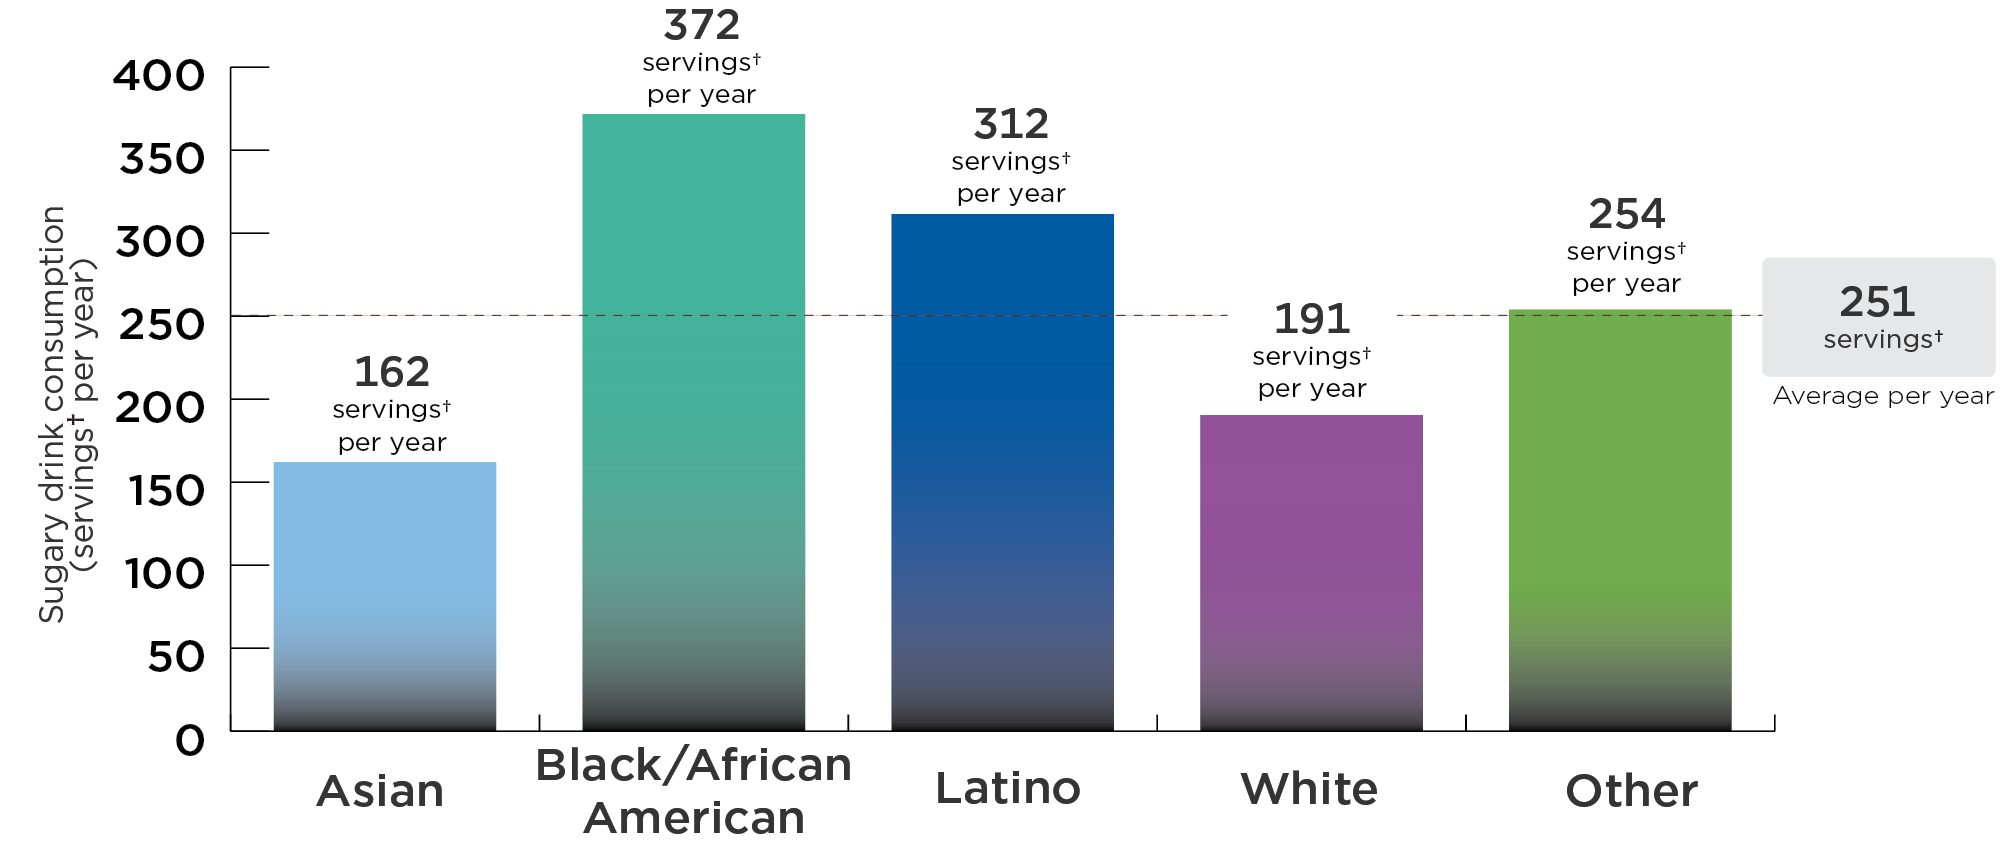
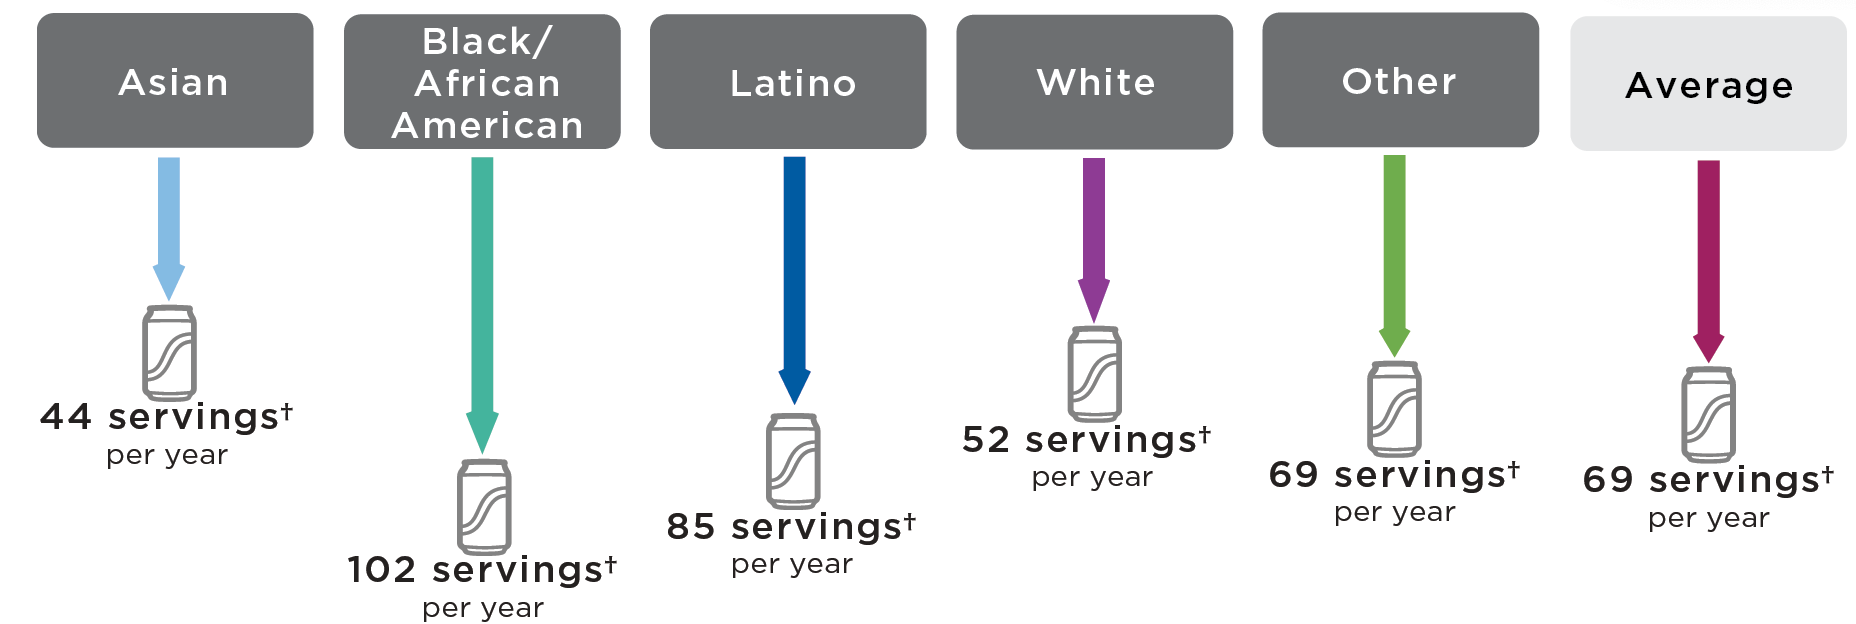
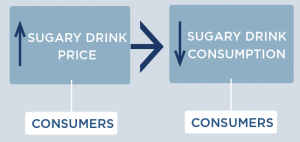 How does increasing the price of sugary drinks change individual sugary drink consumption?
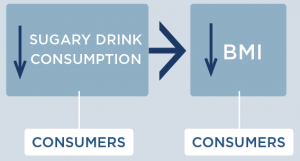
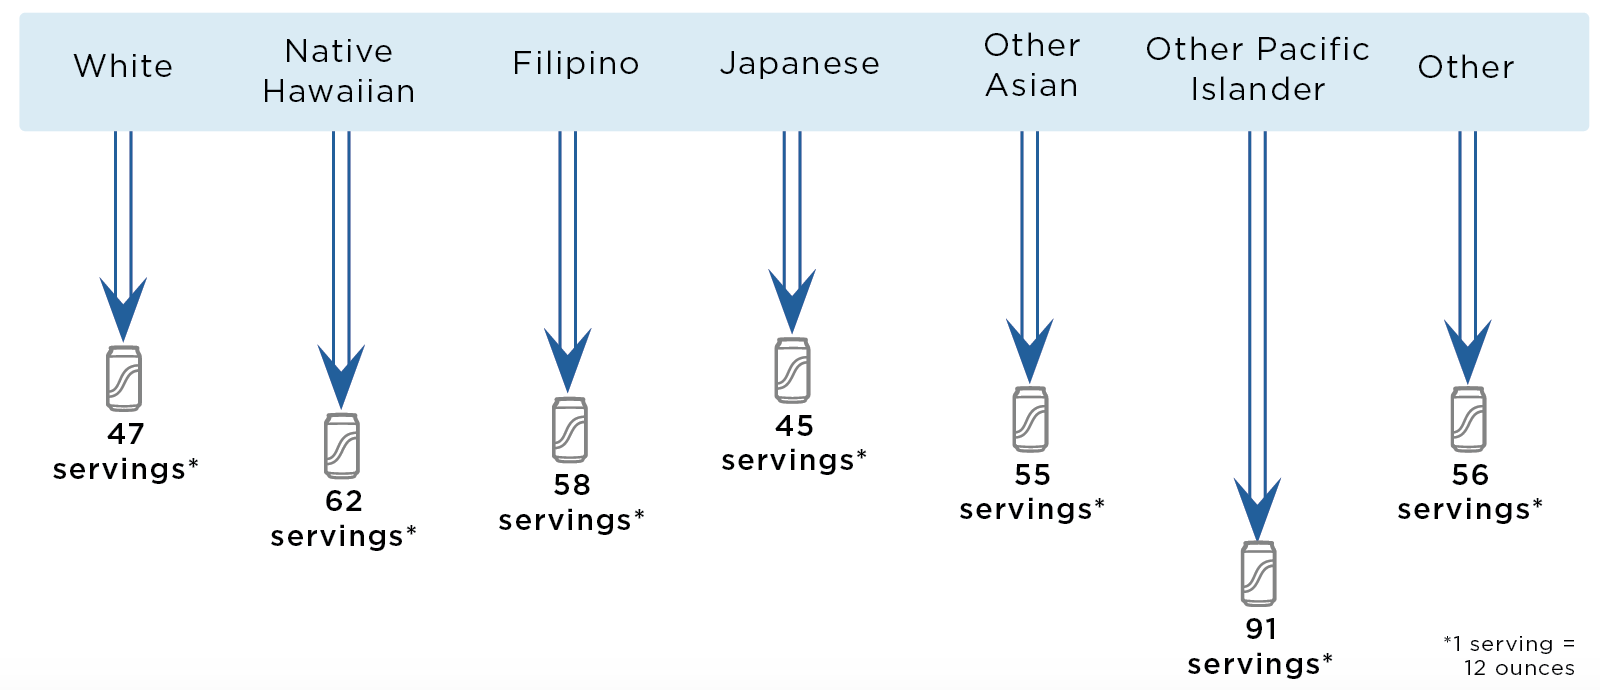