Setting: Communities & Government

Cost-effectiveness of mandating calorie labels on prepared foods in supermarkets

This study determines the cost-effectiveness of the requirement for chain food establishments—including supermarkets—to display calorie labels on prepared (i.e., ready-to-eat) foods since 2018.

Grummon AH, Barrett JL, Block JP, McCulloch S, Bolton A, Dupuis R, Petimar J, Gortmaker SL. Cost-effectiveness of mandating calorie labels on prepared foods in supermarketsAm J Prev Med. 2024 Oct, doi: 10.1016/j.amepre.2024.10.007.

Abstract

Introduction

The US has required chain food establishments—including supermarkets—to display calorie labels on prepared (i.e., ready-to-eat) foods since 2018. Implementation of this supermarket calorie labeling policy reduced purchases of prepared foods from supermarkets, but it remains unknown whether the policy is cost-effective.

Methods

In 2023-2024, this study applied the Childhood Obesity Intervention Cost-Effectiveness Study (CHOICES) microsimulation model to estimate the effects of the supermarket calorie labeling policy on health, costs, and cost-effectiveness over 10 years (2018-2027) for the US population. The model projected benefits overall and among racial, ethnic, and income subgroups. Sensitivity analyses varied assumptions about the extent to which consumers replace calorie reductions from prepared foods with calories from other sources (i.e., caloric compensation).

Results

From 2018-2027, the supermarket calorie labeling policy was projected to save $348 million in healthcare costs (95% Uncertainty Interval [UI]: $263-426 million), prevent 21,700 cases of obesity (95% UI: 18,200-25,400), including 3,890 cases of childhood obesity (95% UI: 2,680-5,120), and lead to 15,100 quality-adjusted life years (QALYs) gained across the US population (95% UI: 10,900-20,500). The policy was projected to prevent cases of obesity and childhood obesity across all racial, ethnic, and income groups. The policy was projected to be cost-saving when assuming low and moderate caloric compensation and cost-effective when assuming very high caloric compensation.

Conclusions

A policy requiring calorie labels on prepared foods in supermarkets was projected to be cost-saving or cost-effective and lead to reductions in obesity across all racial, ethnic, and income groups.

Keywords
calorie labels; food policy; cost-effectiveness; obesity; simulation


Funding

This research was supported in part by a grant from the National Institutes of Health (NIH) National Institute of Diabetes and Digestive and Kidney Diseases to Jason P. Block (R01 DK115492) and the NIH National Heart, Lung and Blood Institute at the National Institutes of Health (R01 HL14662501), the JPB Foundation (Grant no 1085) and the Centers for Disease Control and Prevention (CDC, U48 DP006376). The content is solely the responsibility of the authors and does not necessarily represent the official views of the NIH, JPB Foundation, or CDC. The funders had no role in the study design; collection, analysis, or interpretation of the data; writing the manuscript; or the decision to submit the paper for publication.

← Back to Resources

Association of continuous BMI with health-related quality of life in the United States by age and sex

This study estimates health-related quality of life by continuous BMI by age, sex, and demographic group in the United States.

Ward ZJ, Dupuis R, Long MW, Gortmaker SL. Association of continuous BMI with health-related quality of life in the United States by age and sex. Obesity (Silver Spring). 2024 Nov. doi: 10.1002/oby.24141. PMID: 39370765.

Abstract

Objective

The objective of this study is to estimate health-related quality of life (HRQoL) by continuous BMI by age, sex, and demographic group in the United States.

Methods

We estimated HRQoL (overall and by domain) by continuous BMI using SF-6D (Short-Form Six-Dimension) data from 182,778 respondents ages 18 years and older from the repeated cross-sectional Medical Expenditure Panel Survey (MEPS) 2008 to 2016. We adjusted for BMI self-report bias and for potential confounding between BMI and HRQoL.

Results

We found an inverse J-shaped curve of HRQoL by BMI, with lower values for female individuals and the highest health utilities occurring at BMI of 20.4 kg/m2 (95% CI: 20.32-20.48) for female individuals and 26.5 kg/m2 (95% CI: 26.45-26.55) for male individuals. By BMI category, excess weight contributed to HRQoL loss of 0.0349 for obesity overall, rising to 0.0724 for class III obesity. By domain, pain was the largest cause of HRQoL loss for obesity (26%), followed by role limitations (22%).

Conclusions

HRQoL is lower for people with excess body weight across a broad range of ages and BMI levels, especially at high levels of BMI, with pain being the largest driver of HRQoL loss. These findings highlight the importance of promoting a healthy weight for the entire population while also targeting efforts to prevent extreme weight gain over the life course.


Funding

All of the authors received support from The JPB Foundation (grant no. 1085). Zachary Ward and Steven Gortmaker were supported by the National Institutes of Health (grant no. R01HL146625). StevenGortmaker was supported by the Centers for Disease Control andPrevention (CDC; grant no. U48DP006376). This work is solely the responsibility of the authors and does not represent official views of the CDC or other funders.

← Back to Resources

Coffee Chat: Investing in a Healthier Future: How a Sugary Drink Excise Tax Could Improve Health & Health Equity in Massachusetts

In this coffee chat hosted by the CHOICES Community of Practice, Sara Bleich, Professor of Public Health Policy at the Harvard T.H. Chan School of Public Health and inaugural Vice Provost for Special Projects at Harvard University and Steve Gortmaker, Professor of the Practice of Health Sociology, Director of the Prevention Research Center on Nutrition and Physical Activity, and Director and Co-Principal Investigator of the CHOICES Project at the Harvard T.H. Chan School of Public Health, discussed the progressive health and health equity impacts of a sugary drink excise tax, highlighting recent findings from modeling a statewide tax in Massachusetts.

View the resource round-up from this coffee chat

Download the September 2024 coffee chat presentation slides

Disclaimer: Our guest speakers share their own perspectives and do not speak for Harvard.

← Back to Resources

Report: Sugary Drink Excise Tax in Boston, MA

Mom giving glass of water to young daughter

The information in this report is intended to provide educational information on the cost-effectiveness of sugary drink excise taxes.

Executive Summary

Sugary drink consumption has been linked to excess weight gain, obesity, incidence of type 2 diabetes, heart disease, and cancer. Federal, state, and local governments have considered implementing excise taxes on sugary drinks to reduce consumption, prevent obesity, and provide a new source of government revenue.1-3 In Massachusetts, legislative measures to introduce a tiered sugary drink excise tax have been proposed.4,5 The most recent proposed bills specify that tax revenue be dedicated to benefits, services, and programs, including universal free school meals and provision of healthy meals in Head Start and other high need early education settings, for communities most impacted by health inequity and burdened by chronic health outcomes related to sugary drink consumption.4,5

We modeled the impact of a statewide excise tax on sugary drinks on health outcomes among Boston residents. Consistent with current policy proposals, we assumed tiered tax rates depending on the sugar content of the beverage: $0.01/ounce for beverages with more than 7.5 but less than 30 grams of sugar per 12 fluid ounces and $0.02 for beverages with more than 30 grams of sugar per 12 fluid ounces. CHOICES cost-effectiveness analysis compared the costs and outcomes of implementing a tax with the costs and outcomes expected if the tax were not implemented over 10 years (2023-2032).

The sugary drink excise tax on distributors is projected to be cost-saving. This means that the tax would save more in future healthcare costs than it would cost to implement. This is without consideration of the potential revenue that would be generated, where a tiered $0.01-$0.02/ounce statewide excise tax on sugary drinks in Massachusetts could raise as much as $226 million to $322 million in annual revenue.6 Among Boston residents, the tax is projected to decrease sugary drink consumption, prevent more than 6,000 cases of obesity, and save $91.2 million in health care costs. People who consume sugary drinks are projected to spend less on these drinks with the excise tax in place. We also project that Black and Hispanic/Latinx Boston residents will experience a greater reduction in obesity rates compared with White, non-Hispanic/Latinx residents after the tax is implemented. These results are summarized below and in the complete report. Projected results for a $0.02/ounce state excise tax based on the volume of sugary drinks were similar.

Continue reading in the full report.

Contact choicesproject@hsph.harvard.edu for an accessible version of this report.

Citation

McCulloch SM, Barrett JL, Reiner JF, Cradock AL, Gortmaker SL. Boston: Sugary Drink Excise Tax. CHOICES Learning Collaborative Partnership at the Harvard T.H. Chan School of Public Health, Boston, MA; February 2024. For more information, please visit www.choicesproject.org.

The design for this brief and its graphics were developed by Molly Garrone, MA.

Funding

This work is supported by The JPB Foundation and the Centers for Disease Control and Prevention (U48DP006376), and the National Institutes for Health (R01HL146625). The findings and conclusions are those of the author(s) and do not necessarily represent the official position of the Centers for Disease Control and Prevention or other funders.

For further information, contact choicesproject@hsph.harvard.edu

References

  1. American Public Health Association Taxes on Sugar-Sweetened Beverages. 2012.

  2. Falbe J, Rojas N, Grummon AH, Madsen KA. Higher Retail Prices of Sugar-Sweetened Beverages 3 Months After Implementation of an Excise Tax in Berkeley, California. American Journal of Public Health. 2015;105(11):2194-2201.

  3. World Health Organization. Global action plan for the prevention and control of noncommunicable diseases 2013–2020 [Internet]. Geneva: WHO. Updated appendix 3, “Best buys” and other recommended interventions for the prevention and control of noncommunicable diseases; [updated 2017; cited 2019 Sep 17]. Available from: https://iris. who.int/bitstream/handle/10665/94384/9789241506236_eng.pdf?sequence=1

  4. Massachusetts Senate Docket No. 959. An Act to promote healthy alternatives to sugary drinks. https://malegislature.gov/Bills/193/SD959. Filed January 18, 2023. Accessed March 9, 2023.

  5. Massachusetts House Docket No. 1813. An Act to promote healthy alternatives to sugary drinks. https://malegislature.gov/Bills/193/HD1813. Filed January 18, 2023. Accessed March 9, 2023.

  6. UCONN Rudd Center. Revenue Calculator for Sugary Drink Taxes. Release: April 13, 2021. http://www.uconnruddcenter.org/revenue-calculator-for-sugary-drink-taxes. Accessed December, 2023.

See the report for the full list of references.

See the sugary drink excise tax report for the impact on the Massachusetts population.

← Back to Resources

Report: Sugary Drink Excise Tax in Massachusetts

Young girl drinking a glass of water

The information in this report is intended to provide educational information on the cost-effectiveness of sugary drink excise taxes.

Executive Summary

Sugary drink consumption has been linked to excess weight gain, obesity, incidence of type 2 diabetes, heart disease, and cancer. Federal, state, and local governments have considered implementing excise taxes on sugary drinks to reduce consumption, prevent obesity, and provide a new source of government revenue.1-3 In Massachusetts, legislative measures to introduce a tiered sugary drink excise tax have been proposed.4,5 The most recent proposed bills specify that tax revenue be dedicated to benefits, services, and programs, including universal free school meals and provision of healthy meals in Head Start and other high need early education settings, for communities most impacted by health inequity and burdened by chronic health outcomes related to sugary drink consumption.4,5

We modeled implementation of a state excise tax on sugary drinks in Massachusetts. Consistent with current policy proposals, we assumed tiered tax rates depending on the sugar content of the beverage: $0.01/ounce for beverages with more than 7.5 but less than 30 grams of sugar per 12 fluid ounces and $0.02 for beverages with more than 30 grams of sugar per 12 fluid ounces. CHOICES cost-effectiveness analysis compared the costs and outcomes of implementing a tax with the costs and outcomes expected if the tax were not implemented over 10 years (2023-2032).

The sugary drink excise tax on distributors is projected to be cost-saving. This means that the tax would save more in future health care costs than it costs to implement. This is without consideration of the potential revenue that would be generated, where a tiered $0.01-$0.02/ounce statewide excise tax on sugary drinks in Massachusetts could raise as much as $226 million to $322 million in annual revenue.6 Among Massachusetts residents, the tax is projected to decrease sugary drink consumption, prevent over 62,000 of cases of obesity, and save $937 million in health care costs. People who consume sugary drinks are projected to spend less on these drinks with the excise tax in place. We also project that Black and Hispanic/Latinx Massachusetts residents will experience a greater than average reduction in obesity levels after the tax is implemented, leading to improved health equity. These results are summarized below and in the complete report. Projected results for a $0.02/ounce state excise tax based on the volume of sugary drinks were similar.

Continue reading in the full report.

Contact choicesproject@hsph.harvard.edu for an accessible version of this report.

Citation

McCulloch SM, Barrett JL, Reiner JF, Cradock AL, Gortmaker SL. Massachusetts: Sugary Drink Excise Tax. The CHOICES Learning Collaborative Partnership at the Harvard T.H. Chan School of Public Health, Boston, MA; February 2024. For more information, please visit www.choicesproject.org.

The design for this brief and its graphics were developed by Molly Garrone, MA.

Funding

This work is supported by The JPB Foundation and the Centers for Disease Control and Prevention (U48DP006376), and the National Institutes for Health (R01HL146625). The findings and conclusions are those of the author(s) and do not necessarily represent the official position of the Centers for Disease Control and Prevention or other funders.

For further information, contact choicesproject@hsph.harvard.edu

References

  1. American Public Health Association Taxes on Sugar-Sweetened Beverages. 2012.

  2. Falbe J, Rojas N, Grummon AH, Madsen KA. Higher Retail Prices of Sugar-Sweetened Beverages 3 Months After Implementation of an Excise Tax in Berkeley, California. American Journal of Public Health. 2015;105(11):2194-2201.

  3. World Health Organization. Global action plan for the prevention and control of noncommunicable diseases 2013–2020 [Internet]. Geneva: WHO. Updated appendix 3, “Best buys” and other recommended interventions for the prevention and control of noncommunicable diseases; [updated 2017; cited 2019 Sep 17]. Available from: https://iris. who.int/bitstream/handle/10665/94384/9789241506236_eng.pdf?sequence=1

  4. Massachusetts Senate Docket No. 959. An Act to promote healthy alternatives to sugary drinks. https://malegislature.gov/Bills/193/SD959. Filed January 18, 2023. Accessed March 9, 2023.

  5. Massachusetts House Docket No. 1813. An Act to promote healthy alternatives to sugary drinks. https://malegislature.gov/Bills/193/HD1813. Filed January 18, 2023. Accessed March 9, 2023.

  6. UCONN Rudd Center. Revenue Calculator for Sugary Drink Taxes. Release: April 13, 2021. http://www.uconnruddcenter.org/revenue-calculator-for-sugary-drink-taxes. Accessed December, 2023.

See the report for the full list of references.

See the sugary drink excise tax report for the impact on the Boston, MA population.

← Back to Resources

Coffee Chat: Putting the Eggs in All the Right Baskets: Tips for Braiding & Layering Funds to Support Public Health Programs

In this coffee chat hosted by the CHOICES Community of Practice, Ali Maffey, Vice President of Social and Behavioral Health at the Association of State and Territorial Health Officials, described strategies for braiding and layering public health funding and share specific examples.

View the resource round-up from this coffee chat

Download the August 2024 coffee chat presentation slides


Disclaimer: Our guest speakers share their own perspectives and do not speak for Harvard.

← Back to Resources

Strategy Report: Sugary Drink Excise Tax: 2 Cents per Ounce

Mom and young daughter drinking glasses of water

The information provided here is intended to be used for educational purposes. Links to other resources and websites are intended to provide additional information aligned with this educational purpose.

Overview

CHOICES uses cost-effectiveness analysis to compare the costs and outcomes of different policies and programs promoting improved nutrition or increased physical activity in schools, early care and education and out-of-school settings, communities, and clinics. This strategy report describes the projected national population reach, impact on health and health equity, implementation costs, and cost-effectiveness for an effective strategy to improve child health. This information can help inform decision-making around promoting healthy weight. To explore and compare additional strategies, visit the CHOICES National Action Kit 2.0.

Continue reading in the full report.

Contact choicesproject@hsph.harvard.edu with any accessibility questions.

Suggested Citation

Barrett JL, McCulloch SM, Cradock AL, Gortmaker SL. CHOICES National Action Kit: Sugary Drink Excise Tax: 2 Cents per Ounce Strategy Report. CHOICES Project Team at the Harvard T.H. Chan School of Public Health, Boston, MA; May 2024.

Acknowledgments

We thank the following members of the CHOICES Project team for their contributions: Molly Garrone, Dar Alon, Banapsha Rahman, Ya Xuan Sun, Amy Bolton, Jenny Reiner, Matt Lee, Zach Ward.

Funding

This work is supported by the National Institutes of Health (R01HL146625), The JPB Foundation, and the Centers for Disease Control and Prevention (U48DP006376). The findings and conclusions are those of the author(s) and do not necessarily represent the official position of the Centers for Disease Control and Prevention or other funders. The information provided here is intended to be used for educational purposes. Links to other resources and websites are intended to provide additional information aligned with this educational purpose

For further information, contact choicesproject@hsph.harvard.edu

← Back to Resources

Strategy Report: Improved WIC Food Package for 1-4-Year-Olds (2009)

The information provided here is intended to be used for educational purposes. Links to other resources and websites are intended to provide additional information aligned with this educational purpose.

Overview

CHOICES uses cost-effectiveness analysis to compare the costs and outcomes of different policies and programs promoting improved nutrition or increased physical activity in schools, early care and education and out-of-school settings, communities, and clinics. This strategy report describes the projected national population reach, impact on health and health equity, implementation costs, and cost-effectiveness for an effective strategy to improve child health. This information can help inform decision-making around promoting healthy weight. To explore and compare additional strategies, visit the CHOICES National Action Kit 2.0.

Continue reading in the full report.

Contact choicesproject@hsph.harvard.edu with any accessibility questions.

Suggested Citation

Barrett JL, Kenney EL, Cradock AL, Gortmaker SL. CHOICES National Action Kit: Improved WIC Food Package for 1-4-Year-Olds (2009) Strategy Report. CHOICES Project Team at the Harvard T.H. Chan School of Public Health, Boston, MA; May 2024.

Acknowledgments

We thank the following members of the CHOICES Project team for their contributions: Molly Garrone, Matt Lee, Zach Ward, Stephanie McCulloch.

Funding

This work is supported by the National Institutes of Health (R01HL146625), The JPB Foundation, and the Centers for Disease Control and Prevention (U48DP006376). The findings and conclusions are those of the author(s) and do not necessarily represent the official position of the Centers for Disease Control and Prevention or other funders. The information provided here is intended to be used for educational purposes. Links to other resources and websites are intended to provide additional information aligned with this educational purpose

For further information, contact choicesproject@hsph.harvard.edu

← Back to Resources

Coffee Chat: Advancing Equitable Access to Improved Nutrition: Evidence and Policy

Advancing Equitable Access to Improved Nutrition: Evidence and Policy

In this coffee chat hosted by the CHOICES Community of Practice, Sara Bleich, Professor of Public Health Policy at the Harvard T.H. Chan School of Public Health and inaugural Vice Provost for Special Projects at Harvard University and Steve Gortmaker, Professor of the Practice of Health Sociology, Director of the Prevention Research Center on Nutrition and Physical Activity, and Director and Co-Principal Investigator of the CHOICES Project at the Harvard T.H. Chan School of Public Health shared evidence about cost-effective, population-level nutrition policies that have been shown to prevent obesity and improve health equity as well as updates about implementation.

View the resource round-up from this coffee chat

Download the April 2024 coffee chat presentation slides

Disclaimer: Our guest speakers share their own perspectives and do not speak for Harvard.

← Back to Resources

Coffee Chat: State & Local Policies for Incorporating Added-Sugar Warning Labels on Restaurant Menus

State and Local Policies for Incorporating Added-Sugar Warning Labels on Restaurant Menus

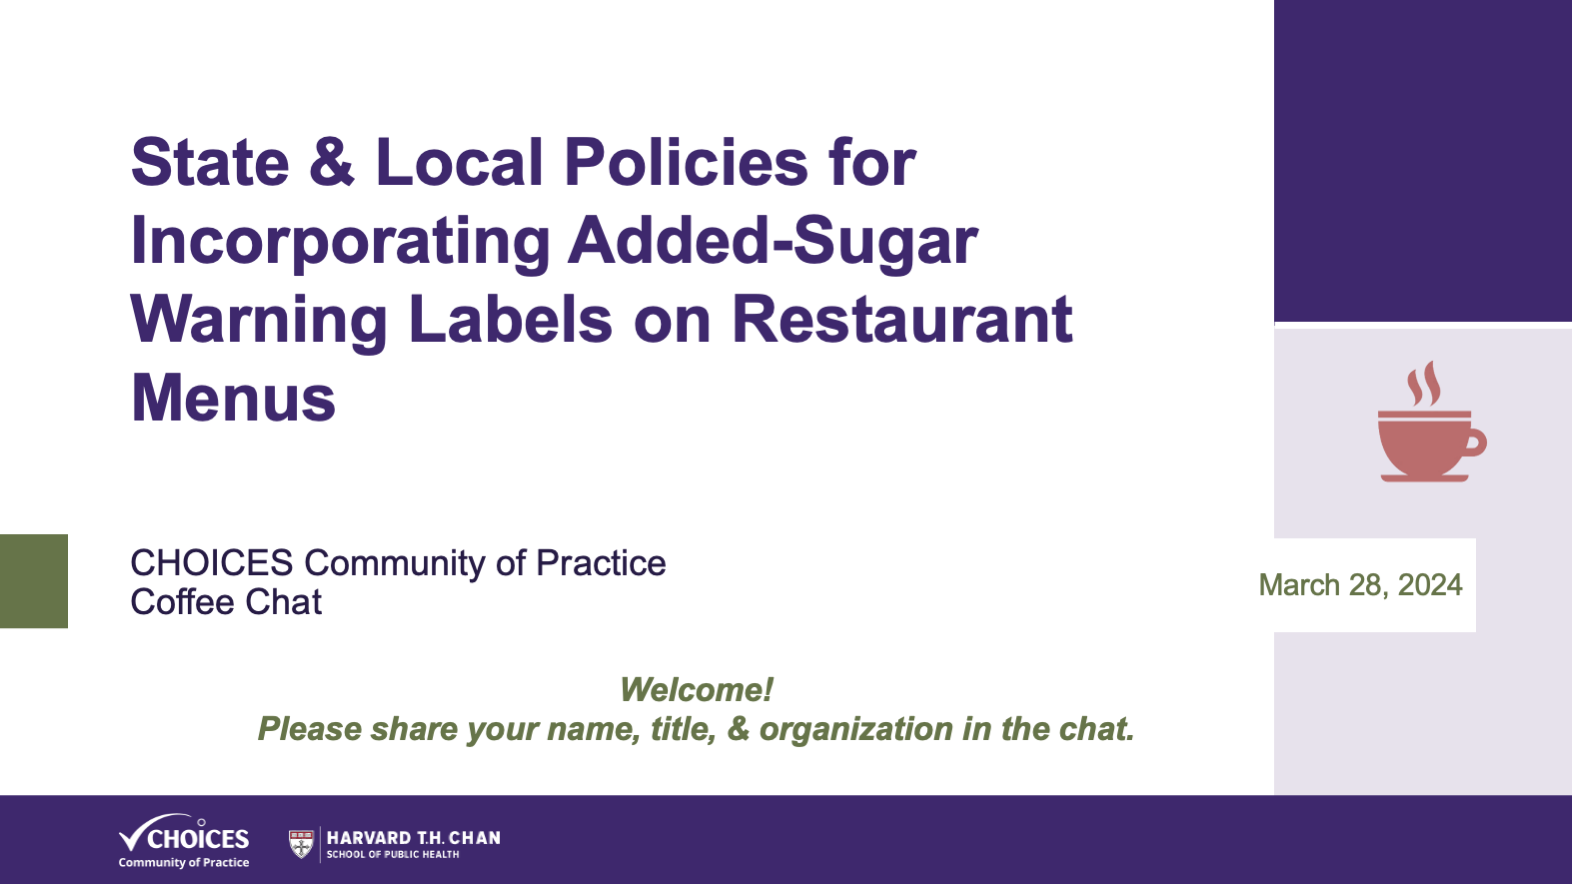
In this coffee chat hosted by the CHOICES Community of Practice, DeAnna Nara, Senior Policy Associate at the Center for Science in the Public Interest, explored strategies to incorporate added-sugar warning labels into restaurant menus to reduce added sugar consumption and shared resources to support practitioners at the state and local levels with this work.

View the resource round-up from this coffee chat

Download the March 2024 coffee chat presentation slides

Disclaimer: Our guest speakers share their own perspectives and do not speak for Harvard.

← Back to Resources