The information in this brief is intended only to provide educational information.
The CHOICES Project at the Harvard T.H. Chan School of Public Health, the Massachusetts Department of Public Health (MDPH), and the Massachusetts Department of Elementary and Secondary Education (DESE) worked together as part of the Massachusetts-CHOICES Project, a training, technical assistance, and modeling initiative, to develop a playbook of strategies to promote healthy weight and advance health equity in addition to studying how cost-effectiveness metrics are used by partners throughout the state.
Methods & Strategies Modeled
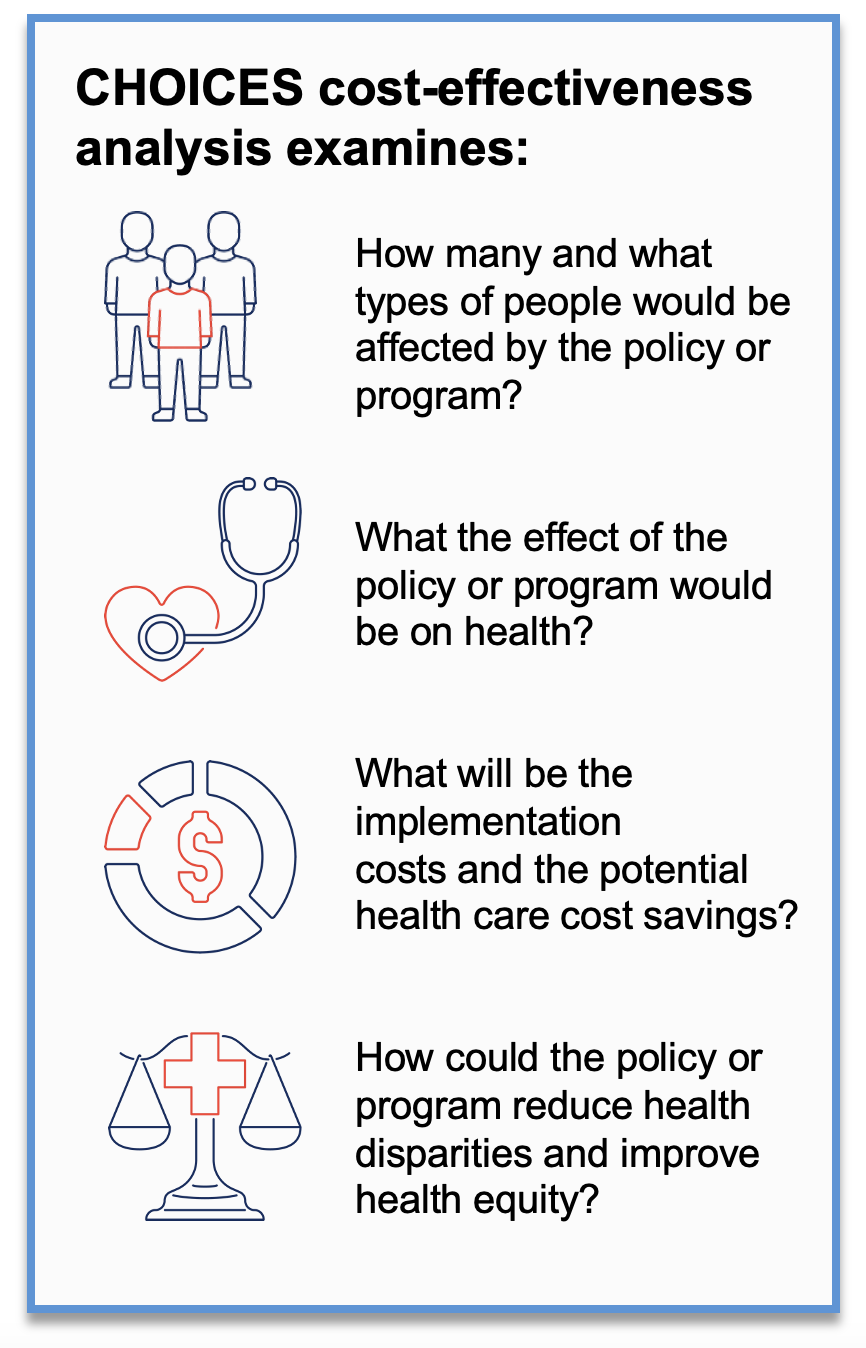
CHOICES uses cost-effectiveness analysis to compare the costs and outcomes of different policies and programs promoting improved nutrition or increased physical activity in schools, early care and education and out-of-school settings, communities, and clinics.
Using CHOICES cost-effectiveness analysis and local data, the MDPH and DESE team worked with CHOICES to create a virtual population that mirrors the current population of Massachusetts. Then, the teams examined the expected costs, health outcomes, impacts on health equity, and health care costs saved if the following strategies were implemented in Massachusetts over a 10-year timeframe (2020-2029):
• Movement Breaks in the Classroom
• Water Dispensers in Schools
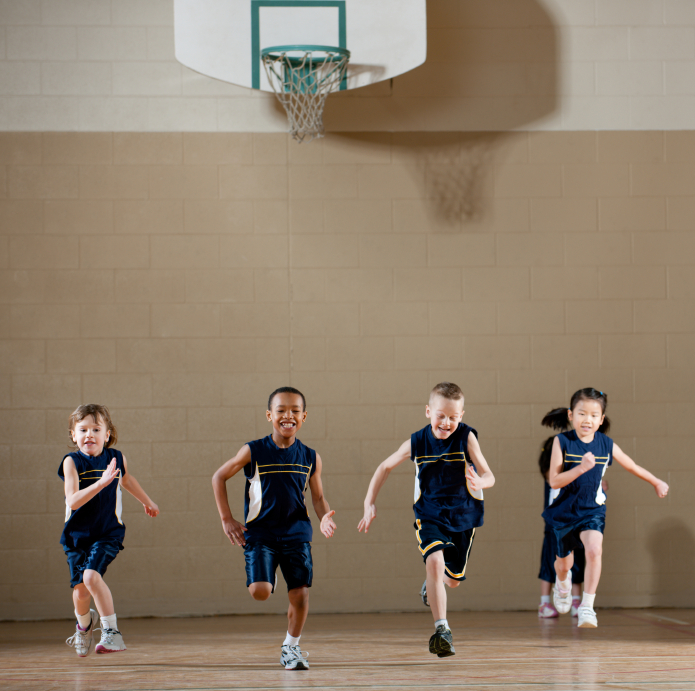
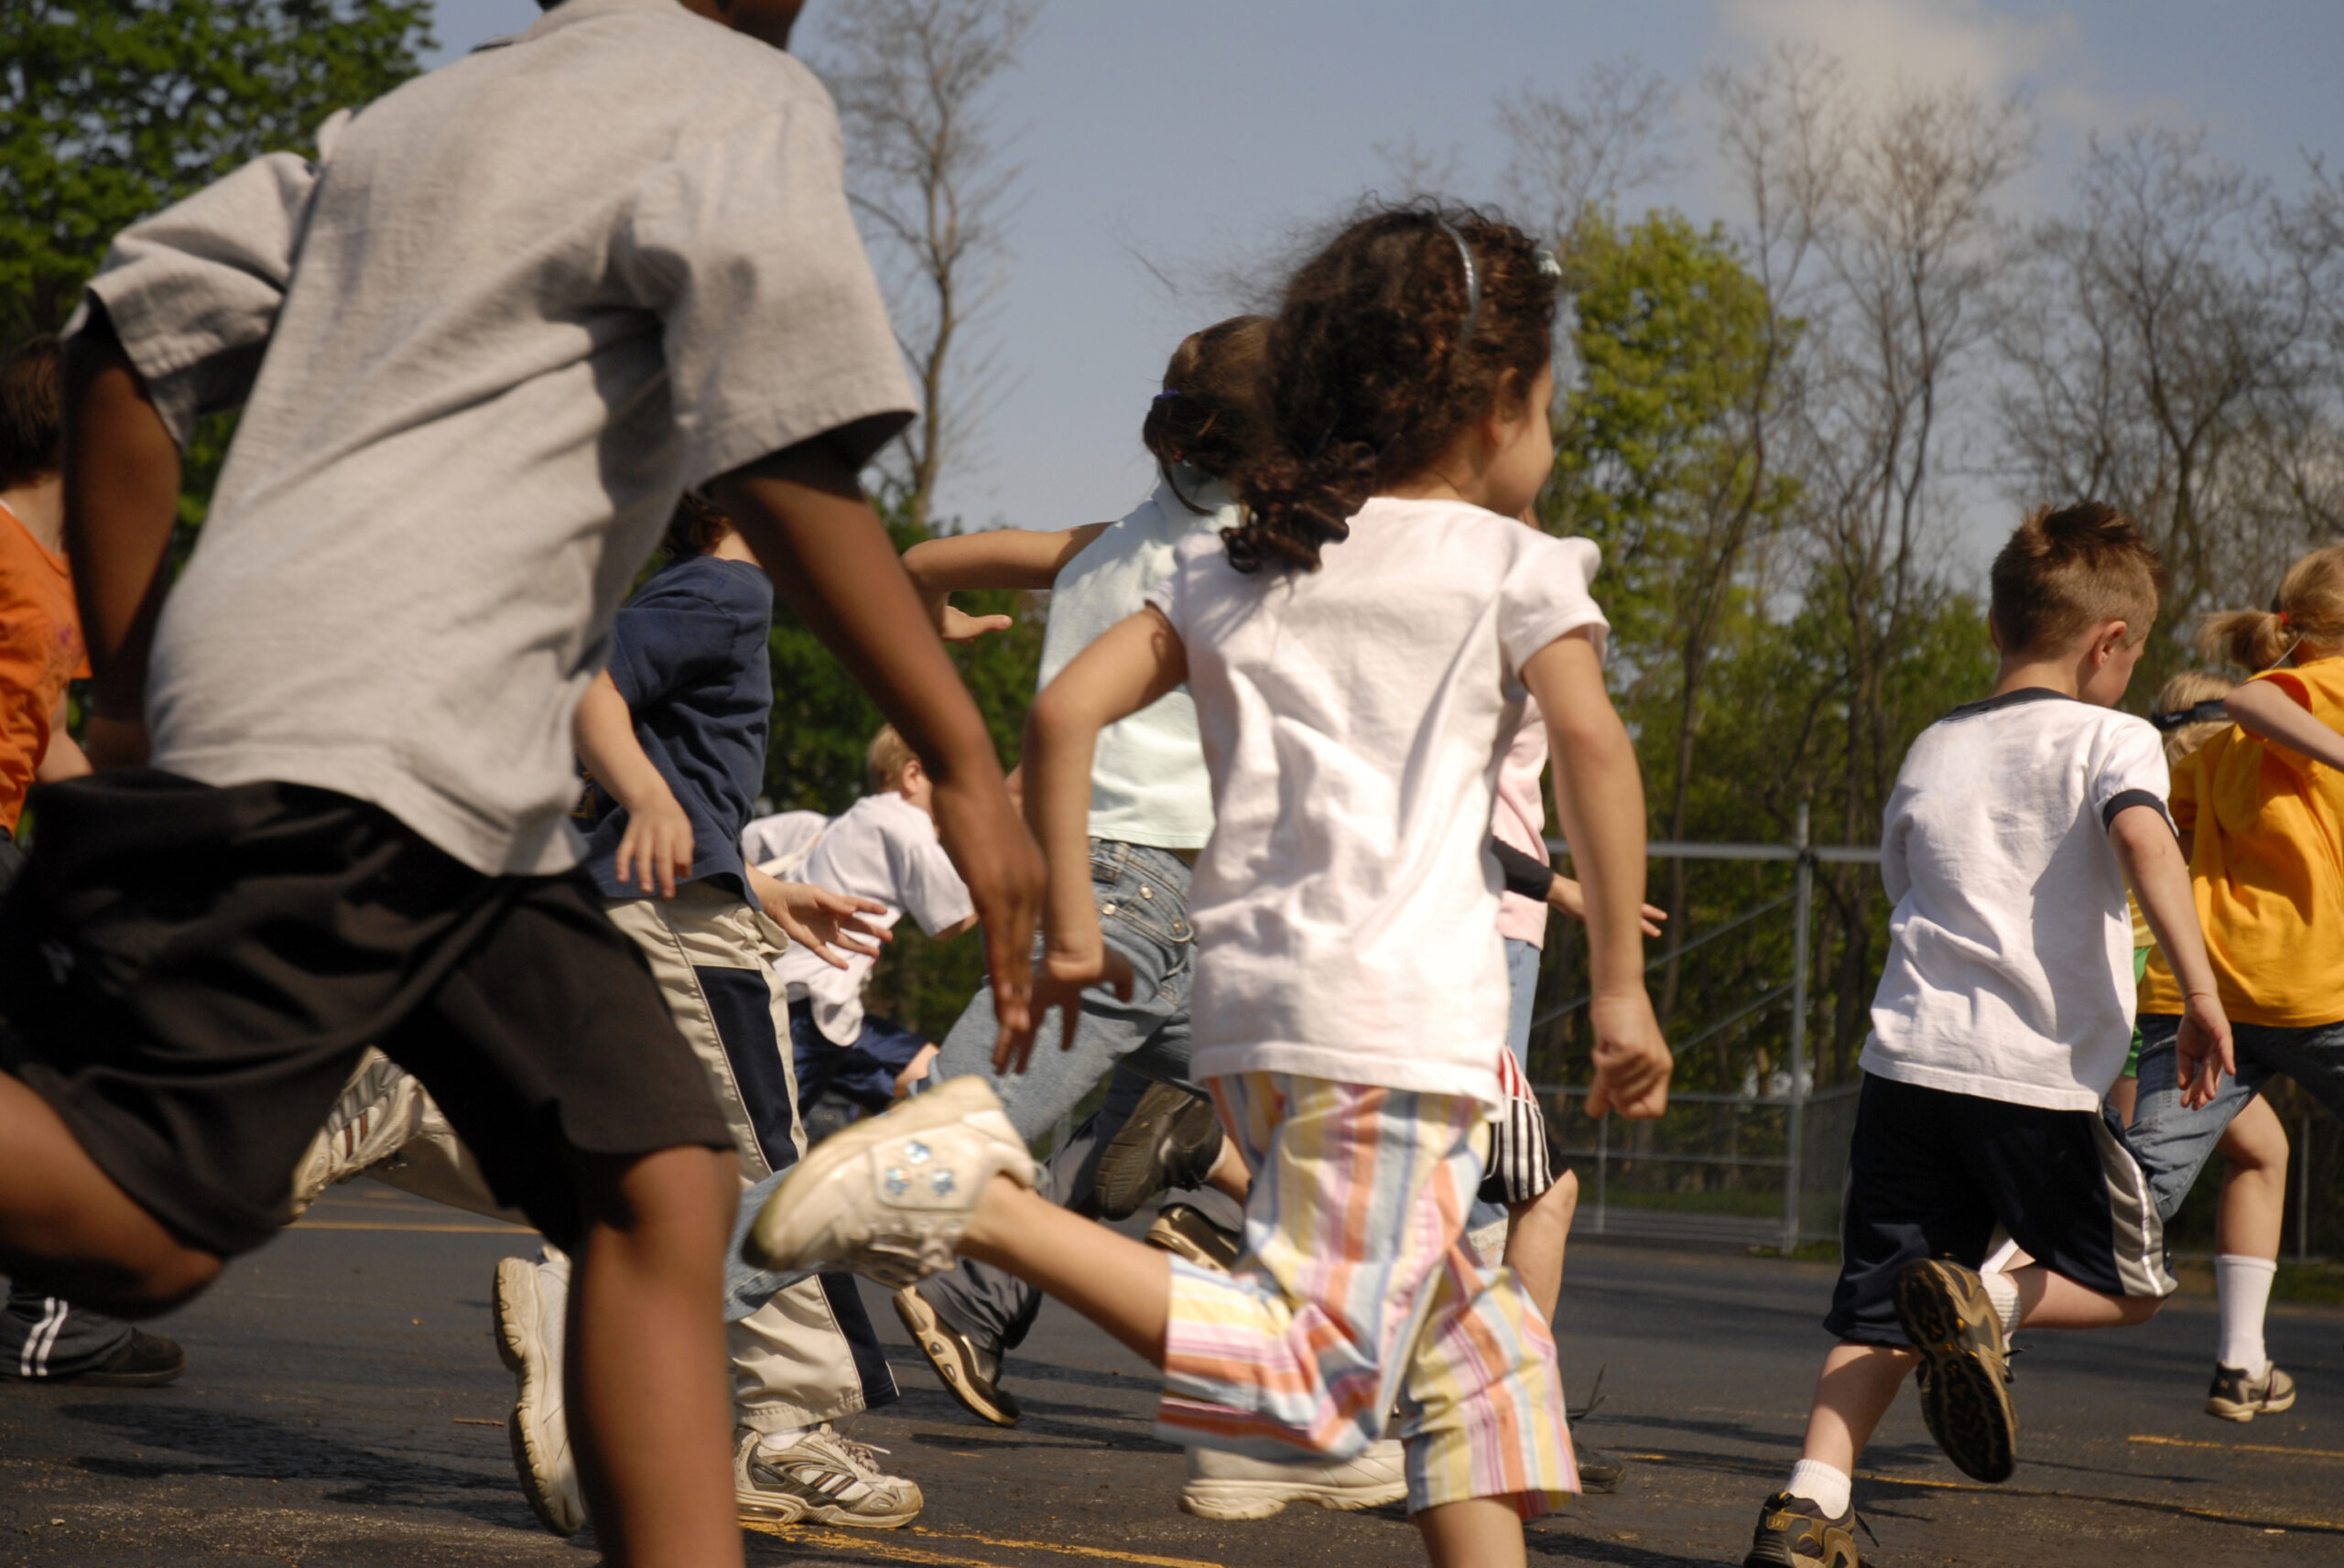
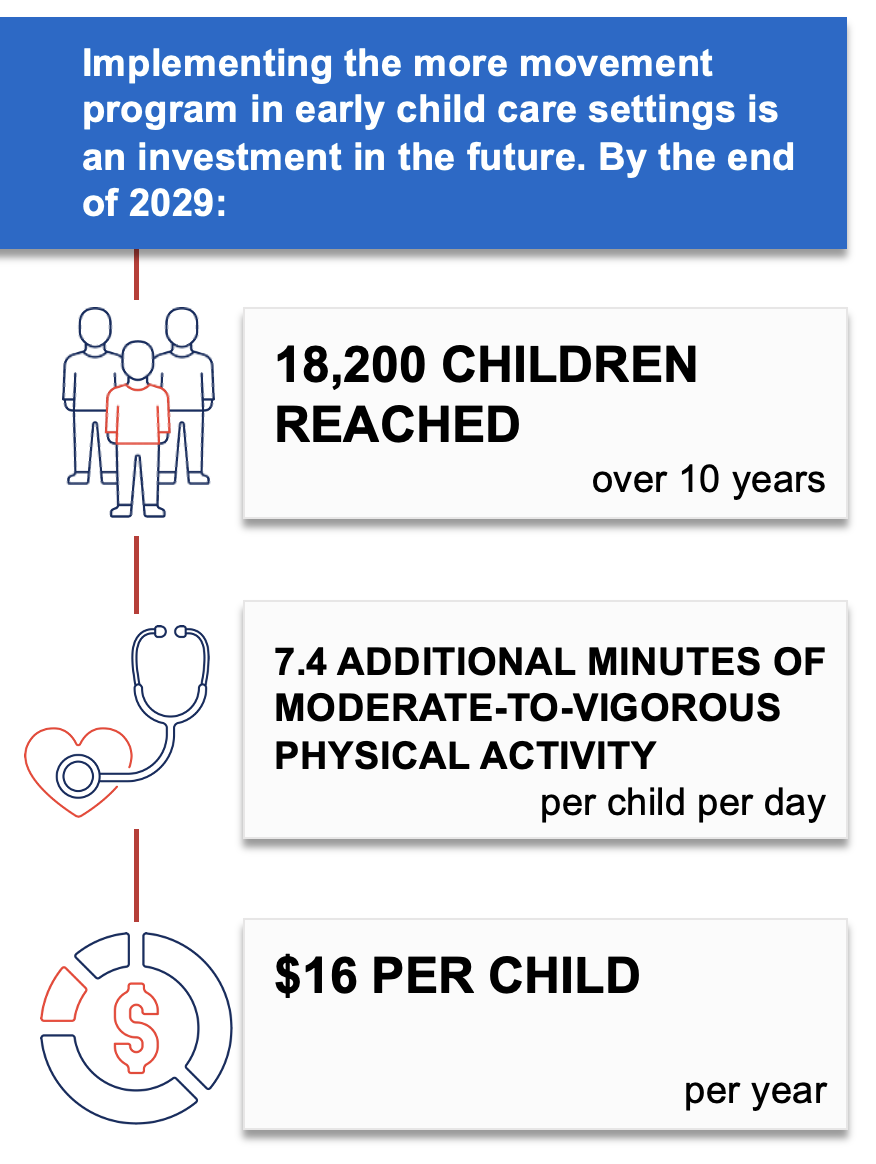
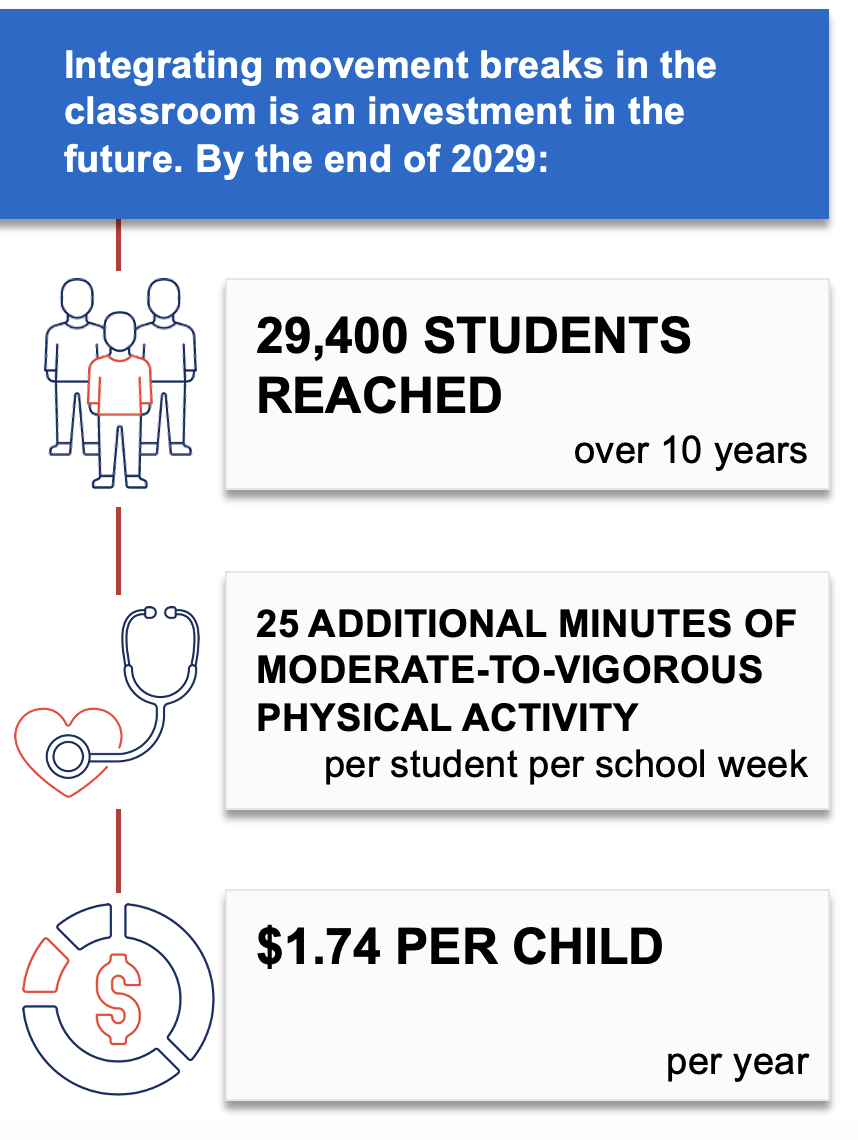
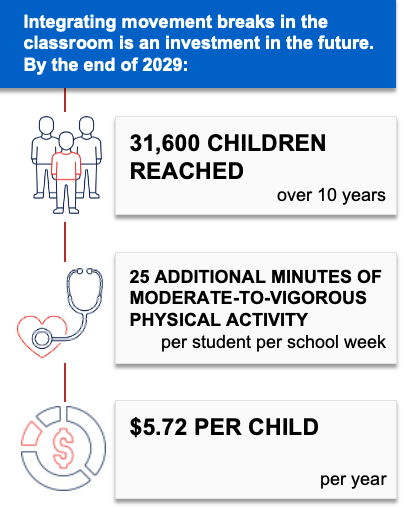
Movement Breaks in the Classroom
Movement breaks in the classroom is a strategy to promote physical activity during the school day by incorporating five-to-10-minute movement breaks in K-5 public elementary school classrooms. To implement this evidence-based strategy,1 the Massachusetts Departments of Public Health and Elementary and Secondary Education would collaborate to connect school districts to the School Wellness Coaching Program. This program helps school districts integrate movement breaks into their local wellness policies and meet state and federal physical activity recommendations.
Teachers in K-5 classrooms would receive training, technical assistance, and materials to support implementation. School wellness champions could also elect to be trained. This strategy aligns with the School Wellness Coaching Program2 and the Whole School, Whole Community, Whole Child initiative to create school environments that prioritize students’ health, well-being, and ability to learn.
Additional Key Findings
If movement breaks were incorporated into classrooms in Massachusetts, it is likely to be cost-effective at commonly accepted thresholds3 based on net cost per population health improvement related to excess weight ($66,200 per quality-adjusted life year gained).
By training and equipping over 200 teachers and other school staff to incorporate movement breaks in the classroom, this strategy could help Massachusetts public schools cultivate a positive school climate and improve social emotional learning.4 Additionally, movement breaks allow students an opportunity for a “brain break” to refocus, reconnect and bring their attention back to their academic work.
To learn more about this strategy, read the research brief.
- Good N, Bolton AA, Barrett JL, Reiner JF, Cradock AL, Gortmaker SL. Massachusetts: Movement Breaks in the Classroom {Issue Brief}. The CHOICES Learning Collaborative Partnership at the Harvard T.H. Chan School of Public Health, Boston, MA; June 2023.
References
1.The Community Preventive Services Task Force. Physical Activity: Classroom-based Physical Activity Break Interventions. The Community Guide; 2021. Accessed Jun 20, 2023. https://www.thecommunityguide.org/pages/tffrs-physical-activity-classroom-based-physical-activity-break-interventions.html
2.School Wellness Initiative for Thriving Community Health (SWITCH). Initiatives: Massachusetts School Wellness Coaching Program. Published 2022. Accessed Oct 5, 2022. https://massschoolwellness.org/initiatives
3.Neumann PJ, Cohen JT, Weinstein MC. Updating cost-effectiveness–the curious resilience of the $50,000-per-QALY threshold. New England Journal of Medicine. 2014 Aug 28;371(9):796-7. DOI: 10.1056/NEJMp1405158. PMID: 25162885.
4.Centers for Disease Control and Prevention. School-Based Physical Activity Improves the Social and Emotional Climate for Learning. CDC Healthy Schools. Published 2021. Accessed March 9, 2022. https://www.cdc.gov/healthyschools/school_based_pa_se_sel.htm
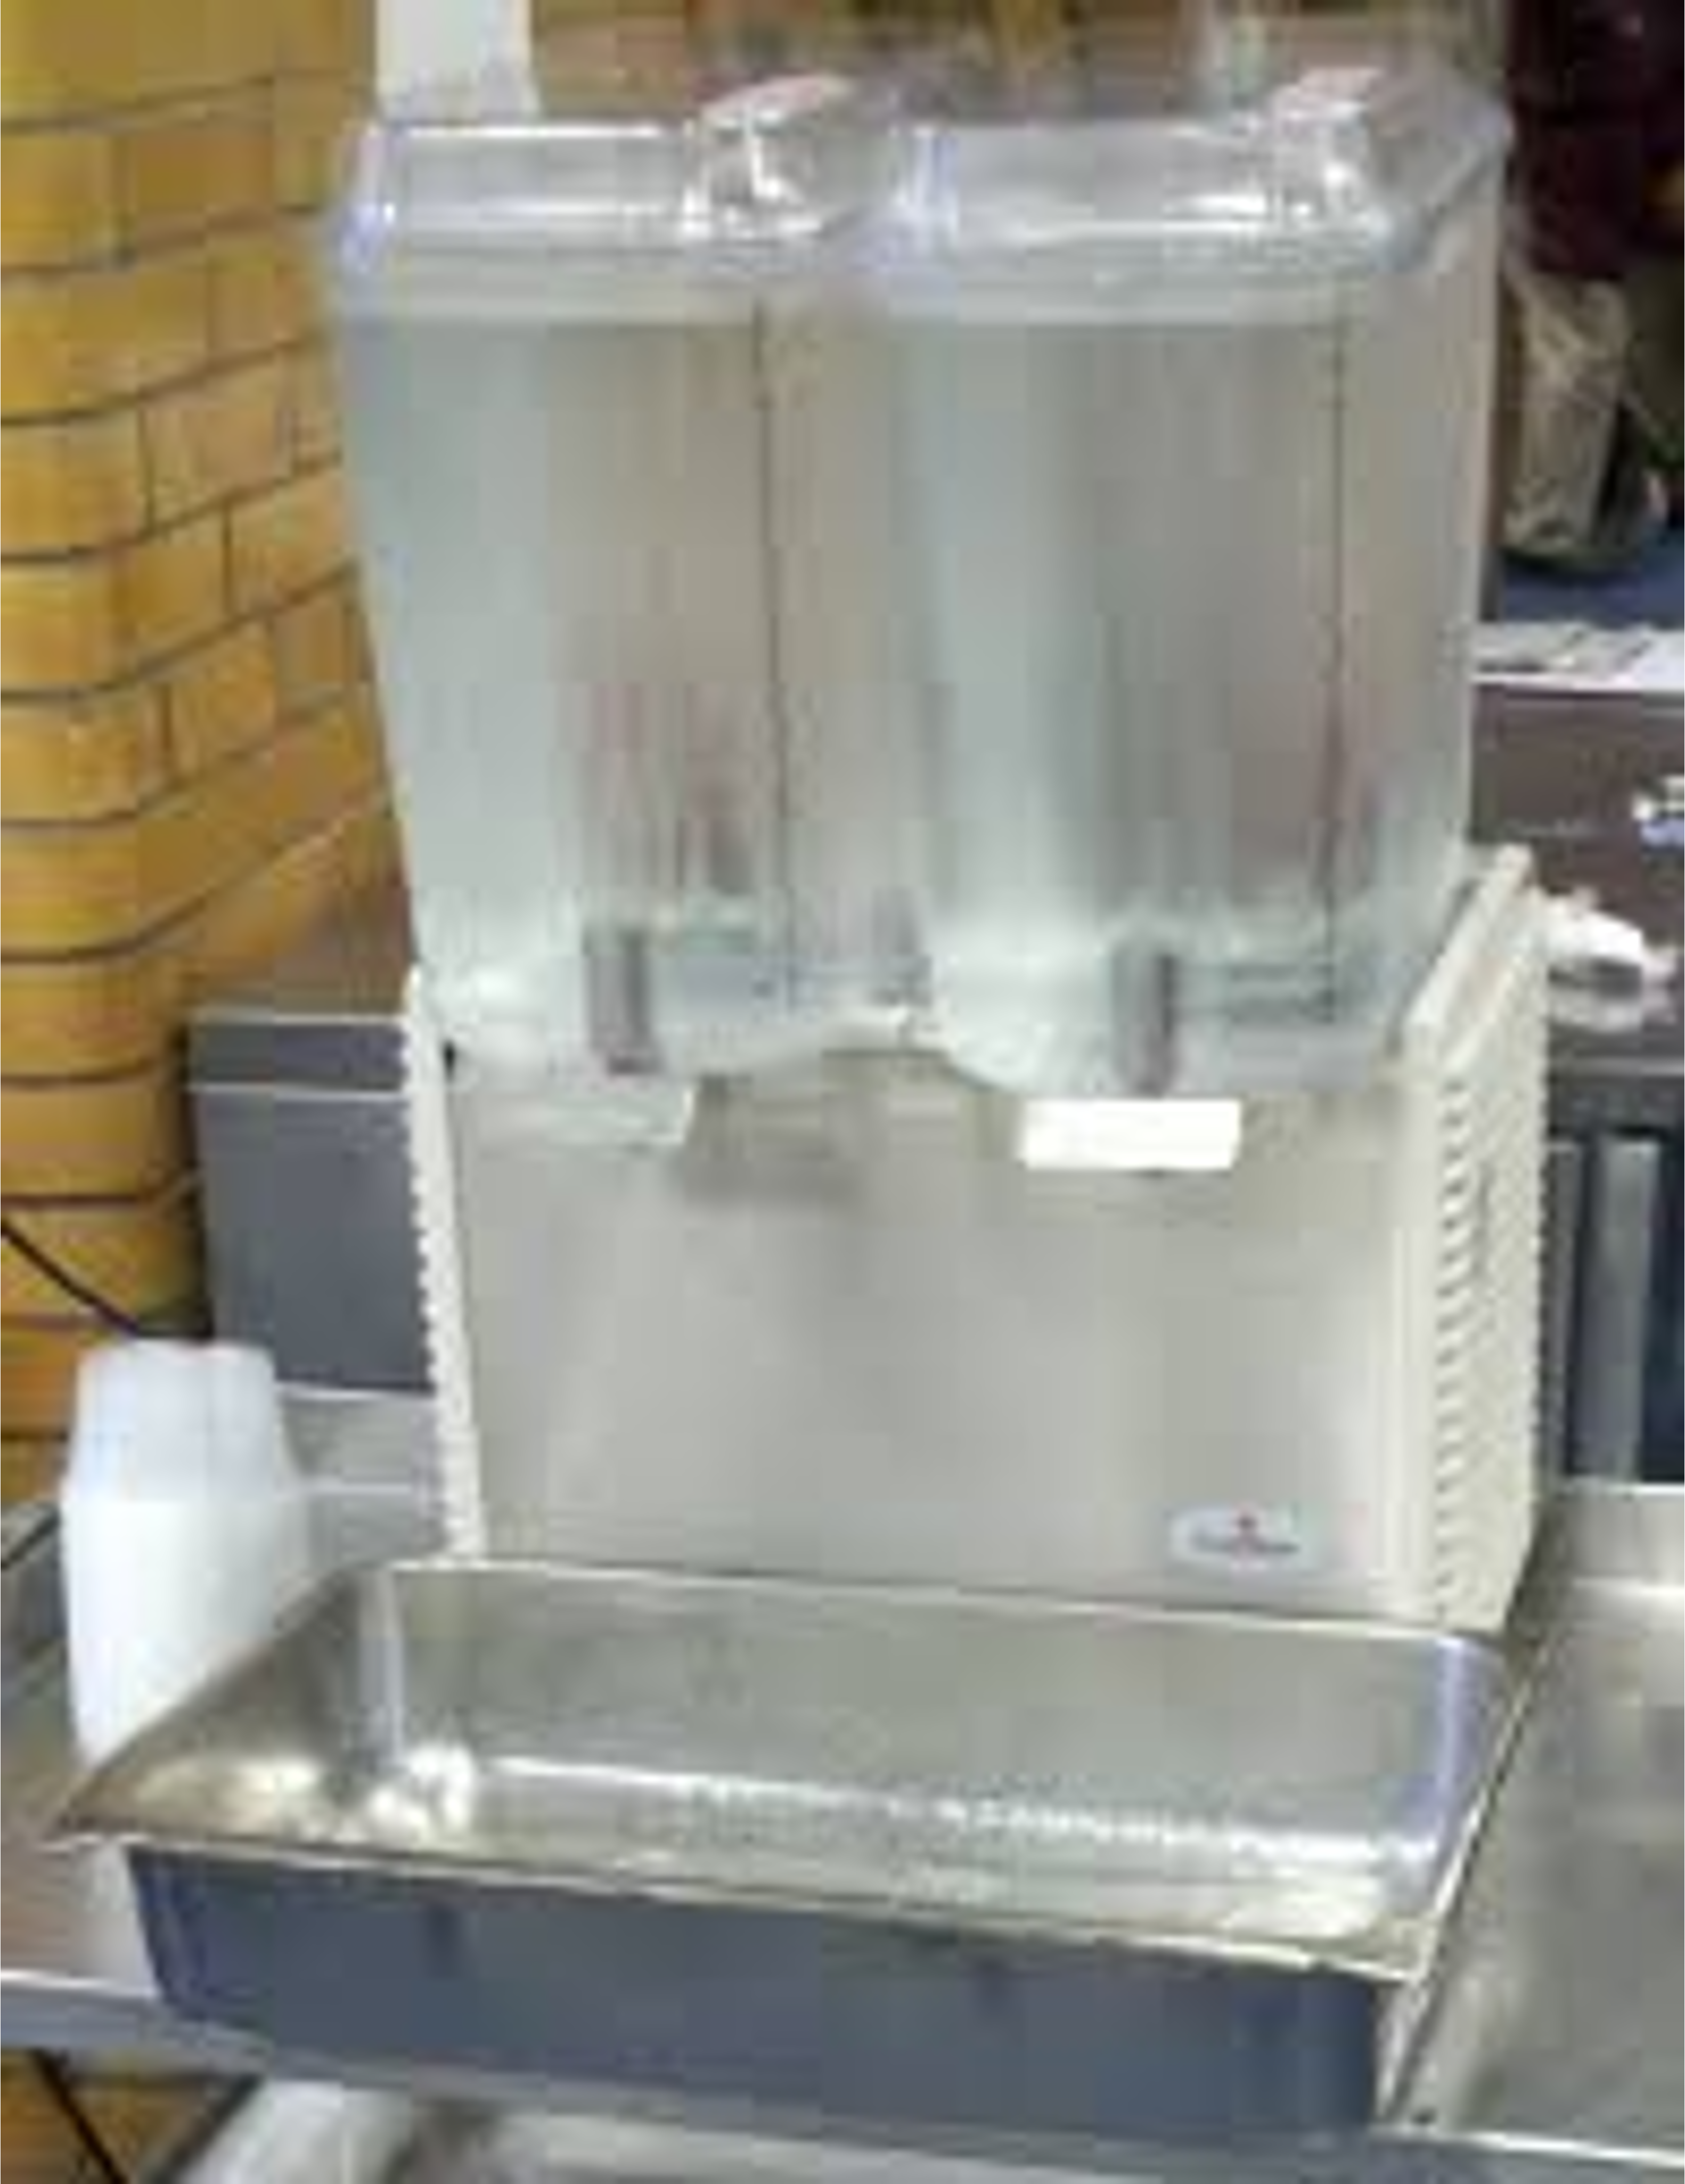
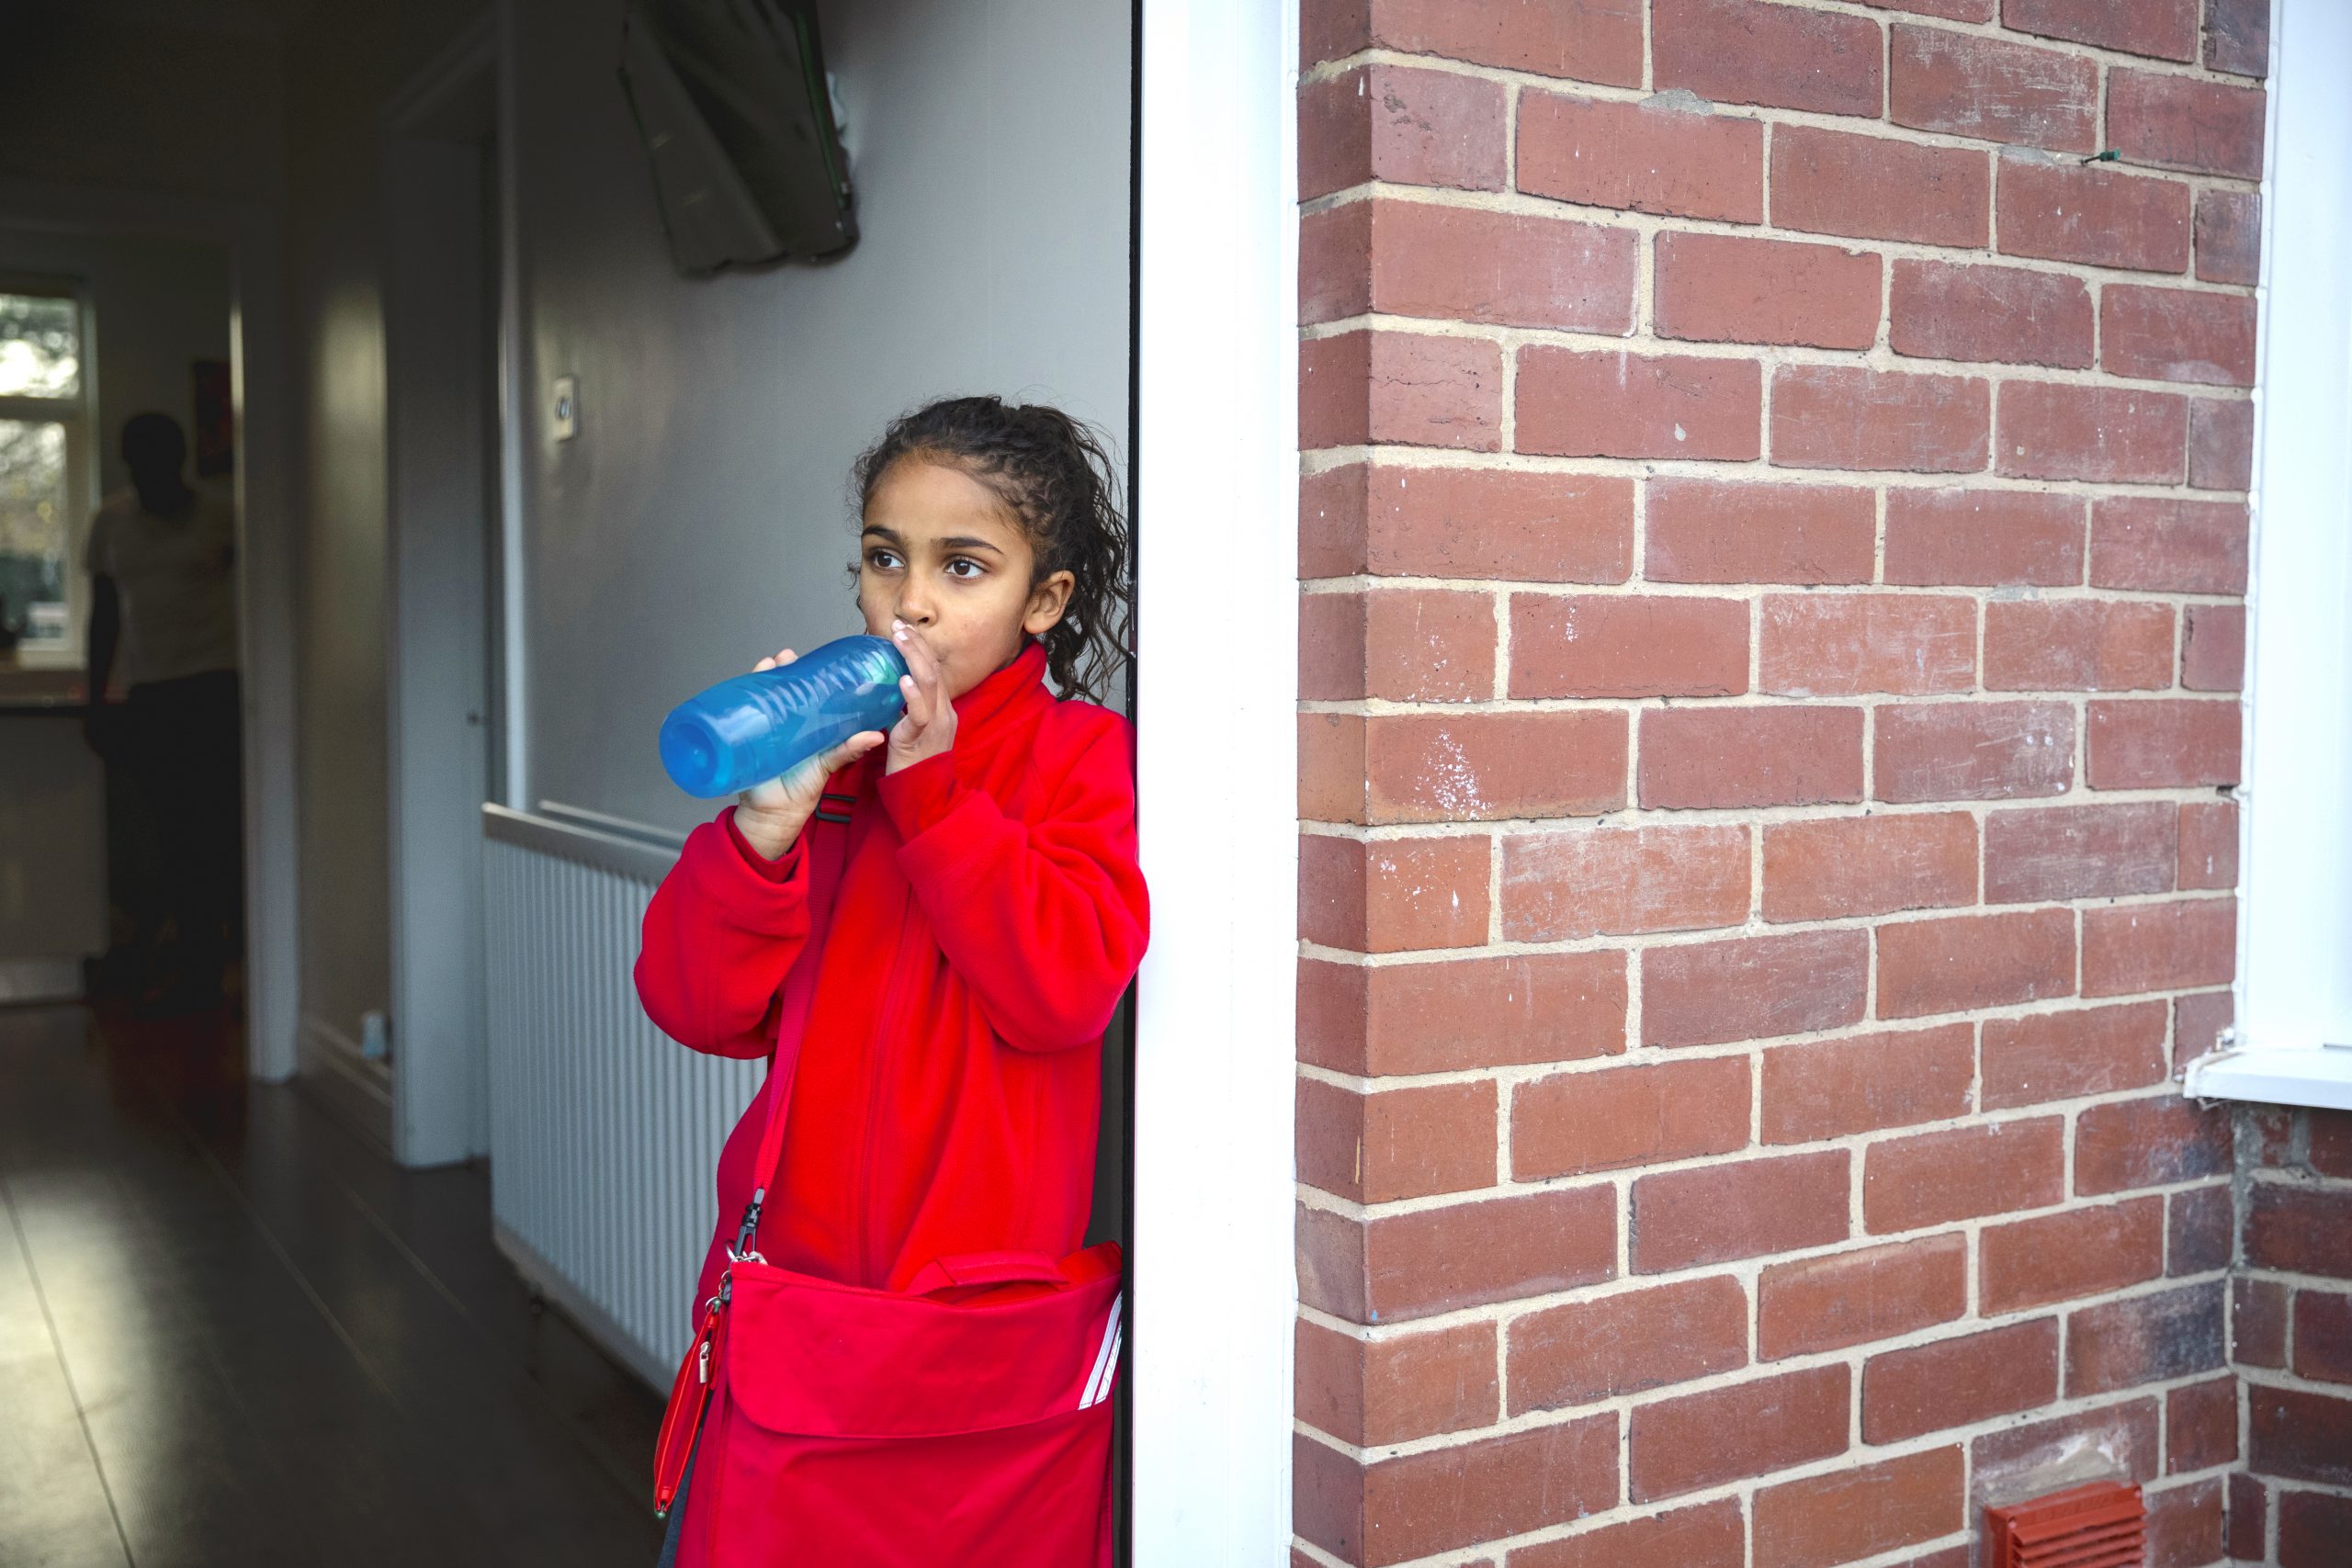
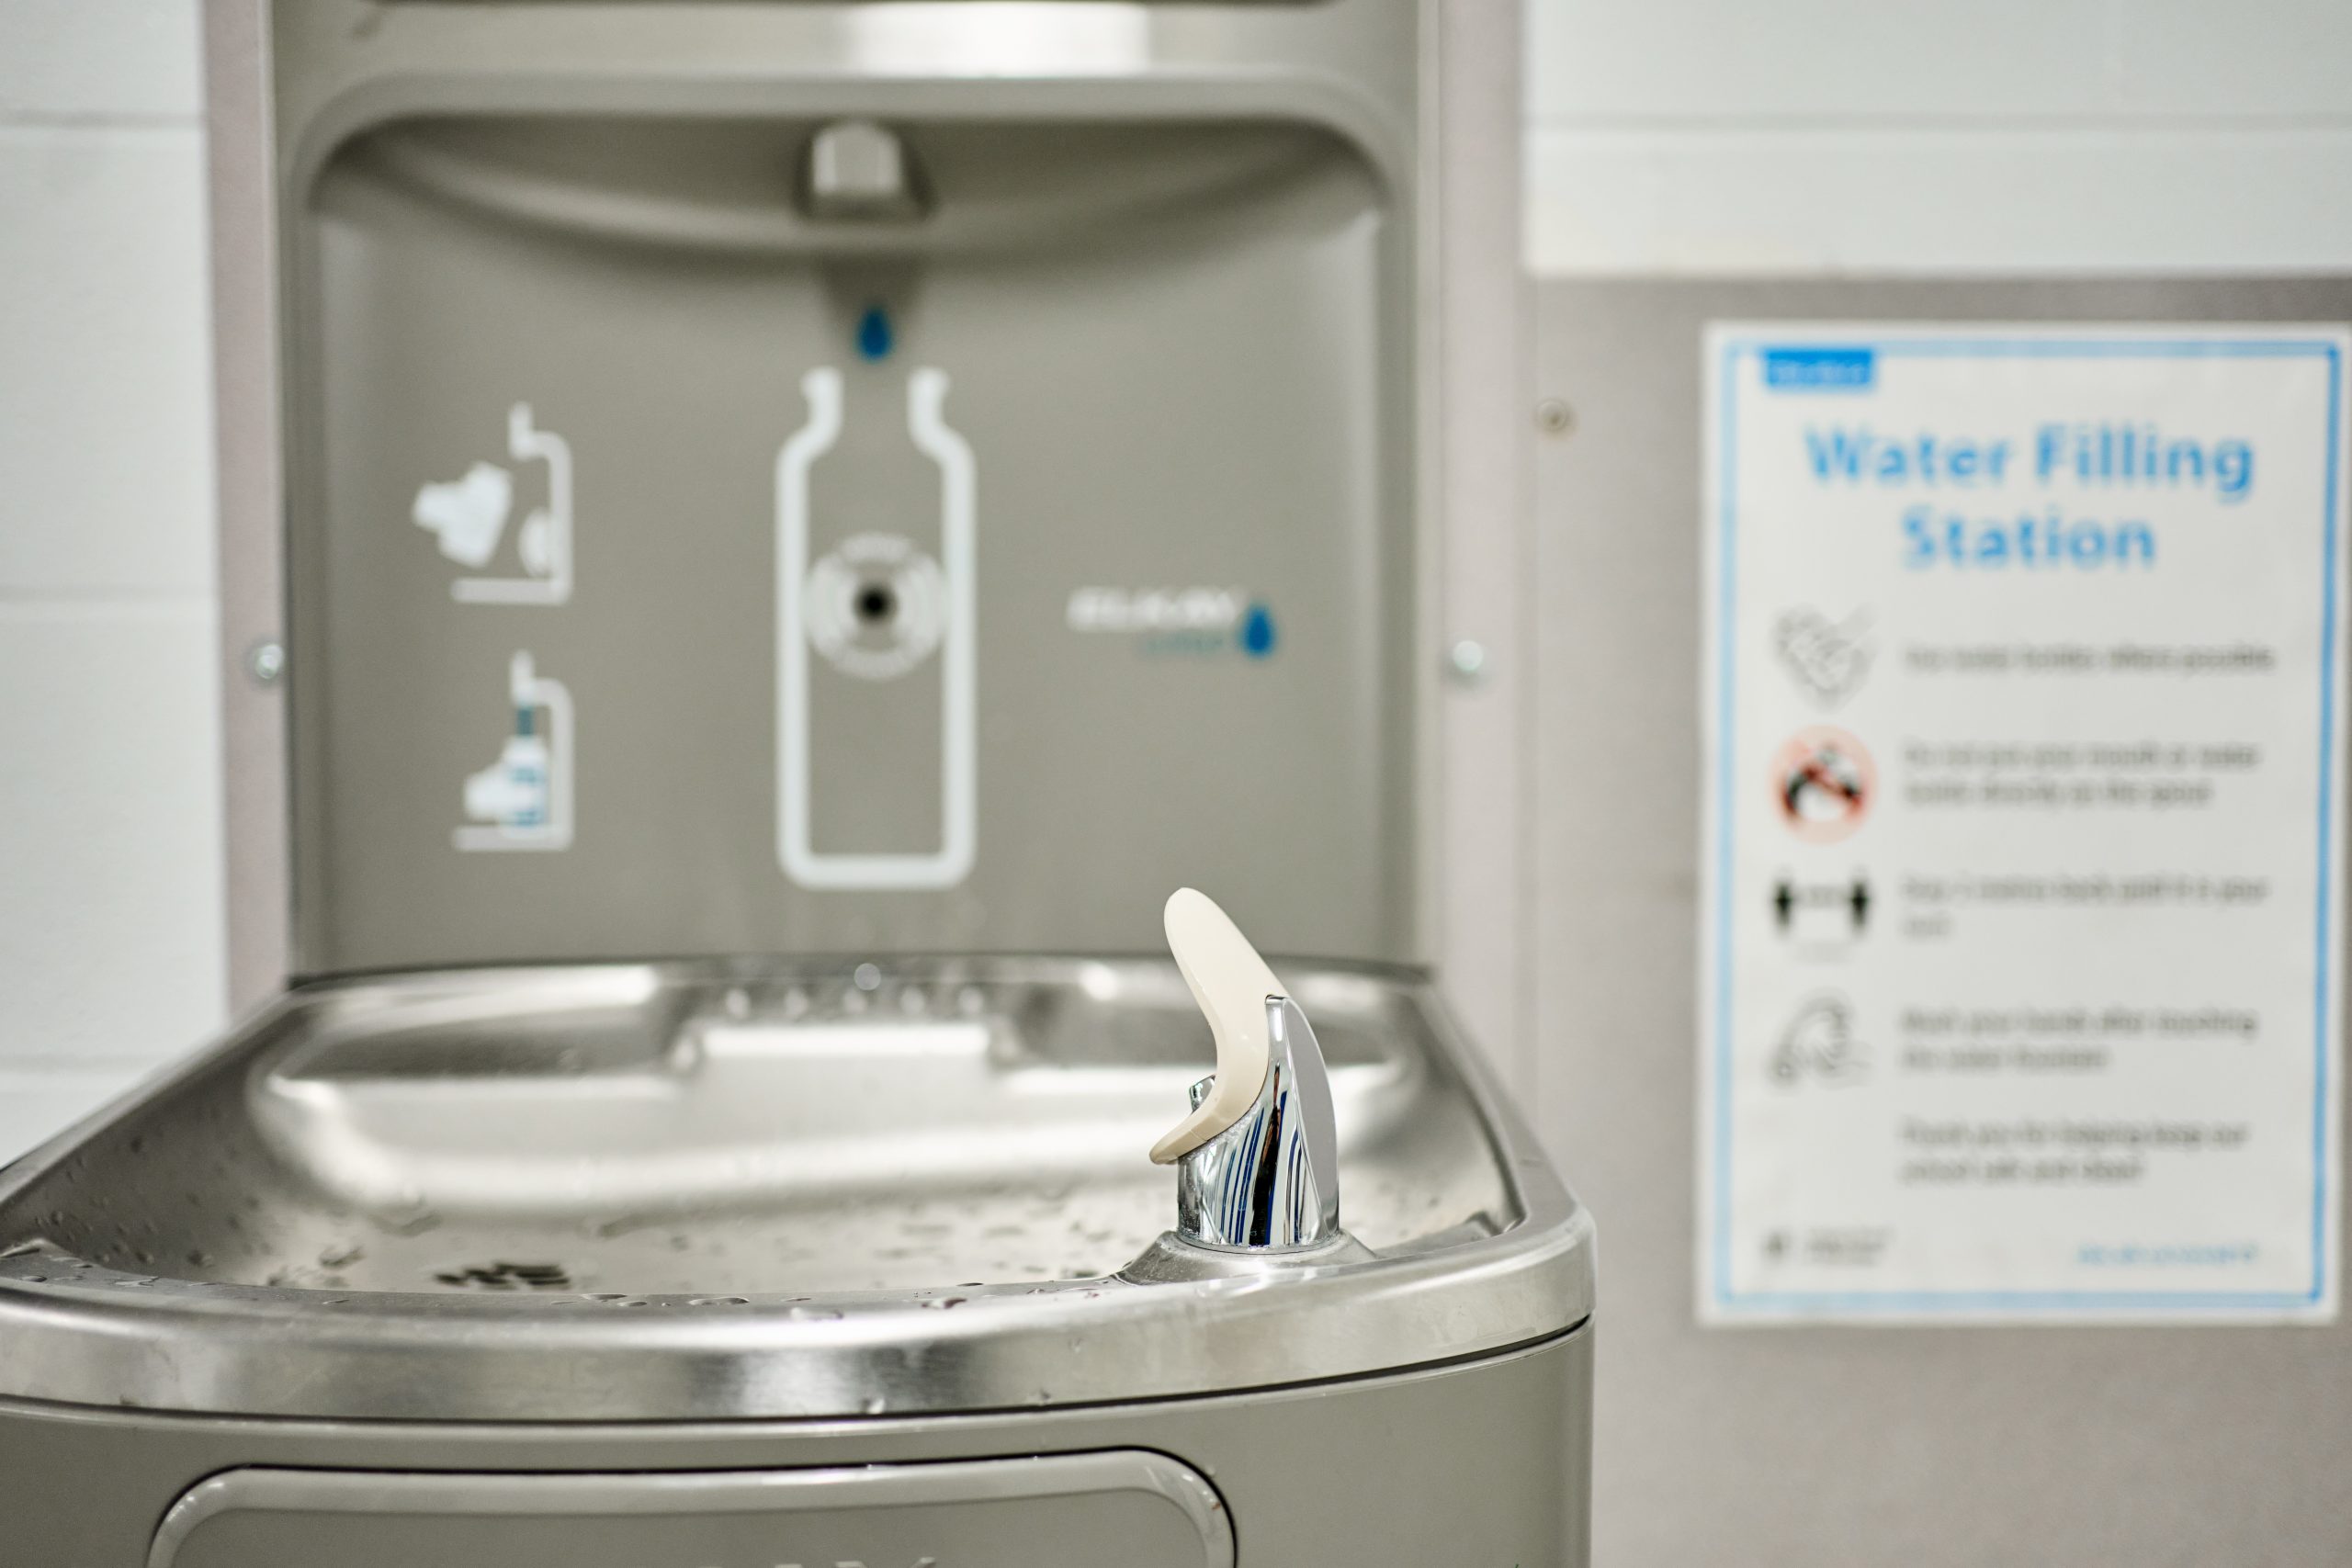
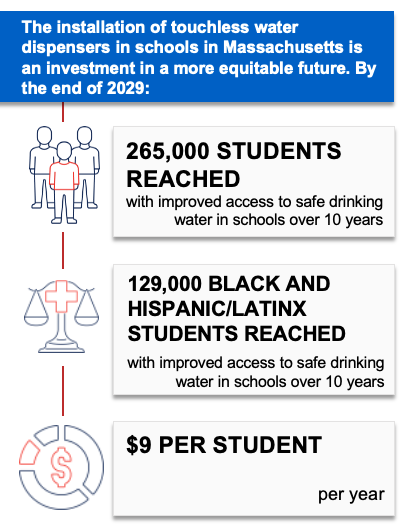
Water Dispensers in Schools
This strategy applies an equity lens to increasing water access by installing touchless water dispensers on or near school cafeteria lunch lines in K-8 Massachusetts public schools with identified needs. Priority schools would be those with elevated concentrations of lead in drinking water documented via state lead testing programs1 and located in cities and towns with Environmental Justice designation based on the community’s share of households with lower incomes, limited English proficiency, or individuals identifying as Black, Indigenous, or people of color.2
Better drinking water access in schools has been shown to increase water intake and may help promote a healthy weight.3 The Massachusetts Departments of Public Health and Elementary and Secondary Education would provide outreach to school districts to encourage the installation of water dispensers through existing relationships.
Additional Key Findings
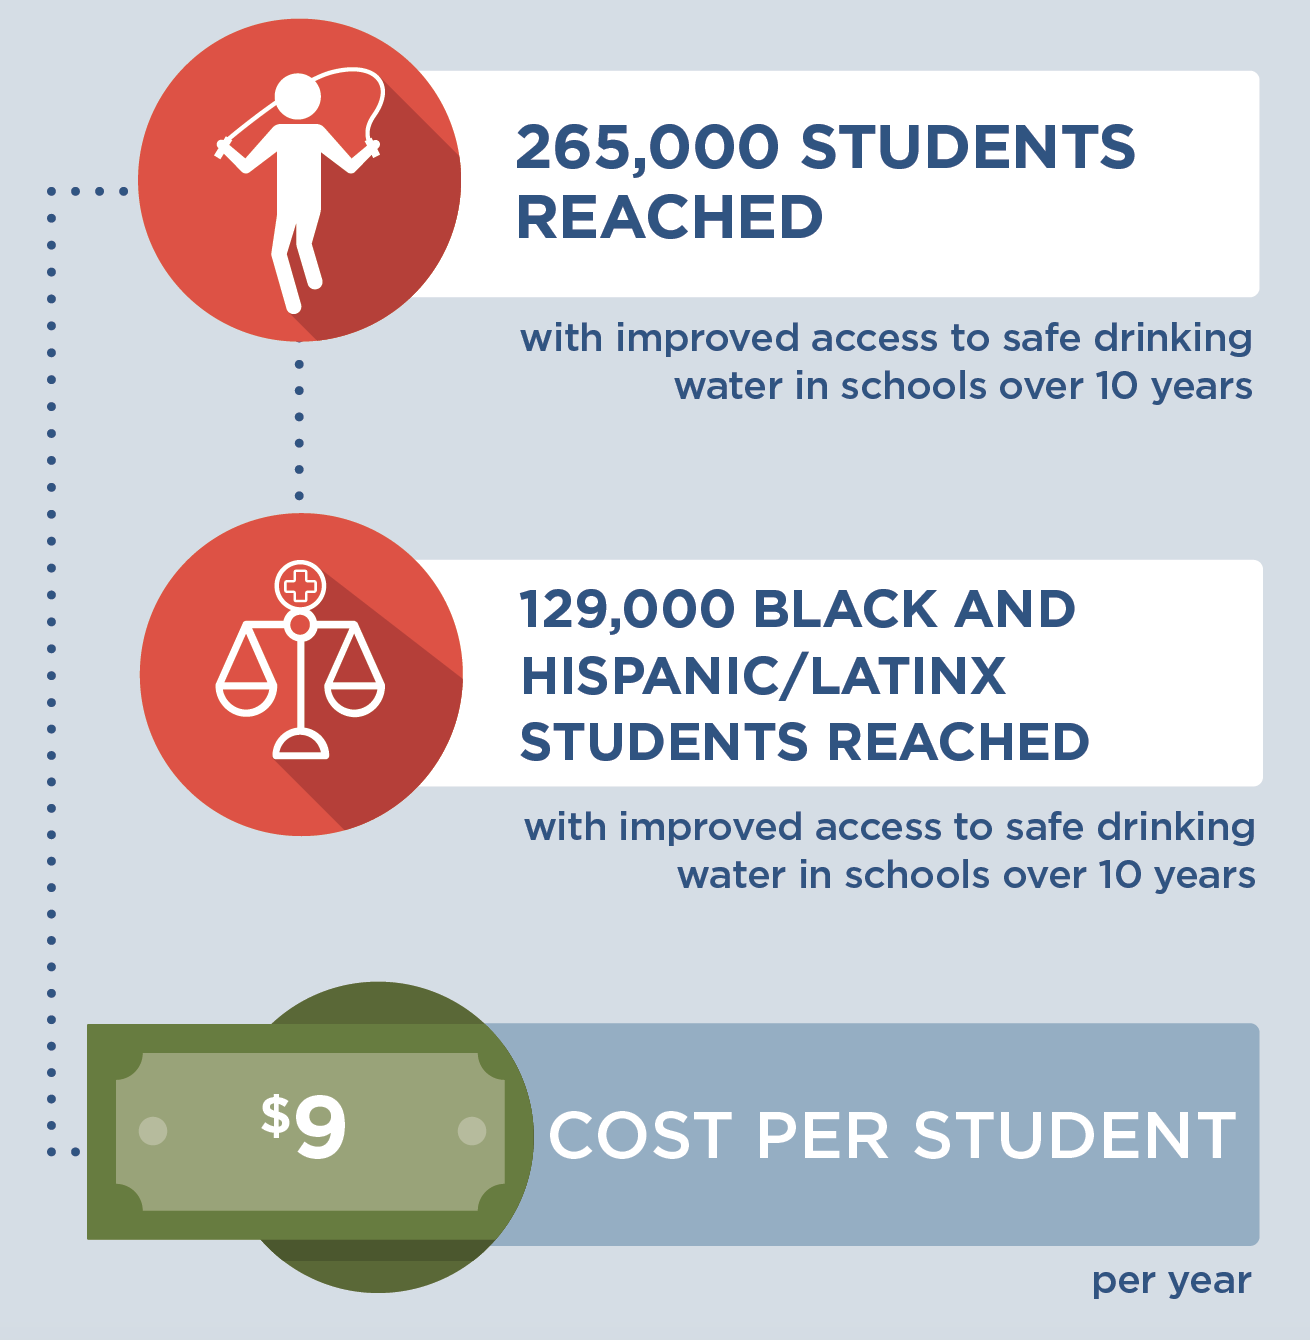
If water dispensers were installed in K-8 public schools in Massachusetts, it is likely to be cost-effective at commonly accepted thresholds4 based on net cost per population health improvement related to excess weight, at a cost of $72,700 per quality-adjusted life year gained.
Additionally, this strategy would prioritize installing water dispensers in schools that identify elevated concentrations of lead in their drinking water and in school districts located in communities meeting criteria for Environmental Justice designation.2 Fifty percent of the students that would gain access to improved drinking water would be Black and Hispanic/Latinx, a higher proportion than the state’s student population overall.5
To learn more about this strategy, read the research brief.
- McCulloch SM, Barrett JL, Reiner JF, Cradock AL, Gortmaker SL. Massachusetts: Water Dispensers in Schools {Issue Brief}. The CHOICES Learning Collaborative Partnership at the Harvard T.H. Chan School of Public Health, Boston, MA; June 2023.
References
1. MA Executive Office of Energy and Environmental Affairs. Lead and Copper in School Drinking Water Sampling Results. Accessed December 5, 2022. https://www.mass.gov/service-details/lead-and-copper-in-school-drinking-water-sampling-results
2. MA Executive Office of Energy and Environmental Affairs. Environmental Justice Populations in Massachusetts. Accessed April 7, 2023. https://www.mass.gov/info-details/environmental-justice-populations-in-massachusetts
3. Schwartz AE, Leardo M, Aneja S, Elbel B. Effect of a School-Based Water Intervention on Child Body Mass Index and Obesity. JAMA Pediatr. 2016; 170(3):220-226. doi:10.1001/jamapediatrics.2015.3778.
4. Neumann PJ, Cohen JT, Weinstein MC. Updating cost-effectiveness–the curious resilience of the $50,000-per-QALY threshold. New England Journal of Medicine. 2014 Aug 28;371(9):796-7. doi: 10.1056/NEJMp1405158. PMID: 25162885.
5. Massachusetts Department of Elementary and Secondary Education. 2022-23 Enrollment By Race/Gender Report (District). Updated December 1, 2022. Accessed April 7, 2023. https://profiles.doe.mass.edu/statereport/enrollmentbyracegender.aspx
The design for this brief and its graphics were developed by Molly Garrone, MA and partners at Burness.
This document was developed at the Harvard T.H. Chan School of Public Health through the Childhood Obesity Intervention Cost-Effectiveness Study (CHOICES) Learning Collaborative Partnership. This document is intended for educational use only. This work is supported by The JPB Foundation and the Centers for Disease Control and Prevention (U48DP006376). The findings and conclusions are those of the author(s) and do not necessarily represent the official position of the Centers for Disease Control and Prevention or other funders.