
The information in this brief is intended only to provide educational information.
The following provides a summary of findings from the CHOICES Learning Collaborative Partnership simulation model of an Active Recess policy in schools in Salt Lake County, UT to increase students’ physical activity levels during recess by installing playground markings, providing portable play equipment, and/or providing adult-led engaging activity options.
The Issue
Over the past three decades, obesity has nearly tripled in Utah.1 In the United States, health care costs for treating obesity-related health conditions such as heart disease and diabetes were $147 billion in 2008.2 Emerging prevention strategies directed at children show great promise for addressing this issue.3 Evidence shows that physical activity helps kids grow up at a healthy weight.
In Utah, only 19% of children meet the recommended 60 minutes of daily physical activity.4 Among all counties in Utah, Salt Lake County has the second highest rate of children with obesity.5 Recess periods during the school day typically last 10-15 minutes or more and are scheduled as isolated breaks or in association with lunch.6,7 Elementary school children generally spend more time in recess than physical education weekly.8 Schools often lack resources that can encourage physical activity during recess such as supportive supervision, play facilities, and equipment.9,10 On average, children spend less than 50% of recess time engaged in moderate-to-vigorous physical activity (MVPA).10
About Active Recess
We assumed that implementation would occur district-wide in public elementary and charter schools in the four school districts in Salt Lake County that provide recess but do not currently require the use of Active Recess strategies. Future grant funding would provide for installation of playground markings, provision of portable play equipment, and/or provision of adult-led engaging activities designed to increase students’ physical activity levels during school recess time. Playground markings would be installed for adult-led games that engage children in physical activity (e.g., four square, hop-scotch) and participating schools would receive portable playground equipment for use during recess time.
Comparing Costs and Outcomes
CHOICES cost-effectiveness analysis compared the costs and outcomes of implementing an Active Recess policy over 10 years (2017-2027) to costs and outcomes if the policy is not implemented. The approach assumes that no school is currently implementing Active Recess practices in these four districts, and 94% of these schools adopt Active Recess practices where all students benefit.
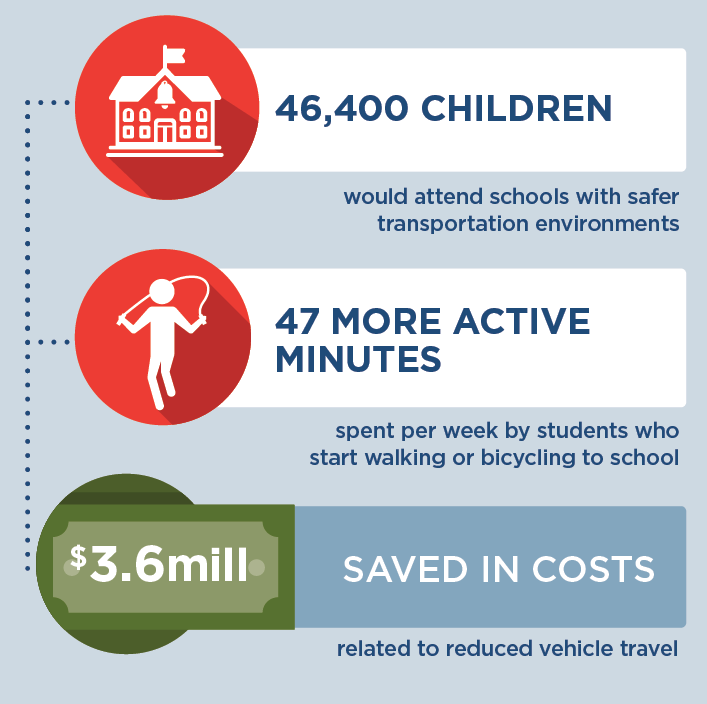
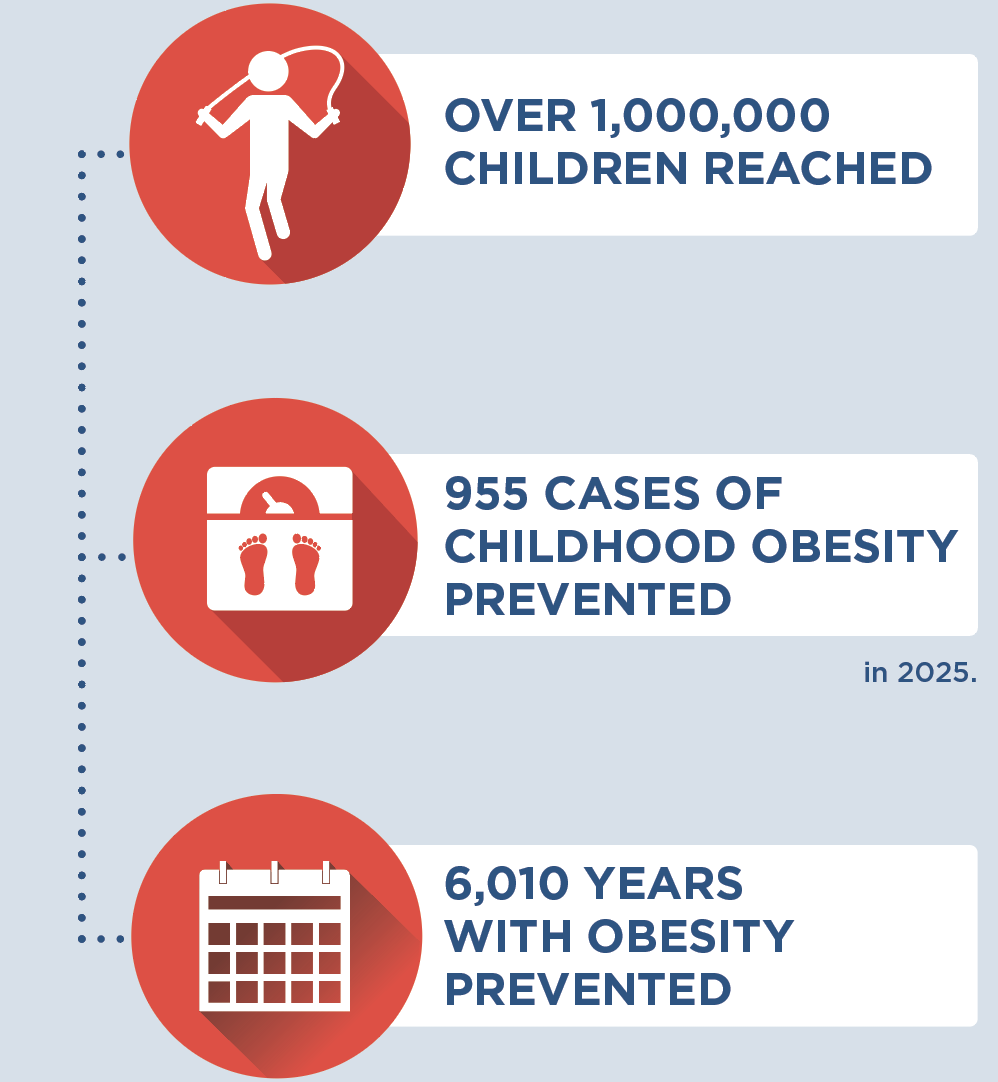
Implementing Active Recess is an investment in the future. By the end of 2027: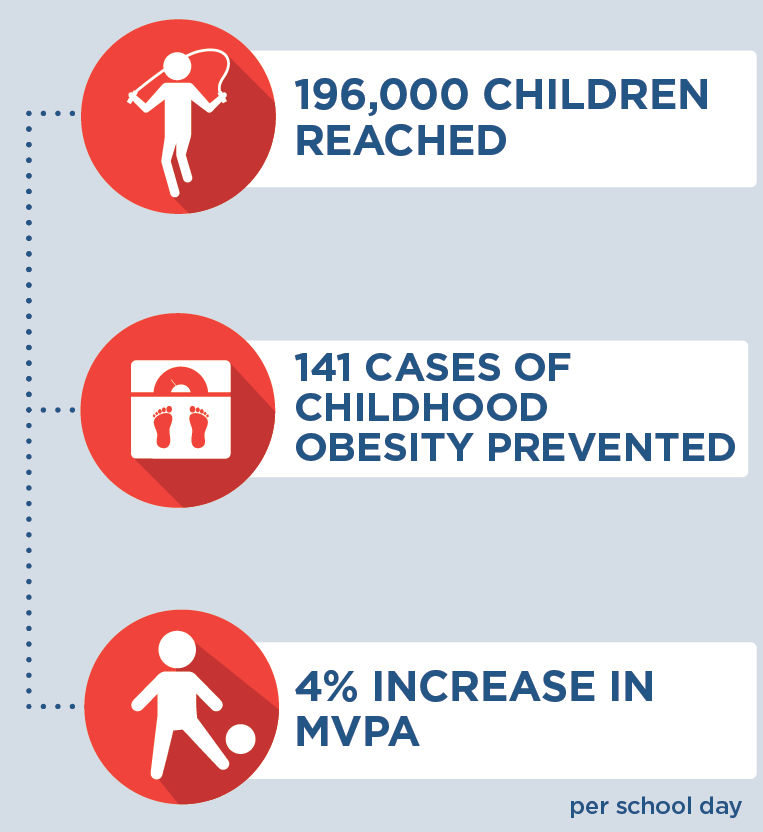 |
Conclusions and Implications
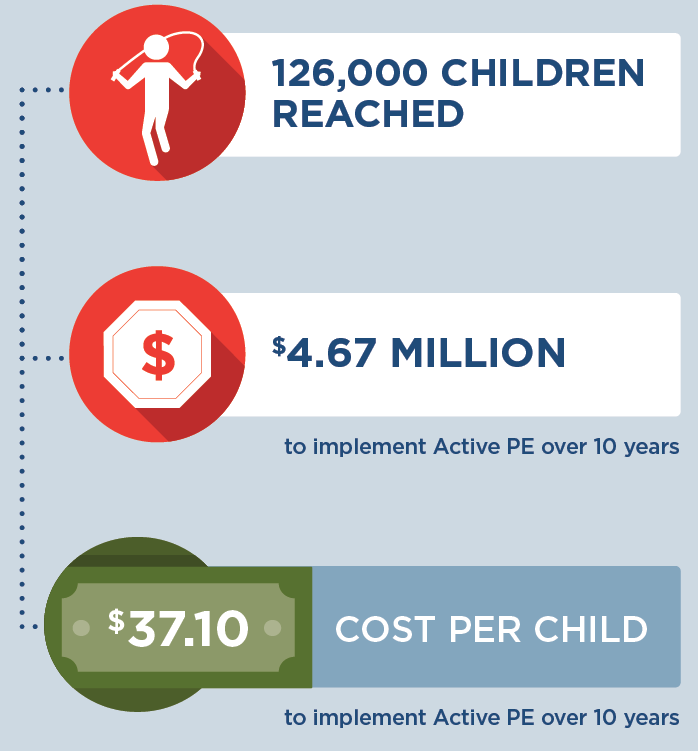
Every child deserves a healthy start in life. An Active Recess policy in Salt Lake County could help ensure that more kids have opportunities to be physically active during recess, no matter which school district they are in. Implementing a district-level policy in these Salt Lake County public elementary schools and charter schools would require an investment of $24 per student to provide the equipment and resources needed to increase physical activity levels during recess.
These results reinforce the importance of investing in prevention efforts to reduce the prevalence of obesity. This intervention would prevent 141 cases of childhood obesity in 2027 and provide the opportunity for 196,000 children to engage in active recess opportunities. For every $1.00 spent on implementing the Active Recess policy, $0.06 in health care costs would be saved. While not quantified in this analysis, there are also other positive benefits from physical activity related to cognition and academic performance that may also result in additional cost savings.11
Evidence is growing about how to help children grow up at a healthy weight. Strategies such as Active Recess are laying the foundation for a healthier future by helping schools create environments that nurture healthy habits.
References
- Utah Department of Health. (2018). Public Health Indicator Basied Information System (IBIS) Utah’s Public Health Data Resource, Health Indicator Report of Overweight or Obese. https://ibis.health.utah.gov/ibisph-view/indicator/view/OvrwtObe.UT_US.html
- Finkelstein EA, Trogdon JG, Cohen JW, Dietz W. Annual Medical Spending Attributable To Obesity: Payer-And Service-Specific Estimates. Health Affairs. 2009;28(5).
- Gortmaker, S.L., Wang, Y.C., Long, M.W., et al. Three Interventions That Reduce Childhood Obesity are Projected to Save More Than They Cost to Implement. Health Affairs, 2015, 34(11), 1932–193
- Utah Department of Health. (2018). Public Health Indicator Basied Information System (IBIS) Utah’s Public Health Data Resource, Health Indicator Report of Physical Activity Among Adolesents. https://ibis.health.utah.gov/ibisph-view/indicator/view/PhysActAdol.UT_US.html
- Utah Department of Health. (2018). Public Health Indicator Basied Information System (IBIS) Utah’s Public Health Data Resource, Health Indicator Report of Obesity Among Children and Adolescents. https://ibis.health.utah.gov/ibisph-view/indicator/view/OvrwtChild.LHD.html
- Parsad, B. & Lewis, L .Calories In, Calories Out: Food and Exercise in Public Elementary Schools, 2005, National Center for Education Statistics, U.S. Department of Education Report No. NCES 2006–057, (2006). https://nces.ed.gov/pubs2006/2006057.pdf. Accessed January 24, 2017.
- Centers for Disease Control and Prevention. The Association Between School-Based Physical Activity, Including Physical Education, and Academic Performance. Atlanta, GA: U.S. Department of Health and Human Services; (2010). https://www.cdc.gov/ healthyyouth/health_and_academics/pdf/pa-pe_paper.pdf. Accessed January 24, 2017.
- Robert Wood Johnson Foundation. Recess Rules: Why the Undervalued Playtime May Be America’s Best Investment for Healthy Kids and Healthy Schools. Princetown, NJ: Robert Wood Johnson Foundation; 2007.
- National Association for Sport and Physical Education. Recess for Elementary School Students: A Position Paper, Council on Physical Education for Children Report, (2006). http://files.eric.ed.gov/fulltext/ED497155.pdf. Accessed January 24, 2017.
- Stratton G. Promoting Children’s Physical Activity in Primary School: An Intervention Study Using Playground Markings. Ergonomics, 2000, 43(10), 538-1546.
- 2018 Physical Activity Guidelines Advisory Committee. 2018 Physical Activity Guidelines Advisory Committee Scientific Report. Washington, DC: U.S. Department of Health and Human Services, 2018. Accessed September 7, 2018
Suggested Citation:McKinnon A, Barrett J, Cradock A, Flax C. Salt Lake County: Active Recess [Issue Brief]. Salt Lake County Health Department, Salt Lake City, UT, and the CHOICES Learning Collaborative Partnership at the Harvard T.H. Chan School of Public Health, Boston, MA; December 2019. |
This issue brief was developed at the Harvard T.H. Chan School of Public Health in collaboration with the Salt Lake County Health Department through participation in the Childhood Obesity Intervention Cost-Effectiveness Study (CHOICES) Learning Collaborative Partnership. This brief is intended for educational use only.

 Upon visiting an elementary school physical education (PE) class, you would expect to find children engaged in exercise. In reality, the typical PE class in the US may not be so active. While most elementary schools do require some PE, students on average spend less than half of class time engaged in moderate-to-vigorous physical activity (MVPA). Additionally, PE activity levels are lower when more class time is spent organizing students or reviewing rules and techniques, and when PE classes are led by classroom teachers instead of trained PE specialists.