Setting: School

Strategy Profile: Active Recess

Three kids at the playground

The information in this resource is intended only to provide educational information. This profile describes the estimated benefits, activities, resources, and leadership needed to implement a strategy to improve child health. This information can be useful for planning and prioritization purposes.

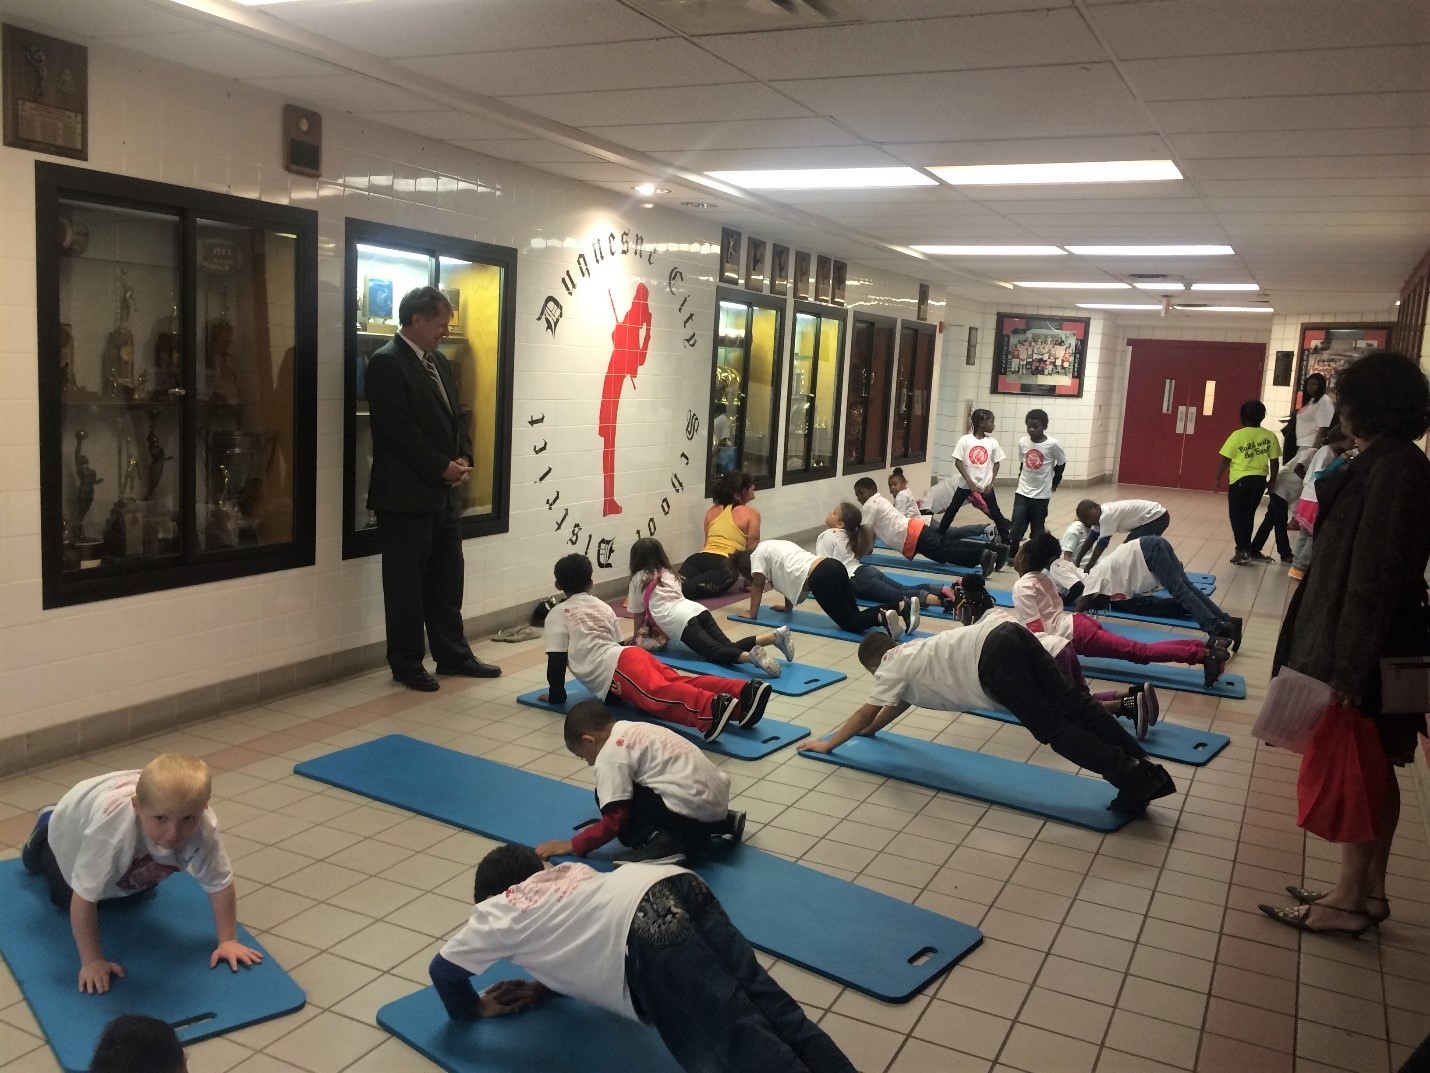
  • Active Recess is a program to increase physical activity during elementary school recess with structured activities, playground markings, and/or portable play equipment. This program is implemented in elementary schools to promote physical activity during recess.

What population benefits?

Children in grades K-5 (5-11 years old).

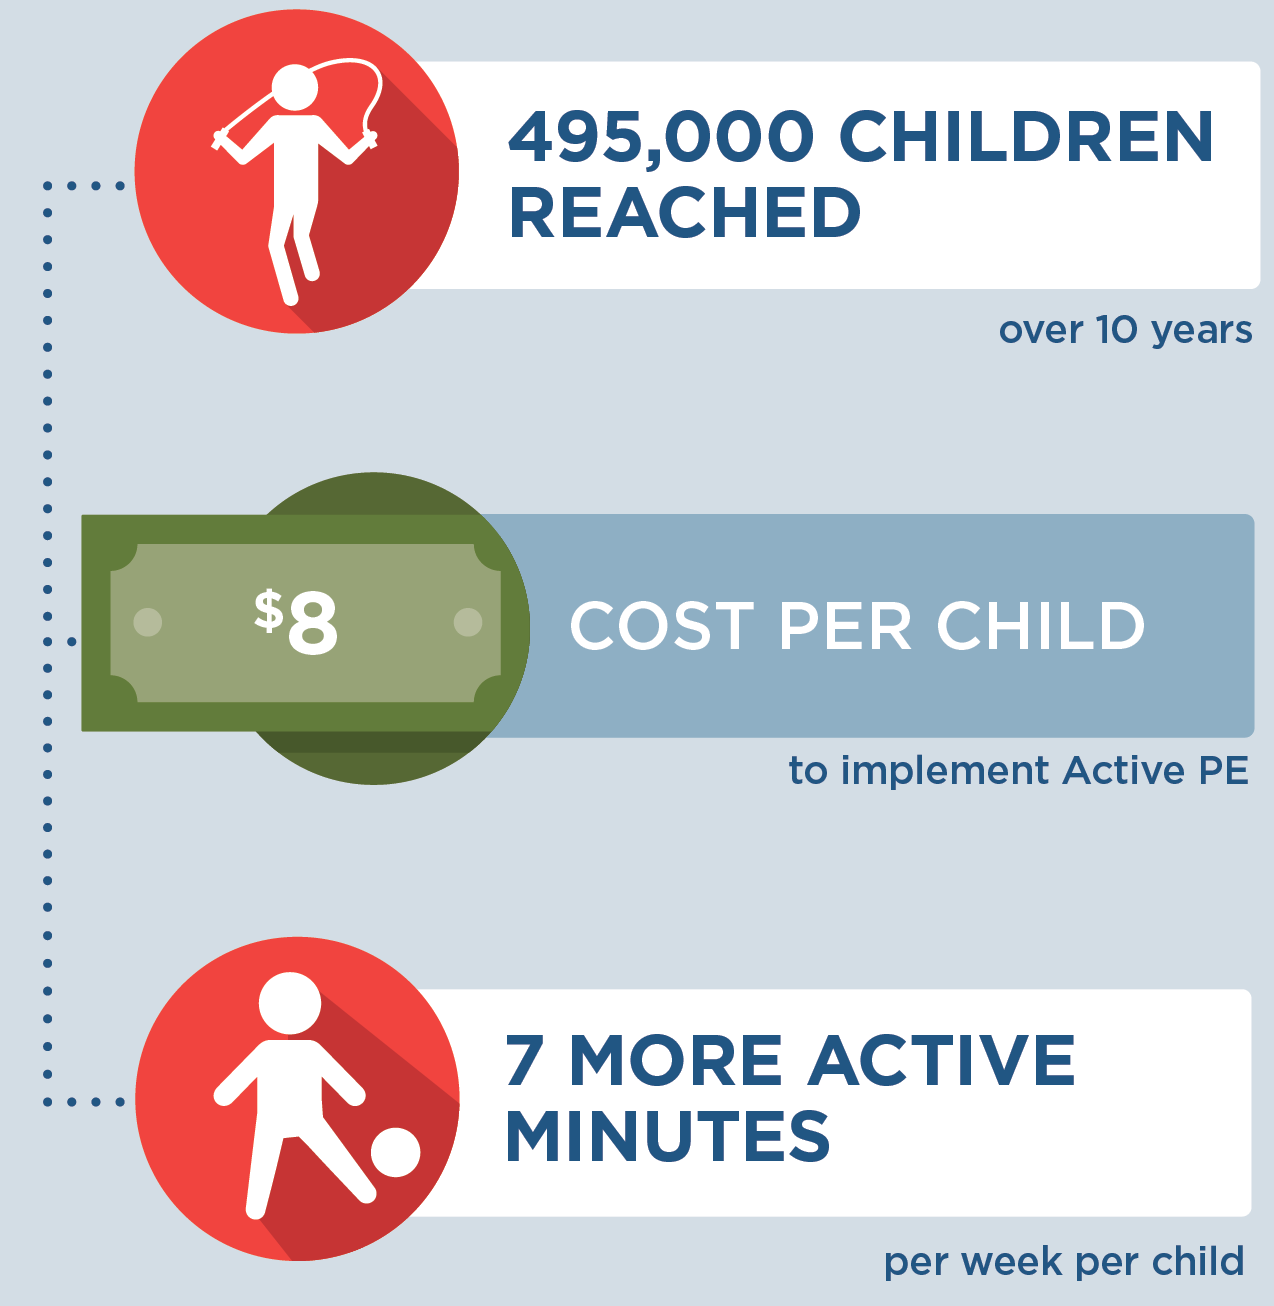
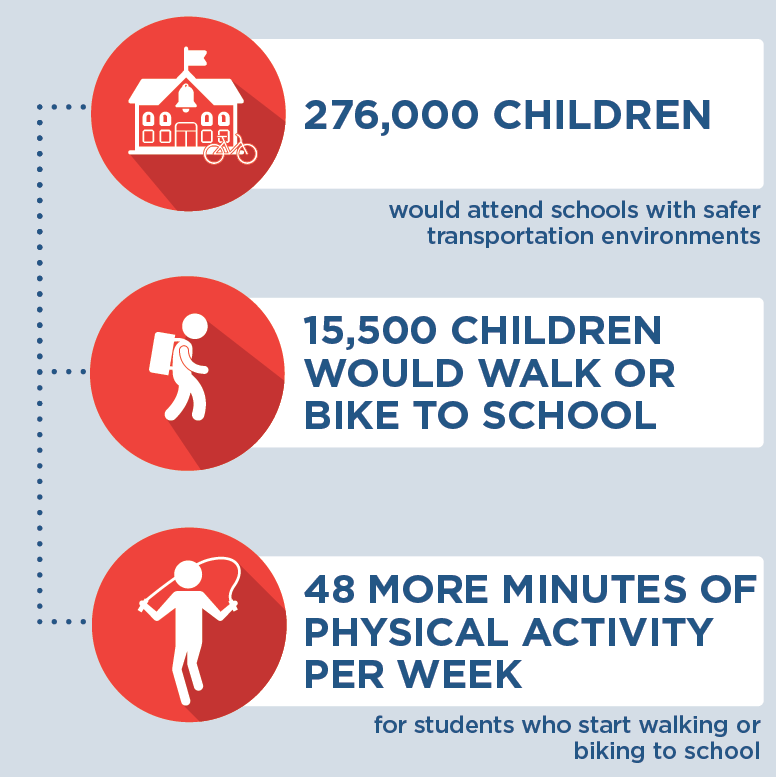
What are the estimated benefits?

Relative to not implementing the strategy
Increase students’ moderate-to-vigorous physical activity levels and, in turn, promote healthy child weight.

What activities and resources are needed?

Activities Resources Who Leads?
Train teachers and recess monitors on recess supervision strategies to increase physical activity • Time for trainer to lead trainings on supervision strategies to increase physical activity
• Time for teachers and recess monitors to attend trainings
• Travel costs for the trainers, teachers, and recess monitors
School district coordinator
Paint markings onto outdoor play spaces • Time for volunteers to paint markings
• Time for school staff member to supervise painting
• Painting material costs
School staff member
Purchase portable playground equipment • Playground equipment costs Schools
Strategy Modification

Some state and local health agencies have added to this strategy the costs of coordinating a broader state-level program when envisioning it being implemented in more than one district. This would add time for a state-level coordinator in the Department of Education to oversee the program and provide training to participating district-level coordinators. With this modification, this strategy could reach more children.


FOR ADDITIONAL INFORMATION

Cradock AL, Barrett JL, Kenney EL, Giles CM, Ward ZJ, Long MW, Resch SC, Pipito AA, Wei ER, Gortmaker SL. Using cost-effectiveness analysis to prioritize policy and programmatic approaches to physical activity promotion and obesity prevention in childhood. Prev Med. 2017 Feb;95 Suppl: S17-S27. doi: 10.1016/j.ypmed.2016.10.017. Supplemental Appendix with strategy details available at: https://ars.els-cdn.com/ content/image/1-s2.0-S0091743516303395-mmc1.docx

Selected CHOICES research brief including cost-effectiveness metrics:
McKinnon A, Barrett J, Cradock AL, Flax C. Salt Lake County: Active Recess {Issue Brief}. Salt Lake County Health Department, Salt Lake City, UT, and the CHOICES Learning Collaborative Partnership at the Harvard T.H. Chan School of Public Health, Boston, MA; December 2019. Available at: https://choicesproject.org/publications/brief-active-recess-salt-lake-county/


Suggested Citation

CHOICES Strategy Profile: Active Recess. CHOICES Project Team at the Harvard T.H. Chan School of Public Health, Boston, MA; April 2022.

Funding

This work is supported by The JPB Foundation and the Centers for Disease Control and Prevention (U48DP006376). The information provided here is intended to be used for educational purposes. Links to other resources and websites are intended to provide additional information aligned with this educational purpose. The findings and conclusions are those of the author(s) and do not necessarily represent the official position of the Centers for Disease Control and Prevention or other funders.

Adapted from the TIDieR (Template for Intervention Description and Replication) Checklist

← Back to Resources

Brief: Improving Drinking Water Equity and Access in California Schools

School-aged girl drinking water from a reusable water bottle

The information in this brief is intended only to provide educational information.

This brief summarizes a CHOICES Learning Collaborative Partnership model examining a strategy to improve access to drinking water in California schools. This voluntary water equity and access program involves the installation of touchless chilled water dispensers on or near school cafeteria lunch lines in K-8 non-charter California public schools that have adequate plumbing.

The Issue

All children should have access to clean, appealing, and free drinking water no matter where they live or where they go to school. Providing appealing access to drinking water gives students a healthier alternative to sugary drinks, like sweetened fruit drinks, sports drinks, and soda. Students drink more water when schools provide access to water at lunch at no charge,1 and improving school water access can help kids grow up at a healthy weight.2,3

In California, one in 10 schools reported having no access to free drinking water where meals are served despite state and federal requirements.4,5 Additionally, only one in five schools reported meeting criteria considered the standard for excellence in water access.4 Creating a healthy, equitable school environment that includes appealing drinking water access can help set children up for a healthy future.

About the Water Dispensers in Schools Strategy

This strategy focuses on increasing water access by installing touchless water dispensers at schools serving primarily families with low income, which also have a greater share of Black/African American and Latino students than other schools in California. Promoting better drinking water access in schools has been shown to increase water intake during the day and may help promote a healthy weight.3 Thus, it is a strategy that can help local health departments reach the twin goals of increasing access to and promotion of safe drinking water while decreasing access to and consumption of sugary drinks.6 Putting this strategy into place would require resources for administering the program, installing and maintaining dispensers, utility and disposable cup usage, lead testing and remediation, and delivering water-promotion education.

Comparing Costs and Outcomes

A CHOICES cost-effectiveness analysis compared the costs and outcomes of installing touchless water dispensers in schools with the costs and outcomes associated with not implementing the voluntary water equity and access program over 10 years (2020-2030).

Installation of touchless water dispensers in schools in California is an investment in a more equitable future. By the end of 2030:
If touchless water dispensers were installed in schools in California, then, by the end of 2030, 1.88 million children would be reached with improved access to safe drinking water in schools over 10 years; $12 million would be saved in health care costs over 10 years; and this intervention would cost $6 per child per year to implement.

Conclusions and Implications

Installing water dispensers in K-8 public schools is an effective strategy for increasing access to clean, appealing, and free drinking water. Over 10 years, this strategy is expected to improve drinking water access and consumption for over 1.8 million students in California. This strategy is estimated to prevent 3,660 cases of childhood obesity in 2030 and would cost on average $6 per child to implement each year. Comparatively, the value of lunch served to students is $3 per day or about $600 per year.7 While the costs to implement this strategy would be $21,500 per school over 10 years, there would be an estimated $12 million in obesity-related health care cost savings over the same time period.

Improving students’ access to free, clean drinking water could promote health equity. Latino youth report less availability of drinking water access in schools,8 and Black/African American youth are less likely to be adequately hydrated compared with White non-Latino youth.9 Focusing drinking water access improvements in schools with high percentages of Black/African American and Latino students may benefit these populations the most. In addition to promoting a healthy weight, this strategy may also benefit children in other ways. Adequate water consumption can lead to improvements in well-being and support cognitive function.10 Fluoridated water intake also prevents dental caries.11

Though investment is required, every student deserves access to clean, appealing drinking water, and this strategy can be a part of a suite of interventions that support children and their families. Many preventive strategies play a critical role in helping children establish healthy habits early on in life. Focusing on supporting these healthy habits now can help more children grow up at a healthy weight.

References

  1. Bogart LM, Babey SH, Patel AI, Want P, Schuster MA. Lunchtime school water availability and water consumption among California adolescents. Journal of Adolescent Health. 2016; 58(1):98-103, doi: 10.1016/j.jadohealth.2015.09.007.

  2. Schwartz AE, Leardo M, Aneja S, Elbel B. Effect of a School-Based Water Intervention on Child Body Mass Index and Obesity. JAMA Pediatr. 2016; 170(3):220-226. doi:10.1001/jamapediatrics.2015.3778.

  3. Kenney EL, Cradock AL, Long MW, et al. Cost-Effectiveness of Water Promotion Strategies in Schools for Preventing Childhood Obesity and Increasing Water Intake. Obesity. 2019;27(12):2037-2045.

  4. Altman EA, Lee KL, Hecht CA, Hampton KE, Moreno G, Patel AI. Drinking water access in California schools: Room for improvement following implementation of school water policies. Preventive Medicine Reports. 2020;19:101143. Published 2020 Jun 8. doi:10.1016/j.pmedr.2020.101143.

  5. California Department of Education. Drinking Water for Students in Schools. Reviewed January 14, 2020. https://www.cde.ca.gov/ls/nu/he/water.asp#:~:text=California%20Education%20Code%20Section%2038086%20states%20that%20if%20a%20school,reasons%20why%2C%20whether%20due%20to. Accessed February 16, 2021. 

  6. California Department of Public Health. FFY 2020-2022 SNAP-Ed Local Health Departments Programmatic Priorities. Published December 10, 2018. https://www.cdph.ca.gov/Programs/CCDPHP/DCDIC/NEOPB/CDPH%20Document%20Library/Branch16Add2FFY20-22SNAPEdLHD.pdf. Accessed January 29, 2021.

  7. California Department of Education. 2019-20 CNP Reimbursement Rates. https://www.cde.ca.gov/ls/nu/rs/rates1920.asp. Accessed December 12, 2020.

  8. Onfurak SJ, Park S, Wilking C. Student-reported school drinking fountain availability by youth characteristics and state plumbing codes. Preventing Chronic Disease. 2014; 11: E60, doi: 10.5888/pcd11.130314. 

  9. Kenney EL, Long MW, Cradock AL, Gortmaker SL. Prevalence of inadequate hydration among U.S. children and disparities by gender and race/ethnicity: National Health and Nutrition Examination Survey, 2009–2012. American Journal of Public Health. 2015; 105(8): e113-8, doi: 10.2105/AJPH.2015.302572.

  10. Popkin BM, D’Anci KE, Rosenberg IH. Water, hydration, and health. Nutition Reviews. 2010 Aug;68(8):439-58.

  11. American Dental Association and Centers for Disease Control. Nature’s Way to Prevent Tooth Decay: Water Fluoridation. Published 2006. https://www.cdc.gov/fluoridation/pdf/natures_way.pdf. Accessed July 13, 2021. 

Suggested Citation:

Gouck J, Whetstone L, Walter C, Pugliese J, Kurtz C, Seavey-Hultquist J, Barrett J, McCulloch S, Reiner J, Cradock AL. California: Improving Drinking Water Equity and Access in California Schools {Issue Brief}. California Department of Public Health, Sacramento, CA, the County of Santa Clara Public Health Department, San Jose, CA, and the CHOICES Learning Collaborative Partnership at the Harvard T.H. Chan School of Public Health, Boston, MA; December 2021. For more information, please visit www.choicesproject.org

The design for this brief and its graphics were developed by Molly Garrone, MA and partners at Burness.

This issue brief was developed at the Harvard T.H. Chan School of Public Health in collaboration with the California Department of Public Health and the County of Santa Clara Public Health Department through participation in the Childhood Obesity Intervention Cost-Effectiveness Study (CHOICES) Learning Collaborative Partnership. This brief is intended for educational use only. This work is supported by The JPB Foundation and the Centers for Disease Control and Prevention (U48DP006376). The findings and conclusions are those of the author(s) and do not necessarily represent the official position of the Centers for Disease Control and Prevention or other funders.

← Back to Resources

Stories from the Field: Allegheny County Strengthens Partnerships to Make Progress Toward Local Impact

Three kids at the playground

The information in this Story from the Field is intended only to provide educational information.

In this Story from the Field, partners in Allegheny County, Pennsylvania, used the CHOICES framework and tools to engage partners in identifying and prioritizing strategic opportunities for action to promote healthy weight for children in their community.

Identifying Priorities in Allegheny County, PA

The Allegheny County Health Department (ACHD) engaged community members and public health partners through the Mobilization for Action through Planning and Partnerships (MAPP) process to help prioritize their planning efforts. The ACHD identified reducing obesity among school-aged children as a key objective to improve chronic disease risk factors – a priority area identified in their Community Health Improvement Plan.

Strategic Alignment to Promote Child Health

The ACHD leveraged funds to support capacity building and infrastructure to establish the Healthy Kids Allegheny Task Force. This task force brought together partners with a multi-sectoral, collaborative focus on children’s health and wellness.

The task force looked to identify strategies to effectively reduce childhood obesity and to ensure their resources were being invested responsibly. They also were looking for ways to advance the strategic priorities of Live Well Allegheny – a county-wide campaign to improve the overall health and wellness of Allegheny County residents.

Engaging Partners to Create Evidence for Action

The ACHD teamed up with the Childhood Obesity Intervention Cost-Effectiveness Study (CHOICES) Project through its Learning Collaborative Partnership program. In this program, the CHOICES Project works with health agencies to create new, local evidence to inform decision-making. The ACHD team saw an opportunity to identify strategies to promote child health and learned how to use local data and apply cost-effectiveness analysis methods to prioritize effective strategies to reduce childhood obesity in Allegheny County. To identify relevant strategies, the ACHD team assembled a group of key partners:

• the Healthy Kids Allegheny Task Force
• Allegheny Partners for Out-of-School Time
• Healthy Out-of-School Time
• the United Way of Southwestern Pennsylvania
• Children’s Hospital of Pittsburgh
• Live Well Allegheny Schools and Community Partners

Evaluating Opportunities to Address Key Priorities

ACHD identified partners early in the process. This facilitated engagement in the selection of school and afterschool settings as key areas for collaboration. The ACHD CHOICES team opted to focus on Active Physical Education in schools and a Healthy Snack Policy in afterschool programs from the CHOICES menu of strategies with strong evidence for impact on health and data on cost-effectiveness.

Then, the team used CHOICES tools to identify the activities and resources needed to put these strategies into action, considered the interests of partners, and discussed what would be feasible to implement. These tools helped the team answer several key questions for planning:

1. What is the strategy?
2. Where is it implemented?
3. Which populations are impacted?
4. Who will be involved in implementing the strategy?
5. What is the status of this strategy in your state, county, or city?

Lessons Learned

The ACHD CHOICES team engaged partners to establish what would need to happen to implement their chosen strategies, who would need to be involved, and what impact these strategies would have in their community. These efforts enabled them to identify feasible implementation plans that are projected to make an impact on health. Using CHOICES tools and resources, the ACHD CHOICES team and partners developed evidence they could use to make a case for investing in these efforts to promote a healthy weight.


Active Physical Education in Schools

A policy requiring provision of 50% moderate-to-vigorous physical activity in physical education classes.

See what would happen if Active PE was implemented in schools in Allegheny County

Healthy Snack Policy in Afterschool Programs

A policy that sets nutrition standards to ensure that all food and beverages available in programs meet national standards to support good nutrition.

See what would happen if a healthy snack policy was implemented in afterschool programs in Allegheny County 


“Partnering with the CHOICES Team equipped the ACHD Team with a clear understanding of what it would take to implement the strategies that we modeled, and a very specific guide for doing so. Strategic alignment of our partners and the evidence from this work with CHOICES helped us to have more informed conversations with decision-makers.” – Hannah E. Hardy, Director, Chronic Disease & Injury Prevention Program, Allegheny County Health Department


Suggested Citation:

CHOICES Stories from the Field: Allegheny County Strengthens Partnerships to Make Progress Toward Local Impact. Allegheny County Health Department, Pittsburgh, PA, and the CHOICES Project Team at the Harvard T.H. Chan School of Public Health, Boston, MA; June 2021. For more information, please visit www.choicesproject.org

Funding

This work has been supported by The JPB Foundation and the Centers for Disease Control and Prevention (U48DP006376). This story from the field is intended for education use only. The findings and conclusions are those of the author(s) and do not necessarily represent the official position of the Centers for Disease Control and Prevention, or other funders.

← Back to Resources

Making CHOICES in a Health Department: Case 2 (Advanced)

People drawing on a whiteboard

In this advanced teaching case, which builds on Case 1, a fictional health department continues to work with the CHOICES Project’s Learning Collaborative Partnership to determine how to implement an evidence-based strategy that requires substantial investment, but they face a variety of additional challenges such as state politics and the complexities of health policy.

← Back to Resources

Making CHOICES in a Health Department: Case 1 (Introductory)

In this introductory teaching case, a fictional health department engages with the CHOICES Project’s Learning Collaborative Partnership to help them narrow down a list of potential strategies to reduce childhood obesity in their county through a cost-effectiveness lens.

← Back to Resources

Brief: Safe Routes to School in Wisconsin

Young girl riding bike at the Safe Routes to School Family Fun Night Event in Neenah, Wisconsin in May 2018; orange cone in the background

The information in this brief is intended only to provide educational information.

This brief summarizes a CHOICES Learning Collaborative Partnership model examining the expansion of a regional Safe Routes to School program in K-8 public and private schools in Wisconsin. Safe Routes to School Programs help children safely walk and bike to school by incorporating principles of the six E’s: engagement, encouragement, equity, engineering, education, and evaluation.

The Issue

In Wisconsin, just three out of every 10 children achieve the 60 minutes of physical activity recommended daily for health.1 Over recent decades, the number of students walking and bicycling to school has declined,2 eliminating an important physical activity opportunity. Adopting programs that make it safer and easier to walk or bike to school can increase the number of students using these physically active travel modes and can also allow students to incorporate physical activity into a daily routine.3 Every child should have the opportunity to be healthy, and all kids need opportunities to be physically active, no matter where they live or where they go to school. This study estimates the cost-effectiveness of increasing funding and diversifying funding sources to expand a regional model for Safe Routes to School programs for those schools that have not yet implemented comprehensive Safe Routes to School programs in Wisconsin.

About Safe Routes to School

Safe Routes to School programs that adopt the six E’s, including improvements to local sidewalks and roads around schools, providing pedestrian and bike safety education, and offering encouragement and promotion activities, can increase the number of students walking and bicycling to school.2 This study looked at the scaled expansion of East Central Wisconsin Regional Planning Commission’s Safe Routes to School program to other regional planning commissions across Wisconsin. A state-wide Safe Routes to School Program Coordinator would work with regional SRTS Coordinators and advisory committees, providing oversight and administration of the allocated funding to support projects in their region. Each regional planning commission would coordinate education, encouragement, and promotion activities across funded schools in their region. Local municipalities would lead projects to improve the safety of sidewalks and road infrastructure.

Comparing Costs and Outcomes

A CHOICES cost-effectiveness analysis compared the costs and outcomes of expanding Safe Routes to School in Wisconsin with the costs and outcomes associated with not implementing the program over 10 years (2020-2030).

Implementing Safe Routes to School in Wisconsin is an investment in child health. By the end of 2030:

If Safe Routes to School was expanded in Wisconsin, then by the end of 2030, 151,000 children would attend schools with safer transportation environments, and children who start walking or biking to school would get 48 more active minutes per week. This program would cost $58 per child annually to implement, for those children attending schools that adopt Safe Routes to School programs.

Conclusions and Implications

Every student should be able to walk or bike to school safely. Expanding East Central’s regional Safe Routes to School model in Wisconsin could support safer walking and biking environments and provide programmatic education and encouragement initiatives for 151,000 elementary and middle school students over 10 years. We estimate that the Safe Routes to School program, which includes education and promotion activities, improvements to sidewalks and road infrastructure, and coordination support, would cost $58 per student per year. Over 10 years, these activities to expand the regional SRTS model in Wisconsin would cost about $215,000 per school. At the same time, more than 8,000 students would start walking and biking to school, and they would get 48 more minutes of physical activity per week. This translates to better health outcomes and more kids at a healthy weight in Wisconsin, with 16 fewer cases of obesity in the year 2030 alone.

In addition to getting students more active,4,5 SRTS initiatives may also reduce the risk of pedestrian and bicycle injury, exposure to unsafe traffic, and air pollution.3,6,7 Greater safety, improved health from increased physical activity, and lesser environmental impact from decreased automobile use provide economic benefits to the community.8 In Wisconsin, the costs of implementing SRTS projects could be offset by savings associated with reduced vehicle travel, potentially amounting to $2.19 million in environment-related cost savings over 10 years. Further, families whose students start walking or bicycling would also drive less and could save an average of $1,120 by not driving their students to school. Walking and biking are great ways for kids to be active, and this program invests in ways to ensure that more students can do so safely while developing healthy lifestyle habits that would continue into adulthood.

References

  1. Child and Adolescent Health Measurement Initiative. 2018-2019 National Survey of Children’s Health (NSCH) data query. https://www.nschdata.org/browse/survey/results?q=7700&r=51. Accessed October 29, 2020.

  2. McDonald, NC. Active transportation to school: trends among US schoolchildren, 1969–2001. American Journal of Preventive Medicine. 2007; 32(6), 509-516.

  3. Stewart O, Vernez Moudon A, Claybrooke C. Multistate Evaluation of Safe Routes to School Programs. American Journal of Health Promotion. 2014;28(3);S89-S96.

  4. Cooper, Jago, Southard, Page. Active Travel and Physical Activity across the School Transition: The PEACH Project. Medicine & Science in Sports & Exercise. 2012; 44(13); 1890–1897.

  5. Huang WY, Wong SH, He G. Is change to active travel to school an important source of physical activity for Chinese children? Pediatric Exercise Science. 2017; 29(1):161-168.

  6. DiMaggio, C, & Li, G. Effectiveness of a safe routes to school program in preventing school-aged pedestrian injury. Pediatrics. 2013;131(2);290-296.

  7. DiMaggio C, Chen Q, Muennig PA, Li G. Timing and effect of a safe routes to school program on child pedestrian injury risk during school travel hours: Bayesian changepoint and difference-in-difference analysis. Injury Epidemiol. 2014;1:17.

  8. Jacob V, Chattopadhyay SK, Reynolds JA, et al. Economics of Interventions to Increase Active Travel to School: A Community Guide Systematic Review. American Journal of Preventive Medicine. 2021;60(1):e27-e40.

Suggested Citation:

McCulloch SM, Barrett JL, Reiner JF, Cradock AL. Wisconsin: Safe Routes to School {Issue Brief}. Wisconsin Department of Health Services, Division of Public Health, Madison, WI, & East Central Wisconsin Regional Planning Commission, Menasha, WI and the CHOICES Learning Collaborative Partnership at the Harvard T.H. Chan School of Public Health, Boston, MA; May 2021. For more information, please visit www.choicesproject.org

Funding for the Survey of the Health of Wisconsin (SHOW) was provided by the Wisconsin Partnership Program PERC Award (233 AAG9971). The authors would also like to thank the University of Wisconsin Survey Center, SHOW administrative, field, and scientific staff, as well as all the SHOW participants for their contributions to this study.

The design for this brief and its graphics were developed by Molly Garrone, MA and partners at Burness.

This issue brief was developed at the Harvard T.H. Chan School of Public Health in collaboration with the Wisconsin Department of Health Services through participation in the Childhood Obesity Intervention Cost-Effectiveness Study (CHOICES) Learning Collaborative Partnership. This brief is intended for educational use only. This work is supported by The JPB Foundation and the Centers for Disease Control and Prevention (U48DP006376). The findings and conclusions are those of the author(s) and do not necessarily represent the official position of the Centers for Disease Control and Prevention or other funders.

← Back to Resources

Brief: Active Physical Education (PE) in Iowa

PE class at Carver Elementary, Des Moines Public School System

The information in this brief is intended only to provide educational information.

This brief summarizes the findings from a CHOICES Learning Collaborative Partnership model examining a strategy supporting the implementation of a guideline that 50% of physical education (PE) class time be spent in moderate-to-vigorous physical activity, consistent with best practice guidelines in quality physical education programs.

The Issue

In Iowa, only three out of every 10 children meet the national recommendation for participating in 60 minutes or more of moderate-to-vigorous physical activity each day.1 Evidence shows that physical activity helps kids grow up at a healthy weight, preventing diseases like diabetes and heart disease. Physical activity also has important brain health benefits for students, such as promoting cognition and reducing symptoms of depression.2 High-quality physical education programs in schools can help students get the recommended amount of daily physical activity.2 However, research shows that some children may spend less than half of the PE class being physically active.3

About Active PE

Active PE would support educators’ equipment, curricular, and training needs to ensure that their students can participate in high-quality physical education. Curriculum training specialists would train physical education teachers in Iowa schools in an evidence-based, standards-aligned curriculum and training program that can increase the quality of the existing physical education program and the proportion of time students are active while in PE class.4 This strategy would support the implementation of Iowa’s Physical Education standards and aligns with Iowa Department of Public Health’s goal to ensure students have the opportunity to engage in one hour of physical activity each day.5 Implementation of Active PE would include a two-day training workshop for PE teachers, providing the necessary curriculum and equipment materials for schools, and include state-level coordination.6,7

Comparing Costs and Outcomes

A CHOICES cost-effectiveness analysis compared the costs and outcomes over 10 years (2020-2030) of implementing Active PE with the costs and outcomes associated with not implementing the strategy.

Implementing Active PE in Iowa is an investment in the future. By the end of 2030:
If Active PE was implemented in Iowa, then by the end of 2030, 495,000 children would be reach over 10 years. It would cost $8 per child to implement Active PE. Each child would get 7 more active minutes per week.

Conclusions and Implications

Implementation of Active PE strategies is projected to increase physical activity and improve the health of 495,000 elementary and middle school students in Iowa over 10 years. On average, each student would participate in seven more minutes of moderate-to-vigorous physical activity during each school week. We also estimate there will be 137 fewer cases of obesity in Iowa in 2030 alone just by implementing these strategies to increase the active time during existing physical education classes.

This strategy also provides professional development opportunities for 912 teachers annually at 1,033 schools, enabling them to learn new instructional strategies to foster a fun and enjoyable environment where children can gain standards-based skills that support lifelong physical activity.4 Implementing the Active PE best practice guideline would ensure that most students in Iowa could benefit from high-quality PE time without requiring changes to staffing or school schedules. This could be incorporated into a comprehensive plan to help support healthy growth and development at an average cost of under $8 per student per year.

Strategies to ensure that students have access to high-quality physical education classes where more time is spent in active movement can help children get more physical activity.2 In addition to promoting a healthy weight, physical activity benefits students in other ways. Regular physical activity builds strong bones and muscles, reduces symptoms of anxiety and depression, and improves cognition.2 Additionally, evidence shows that when children are physically active, they tend to perform better in the classroom, have higher school attendance, and have fewer disciplinary problems.8 These other benefits are not quantified in this analysis but are key for children’s education and well-being.

References

  1. Child and Adolescent Health Measurement Initiative. 2018-2019 National Survey of Children’s Health (NSCH) data query. https://www.nschdata.org/browse/survey/results?q=7700&r=17. Accessed October 29, 2020.

  2. 2018 Physical Activity Guidelines Advisory Committee. 2018 Physical Activity Guidelines Advisory Committee Scientific Report. Washington, DC: U.S. Department of Health and Human Services, 2018.

  3. Institute of Medicine. Educating the Student Body: Taking Physical Activity and Physical Education to School. Washington, DC: National Academies Press, 2013.

  4. Lonsdale C, Rosenkranz RR, Peralta LR, Bennie A, Fahey P, Lubans DR. A systematic review and meta-analysis of interventions designed to increase moderate-to-vigorous physical activity in school physical education lessons. Preventive Medicine. 2013;56(2):152-161.

  5. Iowa Department of Public Health. Play Your Way. https://idph.iowa.gov/inn/play-your-way. Accessed November 30, 2020.

  6. Barrett JL, Gortmaker SL, Long MW, et al. Cost Effectiveness of an Elementary School Active Physical Education Policy. American Journal of Preventive Medicine. 2015;49(1);148-159.

  7. Cradock AL, Barrett JL, Kenney EL, et al. Using cost-effectiveness analysis to prioritize policy and programmatic approaches to physical activity promotion and obesity prevention in childhood. Preventive Medicine. 2017; 95;S17-S27.

  8. Centers for Disease Control and Prevention, Division of Population Health, National Center for Chronic Disease Prevention and Health Promotion. Physical Education. April 21, 2020. https://www.cdc.gov/healthyschools/physicalactivity/physical-education.htm. Accessed December 15, 2020.

Suggested Citation:

Hopkins H, Lange J, Olson E, Taylor-Watts S, Jenkins L, McCulloch S, Barrett J, Reiner J, and Cradock AL. Iowa: Active Physical Education (PE) {Issue Brief}. Iowa Department of Public Health, Iowa Department of Education, Des Moines, IA, and the CHOICES Learning Collaborative Partnership at the Harvard T.H. Chan School of Public Health, Boston, MA; April 2021. For more information, please visit www.choicesproject.org

The design for this brief and its graphics were developed by Molly Garrone, MA and partners at Burness.

This issue brief was developed at the Harvard T.H. Chan School of Public Health in collaboration with the Iowa Department of Public Health through participation in the Childhood Obesity Intervention Cost-Effectiveness Study (CHOICES) Learning Collaborative Partnership. This brief is intended for educational use only. This work is supported by The JPB Foundation and the Centers for Disease Control and Prevention (U48DP006376). The findings and conclusions are those of the author(s) and do not necessarily represent the official position of the Centers for Disease Control and Prevention or other funders.

← Back to Resources

Brief: Active Physical Education (PE) in Allegheny County, Pennsylvania

The information in this brief is intended only to provide educational information.

This brief summarizes findings from the CHOICES Learning Collaborative Partnership simulation model of implementing an Active Physical Education (PE) program in school districts participating in the Live Well Allegheny initiative in Allegheny County, Pennsylvania. Live Well Allegheny Schools will commit that 50% of PE class time be dedicated to moderate-to-vigorous physical activity (MVPA).

The Issue

One objective of the Allegheny County Health Department (ACHD) Community Health Improvement Plan is to decrease obesity in school-age children. Research shows that physical activity helps kids grow up at a healthy weight and reduces the risk of future chronic disease.1 However, many kids do not get enough daily physical activity,2 and without action, a majority of today’s children will have obesity at age 35.3 This has substantial financial implications. The health care costs for treating obesity-related health conditions like heart disease and diabetes were $147 billion in 2008.4

PE programs in schools can help students get the recommended amount of physical activity per day.1 However, research shows that children often spend less than half of PE class being physically active.5 Improving the quality of PE classes in ways that ensure that children are more active during class time will not only help children get more physical activity, but can also encourage children to develop habits to ensure an active and healthy lifestyle.1 The purpose of this study is to estimate the cost-effectiveness of implementing Active PE, which requires that at least 50% of PE class time be spent in MVPA.

About Active PE

The ACHD envisions that Active PE could be implemented in school districts that have partnered with Live Well Allegheny, a county-wide campaign to improve the health and wellness of Allegheny County residents. Implementation of Active PE would include dissemination of the evidence-based program SPARK PE to eligible elementary and middle schools. SPARK is a well-evaluated and widely used curriculum and training program that has been found to increase MVPA time in PE class.6

SPARK trainers would lead two-day workshops to train PE teachers on how to use and implement the SPARK PE curriculum. Participating schools would receive SPARK curricula, instructional materials, and equipment. Implementation would include a county-level PE Educational Specialist to provide oversight and monitoring of policy implementation, as well as ongoing training and support for teachers and schools each year.

Comparing Costs and Outcomes

CHOICES cost-effectiveness analysis compared the costs and outcomes of the implementation of the Active PE program in designated Live Well Allegheny school districts over a 10-year time horizon with the costs and outcomes of not implementing the intervention. We assumed that all elementary and middle schools serving grades K-8 that are part of the 18 designated Live Well Allegheny school districts would receive training from SPARK. The model assumes that 70% of the PE teachers trained would implement Active PE program in their schools.7,8

Implementing Active PE is an investment in the future. By the end of 2027:
An infographic about the results of active PE implimentation.

Conclusions and Implications

The implementation of Active PE using the evidence-based program SPARK within Live Well Allegheny Schools is projected to improve the health of many children in Allegheny County. The intervention would help ensure that 62,100 children attend schools with more active PE classes and would cost $2.29 million dollars to implement over 10 years, at an average of $37 per child. In schools that implement the Active PE program, on average we estimate that students would get 7 additional minutes of MVPA per school week, which is a 3% increase in MVPA. We estimate there will be 13 fewer cases of childhood obesity in the final year of the model as a result of implementation of Active PE.

SPARK training offers a professional development opportunity for teachers to improve instructional strategies to foster a fun and enjoyable environment where children can gain lifelong skills to engage in physical activity.10 There are also other likely positive benefits from physical activity related to improved bone health, aerobic and muscular fitness, cognition, and academic performance1 that are not quantified in this analysis but are important outcomes for children’s education and well-being.

Active PE is one evidence-based strategy that can benefit the majority of students in a school where most children attend PE classes and can be incorporated into a comprehensive plan to address childhood obesity. Leaders should use the best available evidence to select strategies to help children be more active.

References

  1. 2018 Physical Activity Guidelines Advisory Committee. 2018 Physical Activity Guidelines Advisory Committee Scientific Report. Washington, DC: U.S. Department of Health and Human Services, 2018. Accessed September 7, 2018.
  2. Child and Adolescent Health Measurement Initiative. 2016-2017 National Survey of Children’s Health (NSCH) data query. Data Resource Center for Child and Adolescent Health supported by Cooperative Agreement U59MC27866 from the U.S. Department of Health and Human Services, Health Resources and Services Administration’s Maternal and Child Health Bureau (HRSA MCHB). Retrieved [02/08/2019] from www. childhealthdata.org. CAHMI: www.cahmi.org.
  3. Ward Z, Long M, Resch S, Giles C, Cradock A, Gortmaker S. Simulation of Growth Trajectories of Childhood Obesity into Adulthood. New England Journal of Medicine. 2017; 377(22): 2145-2153.
  4. Finkelstein EA, Trogdon JG, Cohen JW, Dietz W. Annual Medical Spending Attributable To Obesity: Payer-And Service-Specific Estimates. Health Affairs. 2009;28(5).
  5. Institute of Medicine. Educating the Student Body: Taking Physical Activity and Physical Education to School. Washington, DC: National Academies Press; 2013.
    Sallis, J. F., McKenzie, T. L., Alcaraz, J. E., Kolody, B., Faucette, N., & Hovell, M. F. (1997). The effects of a 2-year physical education program (SPARK) on physical activity and fitness in elementary school students. Sports, Play and Active Recreation for Kids. American Journal of Public Health, 87(8), 1328-1334.
  6. Hoelscher DM, Feldman HA, Johnson CC, et al. School-based health education programs can be maintained overtime: results from the CATCH Institutionalization study. Prev Med. May 2004;38(5):594-606.
  7. McKenzie TL, Li D, Derby CA, Webber LS, Luepker RV, Cribb P. Maintenance of effects of the CATCH physical education program: results from the CATCH-ON study. Health Education Behavior. Aug 2003;30(4):447-462.
  8. Cradock, A. L., Barrett, J. L., Kenney, E. L., Giles, C. M., Ward, Z. J., Long, M. W., … & Gortmaker, S. L. Using cost-effectiveness analysis to prioritize policy and programmatic approaches to physical activity promotion and obesity prevention in childhood. Preventive Medicine. 2017; 95, S17-S27.
  9. Society of Health and Physical Educators (SHAPE). Physical Education Guidelines. Retrieved from: https://www.shapeamerica.org/standards/guidelines/peguidelines.aspx Accessed 13 April 2018.
  10. McKenzie, T. L., Sallis, J. F., & Rosengard, P. (2009). Beyond the stucco tower: Design, development, and dissemination of the SPARK physical education programs. Quest, 61(1), 114-127.
Suggested Citation:

Pagnotta M, Hardy H, Reiner J, Barrett J, Cradock A. Allegheny County Active Physical Education (PE) [Issue Brief]. Allegheny County Health Department, Pittsburgh, PA, and the CHOICES Learning Collaborative Partnership at the Harvard T.H. Chan School of Public Health, Boston, MA; December, 2019.

This issue brief was developed at the Harvard T.H. Chan School of Public Health in collaboration with the Allegheny County Health Department (ACHD) through participation in the Childhood Obesity Intervention Cost-Effectiveness Study (CHOICES) Learning Collaborative Partnership. This brief is intended for educational use only.

← Back to Resources

Brief: Safe Routes to School (SRTS) in Houston, Texas

Kids crossing street with crossing guard

The information in this brief is intended only to provide educational information.

This brief summarizes findings from the CHOICES Learning Collaborative Partnership simulation model of implementing Safe Routes to School (SRTS) initiatives in elementary and middle schools in Houston Independent School District. SRTS aims to help children safely walk and bicycle to school through infrastructure improvements, education, and promotional activities.

The Issue

Research shows that physical activity helps kids grow up at a healthy weight and reduces the risk of future chronic disease;1 however, many kids do not get enough daily physical activity,2 and without action, a majority of today’s children will have obesity at age 35.3 This has substantial financial implications. The healthcare costs for treating obesity-related health conditions like heart disease and diabetes were $147 billion in 2008.4

Every child deserves the opportunity to be healthy, and all kids need opportunities to be physically active, no matter where they live or where they go to school. Over recent decades, the declining rates of using physically active transportation modes like walking and bicycling to school may have contributed to lower than recommended levels of physical activity among youth.5 In Houston, concerns over pedestrian and bicycle safety may deter parents from allowing their child walk or bike to school. SRTS initiatives are an effective strategy to increase physical activity by promoting safer walking and bicycling opportunities6 and would be an important component of the City’s effort to create safe, efficient and effective alternatives to traveling by car.

About Safe Routes to School

Houston envisions implementing SRTS as part of Houston’s Vision Zero initiative, a comprehensive approach to address traffic safety to eliminate all traffic fatalities and serious injuries. Vision Zero can support SRTS initiatives to improve street safety and encourage more kids and families to walk and bike to and from school.

We estimated the cost to implement SRTS initiatives in Houston, including transportation infrastructure projects to improve the local physical environments around schools and education, encouragement and enforcement activities. Other necessary resources include a program coordinator and a Committee Taskforce to provide city-level oversight, administration, and project selection support.

Comparing Costs and Outcomes

CHOICES cost-effectiveness analysis compared the costs and outcomes over a 10-year time horizon (2017-2027) of implementing SRTS in Houston with the costs and outcomes associated with not implementing the program. We estimated that 199 elementary and middle schools serving grades K-8 in Houston Independent School District would implement a new SRTS program. Additional research suggests that 5.5% of students would shift from cars to active travel modes after SRTS implementation.6 This shift would result in some projected cost savings due to reduced vehicle use for school transportation trips.

Implementing Safe Routes to School in Houston is an investment in the future. By the end of 2027:
An infographic about implementing safe school routes. The graphic indicates 15,500 children would walk or bike to school.

Conclusions and Implications

Investing in initiatives that make it safer and more appealing to walk or bicycle to and from school can help more children accumulate recommended levels of physical activity. We estimate that over ten years, over 276,000 students in the Houston Independent School District would benefit from improved safety around schools and those that start walking or biking to school would engage in 48 more minutes of physical activity during the school week.

Implementing SRTS in Houston Independent School District would require an investment of $19.5 million dollars over 10 years. When accounting for cost offsets due to reduced vehicle traffic for students who shift travel modes, the projected 10-year implementation costs are estimated to be cost-saving. In Houston, SRTS project implementation costs could be offset by savings associated with reduced vehicle travel that include $4 million in environment-related cost savings. Additionally, families whose students start walking or bicycling and thus drive less for school transportation trips could average $1,080 in savings.

SRTS initiatives, which include a combination of infrastructure improvements (e.g., adding sidewalks or traffic calming) and non-infrastructure activities (e.g., safety education, promotional events, enforcement and evaluation activities) may also reduce the risk of pedestrian and bicycle injury.7,8 Investing in SRTS projects that make walking and bicycling to school safer and easier opens opportunities for those families who want to allow their child to walk or bike but cannot because of safety concerns.9

These multiple benefits reinforce the importance of investing in effective strategies that promote accessible, safe, and convenient walking and biking options to improve the health of our students and the environments of our local communities.

References

  1. 2018 Physical Activity Guidelines Advisory Committee. 2018 Physical Activity Guidelines Advisory Committee Scientific Report. Washington, DC: U.S. Department of Health and Human Services, 2018. Accessed September 7, 2018.2.
  2. Child and Adolescent Health Measurement Initiative. 2016-2017 National Survey of Children’s Health (NSCH) data query. Data Resource Center for Child and Adolescent Health supported by Cooperative Agreement U59MC27866 from the U.S. Department of Health and Human Services, Health Resources and Services Administration’s Maternal and Child Health Bureau (HRSA MCHB). Retrieved [02/08/2019] from www.childhealthdata.org. CAHMI: www.cahmi.org.
  3. Ward Z, Long M, Resch S, Giles C, Cradock A, Gortmaker S. Simulation of Growth Trajectories of Childhood Obesity into Adulthood. N Engl J Med. 2017; 377(22): 2145-2153.
  4. Finkelstein EA, Trogdon JG, Cohen JW, Dietz W. Annual Medical Spending Attributable To Obesity: Payer-And Service-Specific Estimates. Health Affairs. 2009;28(5).
  5. McDonald, NC. Active transportation to school: trends among US schoolchildren, 1969–2001. American Journal of Preventive Medicine. 2007; 32(6), 509-516
  6. McDonald C, Steiner RL, Lee C, Smith TR, Zhu X, & Yang Y. Impact of the Safe Routes to School Program on Walking and Bicycling, Journal of the American Planning Association. 2014; 80:2, 153-167
  7. DiMaggio, C, & Li, G. Effectiveness of a safe routes to school program in preventing school-aged pedestrian injury. Pediatrics. 2013; 131(2), 290-296.
  8. DiMaggio C, Chen Q, Muennig PA, Li G. Timing and effect of a safe routes to school program on child pedestrian injury risk during school travel hours: Bayesian changepoint and difference-in-difference analysis. Injury Epidemiology 2014; 1:17
  9. McDonald, NC & Aalborg, AE. Why Parents Drive Children to School: Implications for Safe Routes to School Programs, Journal of the American Planning Association. 2009; 75:3, 331-342, DOI: 10.1080/01944360902988794
Suggested Citation:

Reiner J, Barrett J, Giles C, Cradock A. Houston Safe Routes to School [Issue Brief]. Houston Health Department, Houston, TX and the CHOICES Learning Collaborative Partnership at the Harvard T.H. Chan School of Public Health, Boston, MA; December 2019.

This issue brief was developed at the Harvard T.H. Chan School of Public Health in collaboration with the Houston Health Department and the Houston Planning and Development Department through participation in the Childhood Obesity Intervention Cost-Effectiveness Study (CHOICES) Learning Collaborative Partnership. This brief is intended for educational use only.

← Back to Resources