Topic: Methods & Modeling

State-Level Estimates of Childhood Obesity Prevalence in the United States Corrected for Report Bias

Long MW, Ward ZJ, Resch SC, Cradock AL, Wang YC, Giles CM, Gortmaker SL. State-level estimates of childhood obesity prevalence in the United States corrected for report bias. Int J Obes (Lond). Epub 2016 Jul 27.

Abstract

Background/objectives

State-specific obesity prevalence data are critical to public health efforts to address the childhood obesity epidemic. However, few states administer objectively measured body mass index (BMI) surveillance programs. This study reports state-specific childhood obesity prevalence by age and sex correcting for parent-reported child height and weight bias.

Subjects/methods

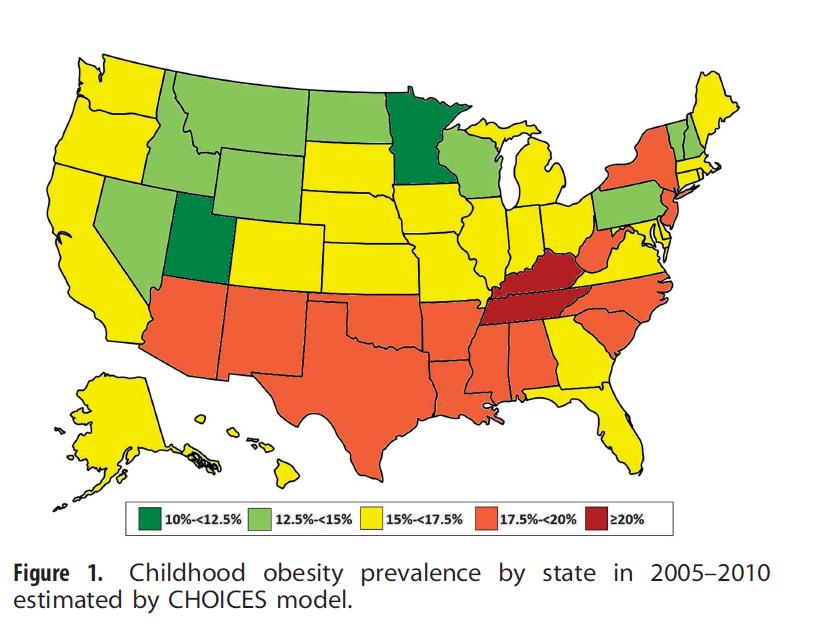
As part of the Childhood Obesity Intervention Cost Effectiveness Study (CHOICES), we developed childhood obesity prevalence estimates for states for the period 2005-2010 using data from the 2010 US Census and American Community Survey (ACS), 2003-2004 and 2007-2008 National Survey of Children’s Health (NSCH) (n=133 213), and 2005-2010 National Health and Nutrition Examination Surveys (NHANES) (n=9377; ages 2-17). Measured height and weight data from NHANES were used to correct parent-report bias in NSCH using a non-parametric statistical matching algorithm. Model estimates were validated against surveillance data from five states (AR, FL, MA, PA and TN) that conduct censuses of children across a range of grades.

Results

Parent-reported height and weight resulted in the largest overestimation of childhood obesity in males ages 2-5 years (NSCH: 42.36% vs NHANES: 11.44%). The CHOICES model estimates for this group (12.81%) and for all age and sex categories were not statistically different from NHANES. Our modeled obesity prevalence aligned closely with measured data from five validation states, with a 0.64 percentage point mean difference (range: 0.23-1.39) and a high correlation coefficient (r=0.96, P=0.009). Estimated state-specific childhood obesity prevalence ranged from 11.0 to 20.4%.

Conclusion

Uncorrected estimates of childhood obesity prevalence from NSCH vary widely from measured national data, from a 278% overestimate among males aged 2-5 years to a 44% underestimate among females aged 14-17 years. This study demonstrates the validity of the CHOICES matching methods to correct the bias of parent-reported BMI data and highlights the need for public release of more recent data from the 2011 to 2012 NSCH.

← Back to Resources


U.S. States’ Childhood Obesity Surveillance Practices and Recommendations for Improving Them, 2014–2015

Blondin KJ, Giles CM, Cradock AL, Gortmaker SL, Long MW. US States’ Childhood Obesity Surveillance Practices and Recommendations for Improving Them, 2014–2015. Prev Chronic Dis. 2016;13:160060.

Abstract

Introduction

Routine collection, analysis, and reporting of data on child height, weight, and body mass index (BMI), particularly at the state and local levels, are needed to monitor the childhood obesity epidemic, plan intervention strategies, and evaluate the impact of interventions. Child BMI surveillance systems operated by the US government do not provide state or local data on children across a range of ages. The objective of this study was to describe the extent to which state governments conduct child BMI surveillance.

Methods

From August through December 2014, we conducted a structured telephone survey with state government administrators to learn about state surveillance of child BMI. We also searched websites of state health and education agencies for information about state surveillance.

Results

State agency administrators in 48 states and Washington, DC, completed telephone interviews (96% response rate). Based on our interviews and Internet research, we determined that 14 states collect child BMI data in a manner consistent with standard definitions of public health surveillance.

Conclusion

The absence of child BMI surveillance systems in most states limits the ability of public health practitioners and policymakers to develop and evaluate responses to the childhood obesity epidemic. Greater investment in surveillance is needed to identify the most effective and cost-effective childhood obesity interventions.

← Back to Resources

New Strategies to Prioritize Nutrition, Physical Activity, and Obesity Interventions

Dietz WH, Gortmaker SL. New Strategies to Prioritize Nutrition, Physical Activity, and Obesity Interventions. Am J Prev Med. 2016 Apr 26. pii: S0749-3797(16)30069-1.

Abstract

Interventions for obesity have not often been based on considerations that could predict their effectiveness. However, advances in research provide several new approaches that can inform priorities for public health interventions directed at nutrition, physical activity, and obesity. These approaches include estimation of the effect size, comparison of the calorie gap with the caloric deficit induced by the intervention, population reach and impact, cost and cost effectiveness of the intervention, time required to evaluate the effect of the intervention on weight change, and feasibility of the intervention. Incorporation of these considerations by policymakers and public health practitioners will help identify those interventions most likely to achieve changes in the prevalence of obesity.

Redrawing the US Obesity Landscape: Bias-Corrected Estimates of State-Specific Adult Obesity Prevalence

A CHOICES paper reveals that adult obesity rates in the United States are higher than previously reported by the CDC.

Ward ZJ, Long MW, Resch SC, Gortmaker SL, Cradock AL, Giles C, Hsiao A, Wang YC. Redrawing the US Obesity Landscape: Bias-Corrected Estimates of State-Specific Adult Obesity Prevalence. PLoS ONE. 2016 Mar 8;11(3):e0150735.

Fig 1. described in the article

[Fig 1.] Prevalence of adult obesity (BMI ≥ 30) by state in 2013: Uncorrected vs. Corrected.


Adult overweight and obesity are among the leading causes of morbidity and mortality in the United States—a problem depicted in the Centers for Disease Control and Prevention’s (CDC) well-known obesity maps. However these figures—which have galvanized state leaders to take action, and have been used to prioritize federal obesity prevention resources—may substantially underestimate the true state-level burden. The data behind these maps rely on self-reported height and weight collected through telephone surveys, yet bias in self-reported measures is well documented and results in underestimates of body mass index (BMI). The CHOICES Project, which created a novel method to correct for this bias, found that as many as 12 million adults with obesity (including 6.7 million with severe obesity) were misclassified by CDC state-level estimates.

“Accurate estimates of state-level obesity are necessary to plan for resources to address this epidemic,” said Zachary Ward, lead author and programmer/analyst in the Center for Health Decision Science at the Harvard T.H. Chan School of Public Health. “Our corrected state-level estimates provide decision makers with a more solid foundation of data on which to base obesity prevention policies.”

Fig 2. described in the article

[Fig 2.] Prevalence of adult severe obesity (BMI ≥ 35) by state in 2013: Uncorrected vs. Corrected.

A closer look at specific states reveals some striking findings. In the adjusted data [Fig. 1], obesity prevalence was below 30 percent in only four states (California, Colorado, Hawaii, and Massachusetts), whereas the CDC maps show most states below this level. Another key finding is that in four states (Arkansas, Mississippi, Tennessee, and West Virginia), the estimated obesity prevalence was over 40 percent—a category not included in any previous CDC data. Also not seen in the existing maps is the prevalence of severe obesity greater than 17.5 percent, now apparent in Alabama, Mississippi, and West Virginia [Fig. 2].

Further, the economic implications of under-counting millions of cases of obesity are large. Assuming incremental obesity-related healthcare costs of $1,000 per individual, under-counting the total 12 million cases of obesity would result in underestimating obesity-related healthcare costs by $12 billion.

These revised maps highlight the need for improved resources to both track and prevent obesity. It is important to note that the Behavioral Risk Factor Surveillance System, on which the CDC maps are based, is the only national BMI surveillance strategy currently in place for gathering state-specific information. These data are crucial, and are what allowed for the adjustments used in this study. Accurate state-specific obesity estimates are necessary to help officials plan appropriately for the medical capacity and economic resources needed to address this epidemic, and institute preventive measures where they are needed most.

← Back to Resources

Severe Obesity In Adults Cost State Medicaid Programs Nearly $8 Billion In 2013

Wang YC, Pamplin J, Long MW, Ward ZJ, Gortmaker SL, Andreyeva T. Severe Obesity In Adults Cost State Medicaid Programs Nearly $8 Billion In 2013. Health Aff, 34, no. 11 (2015):1923-31.

Abstract

Efforts to expand Medicaid while controlling spending must be informed by a deeper understanding of the extent to which the high medical costs associated with severe obesity (having a body mass index of [Formula: see text] or higher) determine spending at the state level. Our analysis of population-representative data indicates that in 2013, severe obesity cost the nation approximately $69 billion, which accounted for 60 percent of total obesity-related costs. Approximately 11 percent of the cost of severe obesity was paid for by Medicaid, 30 percent by Medicare and other federal health programs, 27 percent by private health plans, and 30 percent out of pocket. Overall, severe obesity cost state Medicaid programs almost $8 billion a year, ranging from $5 million in Wyoming to $1.3 billion in California. These costs are likely to increase following Medicaid expansion and enhanced coverage of weight loss therapies in the form of nutrition consultation, drug therapy, and bariatric surgery. Ensuring and expanding Medicaid-eligible populations’ access to cost-effective treatment for severe obesity should be part of each state’s strategy to mitigate rising obesity-related health care costs.

Keywords: Epidemiology; Health Promotion/Disease Prevention; Medicaid; Public Health.

← Back to Resources


Cost-Effectiveness of Childhood Obesity Interventions: Evidence and Methods for CHOICES

A published CHOICES overview paper discusses the rigorous methods behind four preventive childhood obesity strategies that were found to be more cost-effective than existing clinical interventions to treat obesity.

Gortmaker SL, Long MW, Resch SC, Ward ZJ, Cradock AL, Barrett JL, Wright DR, Sonneville KR, Giles CM, Carter RC, Moodie ML, Sacks G, Swinburn BA, Hsiao A, Vine S, Barendregt J, Vos T, Wang YC. Cost Effectiveness of Childhood Obesity Interventions: Evidence and Methods for CHOICES. Am J Prev Med. 2015 Jul;49(1):102-11. doi: 10.1016/j.amepre.2015.03.032.

As the childhood obesity epidemic continues in the U.S., fiscal crises are leading policymakers to ask not only whether an intervention works, but also whether it offers good value for money spent. However, cost-effectiveness analyses have been limited, and currently practiced strategies such as individual clinical interventions are often an expensive burden on the healthcare system.

“Reversing the obesity epidemic will require a broad range of intervention strategies, and identifying the best strategies necessitates analysis of the costs, impact, healthcare cost savings, and broader context of each strategy,” says lead investigator of the CHOICES Project, Dr. Steve Gortmaker, who also serves as the Director of the Harvard Prevention Research Center and a Professor of the Practice of Health Sociology at the Harvard T.H. Chan School of Public Health. “The consideration of all these key metrics is crucial, yet currently absent from our national conversation on obesity prevention and control.”

The four papers, published by the American Journal of Preventive Medicine, are the first to evaluate the cost-effectiveness of these four strategies implemented nationally:

  • a sugar-sweetened beverage (SSB) excise tax
  • eliminating the tax subsidy of TV advertising unhealthy food to children (TV AD)
  • early care and education policy changes targeting unhealthy beverages, physical activity, and screen time (ECE)
  • policy changes and teacher training to increase physical activity during existing PE classes (ACTIVE PE)

CHOICES researchers selected these initial interventions as they represent a broad range of nationally scalable strategies to reduce childhood obesity, using a mix of both policy and program-based changes. The interventions were modeled for nationwide implementation using a simulation of the 2015 U.S. population over ten years. Population reach varied widely, and cost per BMI change ranged from $1.16 (TV AD) to $401 (Active PE). At the 10-year mark in 2025, three interventions would save net costs, with SSB and TV AD saving $55 and $38 for every dollar spent. The SSB intervention would avert disability-adjusted life years, and both SSB and TV AD would increase quality-adjusted life years. Both SSB ($12.5 billion) and TV AD ($80 million) would produce yearly tax revenue.

The overview also discusses various limitations in current research and results, including the lack of established benchmarks for the metric of cost per unit changes in BMI. However for comparison, the paper cites the costs of existing clinical interventions for obese children or adolescents. When primary care-based interventions can total about $1,000 per BMI unit change, and bariatric surgery is roughly estimated at $2,100 per BMI unit change, the results from the four CHOICES broad-reaching policy and preventive interventions may produce changes in BMI at much lower cost than these commonly reimbursed medical treatments.

Though the critical question remains of whether these cost-effective interventions can actually be implemented over the modeled length of time (and whether implementation is at the local, state, or national level), this analysis is an important step in providing policymakers with the right tools to focus on strategies that can demonstrate best value for money.

← Back to Resources

Modeling the Cost-Effectiveness of Child Care Policy Changes in the U.S. 

CHOICES researchers found that implementing a multi-component regulatory policy in US childcare facilities would lead children to watch less TV, get more physical activity, and consume fewer sugary drinks, serving as a cost-effective strategy in reducing the childhood obesity epidemic.

Wright DR, Kenney EL, Giles CM, Long MW, Ward ZJ, Resch SC, Moodie ML, Carter RC, Wang YC, Sacks G, Swinburn BA, Gortmaker SL, Cradock AL. Modeling the Cost Effectiveness of Child Care Policy Changes in the U.S. Am J Prev Med. 2015 Jul;49(1):135-47. doi: 10.1016/j.amepre.2015.03.016.

Risk factors for obesity, including dietary habits, physical activity, and screen time behaviors develop in early childhood, persisting into late childhood and even into adulthood. Long-term habits are hard to change during adulthood, highlighting the importance of early intervention for obesity prevention. With nearly 70 percent of American preschool-aged children in out-of-home child care facilities, the setting serves as an ideal intervention target.

Children playing in daycare“Full day childcare programs are an educational environment responsible for providing children with snacks, meals, and daily opportunities for physical activity,” says lead author, Davene Wright, PhD, an Assistant Professor in the Department of Pediatrics at the University of Washington School of Medicine. “Many childcare programs fail to meet best practice standards for nutrition, physical activity, and screen time viewing. When 20 percent of preschool-aged children in the US are currently overweight or obese, this sector should be a key target for policy regulations to aid in the development of lifelong healthy behaviors.”

The study developed a hypothetical state-level regulatory policy intervention with three components:

  • The beverage component stipulated that water be made freely available throughout the program day, that sugar-sweetened beverages (SSBs) be replaced with water, that 100% juice be limited to 6 ounces per child per day, and that whole milk be replaced with reduced-fat milk.
  • The physical activity component required programs to provide opportunities for at least 90 minutes of moderate and vigorous physical activity (MVPA) over the course of the program day for children in full-time care.
  • The screen time component specified that television and computer time be educational in nature and limited to 30 minutes per week.

By using a simulation model, researchers found that these regulatory changes would reach 3.8 million US preschool-aged children, resulting in 21 hours of less screen time, 5 hours more of MVPA, 588 fewer ounces of whole milk, and 40 fewer ounces of SSBs annually per child. Implementation would cost $7.4 million annually, and result in 0.02 fewer BMI units per child at a cost of $58 per BMI unit avoided. Over a 10-year period, these effects would result in net healthcare cost savings of $372 million.

This is the first study to examine the potential economic impact of a multi-component child care-based obesity policy intervention. These regulations could have a small but meaningful impact on short-term BMI at a low cost, with promising potential to be cost-saving within only 10 years. This analysis provides important new information to policymakers regarding the benefits to the health of our nation’s children, and the substantial savings to healthcare expenditures that could be achieved.

← Back to Resources

The Cost of a Primary Case-Based Childhood Obesity Prevention Intervention

Wright DR, Taveras EM, Gillman MW, Horan CM, Hohman KH, Gortmaker SL, Prosser LA. The cost of a primary care-based childhood obesity prevention intervention. BMC Health Serv Res. 2014 Jan 29;14:44. doi: 10.1186/1472-6963-14-44.

Abstract

Background

United States pediatric guidelines recommend that childhood obesity counseling be conducted in the primary care setting. Primary care-based interventions can be effective in improving health behaviors, but also costly. The purpose of this study was to evaluate the cost of a primary care-based obesity prevention intervention targeting children between the ages of two and six years who are at elevated risk for obesity, measured against usual care.

Methods

High Five for Kids was a cluster-randomized controlled clinical trial that aimed to modify children’s nutrition and TV viewing habits through a motivational interviewing intervention. We assessed visit-related costs from a societal perspective, including provider-incurred direct medical costs, provider-incurred equipment costs, parent time costs and parent out-of-pocket costs, in 2011 dollars for the intervention (n = 253) and usual care (n =192) groups. We conducted a net cost analysis using both societal and health plan costing perspectives and conducted one-way sensitivity and uncertainty analyses on results.

Results

The total costs for the intervention group and usual care groups in the first year of the intervention were $65,643 (95% CI [$64,522, $66,842]) and $12,192 (95% CI [$11,393, $13,174]). The mean costs for the intervention and usual care groups were $259 (95% CI [$255, $264]) and $63 (95% CI [$59, $69]) per child, respectively, for a incremental difference of $196 (95% CI [$191, $202]) per child. Children in the intervention group attended a mean of 2.4 of a possible 4 in-person visits and received 0.45 of a possible 2 counseling phone calls. Provider-incurred costs were the primary driver of cost estimates in sensitivity analyses.

Conclusions

High Five for Kids was a resource-intensive intervention. Further studies are needed to assess the cost-effectiveness of the intervention relative to other pediatric obesity interventions.

Trial registration: ClinicalTrials.gov NCT00377767.

← Back to Resources

Reaching the Healthy People Goals for Reducing Childhood Obesity: Closing the Energy Gap

Wang YC, Orleans CT, Gortmaker SL. Reaching the healthy people goals for reducing childhood obesity: Closing the energy gap. Am J Prev Med. 2012 May;42(5):437-44. doi: 10.1016/j.amepre.2012.01.018.

Abstract

Background

The federal government has set measurable goals for reducing childhood obesity to 5% by 2010 (Healthy People 2010), and 10% lower than 2005-2008 levels by 2020 (Healthy People 2020). However, population-level estimates of the changes in daily energy balance needed to reach these goals are lacking.

Purpose

To estimate needed per capita reductions in youths’ daily “energy gap” (calories consumed over calories expended) to achieve Healthy People goals by 2020.

Methods

Analyses were conducted in 2010 to fit multivariate models using National Health and Nutrition Examination Surveys 1971-2008 (N=46,164) to extrapolate past trends in obesity prevalence, weight, and BMI among youth aged 2-19 years. Differences in average daily energy requirements between the extrapolated 2020 levels and Healthy People scenarios were estimated.

Results

During 1971-2008, mean BMI and weight among U.S. youth increased by 0.55 kg/m(2) and by 1.54 kg per decade, respectively. Extrapolating from these trends to 2020, the average weight among youth in 2020 would increase by ∼1.8 kg from 2007-2008 levels. Averting this increase will require an average reduction of 41 kcal/day in youth’s daily energy gap. An additional reduction of 120 kcal/day and 23 kcal/day would be needed to reach Healthy People 2010 and Healthy People 2020 goals, respectively. Larger reductions are needed among adolescents and racial/ethnic minority youth.

Conclusions

Aggressive efforts are needed to reverse the positive energy imbalance underlying the childhood obesity epidemic. The energy-gap metric provides a useful tool for goal setting, intervention planning, and charting progress.

← Back to Resources

Changing the Future of Obesity: Science, Policy, and Action

Gortmaker SL, Swinburn BA, Levy D, Carter R, Mabry PL, Finegood DT, Huang T, Marsh T, Moodie ML. Changing the future of obesity: Science, policy, and action. Lancet. 2011 Aug 27;378(9793):838-47. doi: 10.1016/S0140-6736(11)60815-5.

Abstract

The global obesity epidemic has been escalating for four decades, yet sustained prevention efforts have barely begun. An emerging science that uses quantitative models has provided key insights into the dynamics of this epidemic, and enabled researchers to combine evidence and to calculate the effect of behaviours, interventions, and policies at several levels–from individual to population. Forecasts suggest that high rates of obesity will affect future population health and economics. Energy gap models have quantified the association of changes in energy intake and expenditure with weight change, and have documented the effect of higher intake on obesity prevalence. Empirical evidence that shows interventions are effective is limited but expanding. We identify several cost-effective policies that governments should prioritise for implementation. Systems science provides a framework for organising the complexity of forces driving the obesity epidemic and has important implications for policy makers. Many parties (such as governments, international organisations, the private sector, and civil society) need to contribute complementary actions in a coordinated approach. Priority actions include policies to improve the food and built environments, cross-cutting actions (such as leadership, healthy public policies, and monitoring), and much greater funding for prevention programmes. Increased investment in population obesity monitoring would improve the accuracy of forecasts and evaluations. The integration of actions within existing systems into both health and non-health sectors (trade, agriculture, transport, urban planning, and development) can greatly increase the influence and sustainability of policies. We call for a sustained worldwide effort to monitor, prevent, and control obesity.

← Back to Resources