Topic: Drinking Water

Brief: Water Dispensers in Massachusetts Schools

Water fountain and filling station on a wall in a school

The information in this brief is intended only to provide educational information.

This brief summarizes a CHOICES Learning Collaborative Partnership model examining a strategy to improve access to drinking water in schools in Massachusetts. This strategy involves the installation of touchless chilled water dispensers on or near school cafeteria lunch lines in K-8 public schools with adequate plumbing.

The Issue

All students should have access to safe, clean, and appealing drinking water, no matter where they go to school. Yet, nearly half of K-8 public schools in Massachusetts have identified elevated concentrations of lead in their drinking water and need to improve their drinking water infrastructure.1

Providing access to appealing drinking water gives students a healthier alternative to sugary drinks, like sweetened fruit drinks, sports drinks, and soda. In 2021, most adolescents in Massachusetts reported consuming sugary drinks,2 which has been linked to excess weight gain, type 2 diabetes, and heart disease.3,4 Students drink more water when schools provide access to water at lunch at no charge,5 and improving school water access may help kids grow up at a healthy weight.6,7 Creating a healthy, equitable school environment with appealing drinking water access can help set children up for a healthy future.

About the Water Dispensers in Schools Strategy

This strategy applied an equity lens to increasing water access by installing touchless water dispensers on or near school cafeteria lunch lines in K-8 Massachusetts public schools with identified needs. Priority schools would be those with elevated concentrations of lead in drinking water documented via state lead testing programs1 and located in cities and towns with Environmental Justice designation based on the community’s share of households with lower incomes, limited English proficiency, or individuals identifying as Black, Indigenous, or people of color.8 Better drinking water access in schools has been shown to increase water intake and may help promote a healthy weight.6 The Massachusetts Departments of Public Health and Elementary and Secondary Education would provide outreach to school districts to encourage the installation of water dispensers through existing relationships. Putting this strategy into place would require resources for administering the program, installing and maintaining dispensers, utility costs, disposable cup provision, and lead testing and remediation.

Comparing Costs and Outcomes

A CHOICES cost-effectiveness analysis compared the costs and outcomes of installing touchless water dispensers in schools with the costs and outcomes associated with not implementing the voluntary water equity and access program over 10 years (2020-2029).

The installation of touchless water dispensers in schools in Massachusetts is an investment in a more equitable future. By the end of 2029:
If touchless water dispensers were installed in schools in Massachusetts, then by the end of 2029, 265,000 students would be reached with improved access to safe drinking water in schools over 10 years and 129,000 of these students would be Black and Latinx students. This intervention would only cost $9 per student per year to implement.

Conclusions and Implications

Installing water dispensers in K-8 public schools is an effective strategy for increasing access to clean and appealing drinking water, and over 10 years, it could improve drinking water access for 265,000 students in 304 schools in Massachusetts. Adequate water consumption can support well-being and cognitive function.9 Fluoridated water intake also prevents dental caries.10 Such preventive strategies play a critical role in promoting child health. This strategy is also projected to prevent 525 cases of childhood obesity in 2029 and cost, on average, $9 per child to implement each year. It is likely to be cost-effective at commonly accepted thresholds11 based on net cost per population health improvement related to excess weight, at a cost of $72,700 per quality-adjusted life year gained.

In Massachusetts, schools that participate in the state’s drinking water lead testing program are eligible to receive funding to install water dispensers.12 Expanding participation in this opportunity for drinking water testing and fixture installation would provide students and staff with better access to more appealing drinking water. Additionally, the proposed outreach strategy would prioritize installing water dispensers in schools that identify elevated concentrations of lead in their drinking water and in school districts located in communities meeting criteria for Environmental Justice designation.8 Because these communities have a higher proportion of residents who identify as people of color or households with low income, this strategy could promote health equity. Fifty percent of the students that would gain access to improved drinking water would be Black and Hispanic/Latinx, a higher proportion than the state’s student population overall.13

Though investment is required, every student deserves access to clean, appealing drinking water at school and this strategy would support the health of both students and staff in Massachusetts’ schools.

References

  1. MA Executive Office of Energy and Environmental Affairs. Lead and Copper in School Drinking Water Sampling Results. Accessed December 5, 2022. https://www.mass.gov/service-details/lead-and-copper-in-school-drinking-water-sampling-results

  2. Massachusetts Department of Elementary and Secondary Education. 2021 Youth Risk Behavior Survey (YRBS) Results. 2021.

  3. Malik VS, Pan A, Willett WC , Hu FB. Sugar-sweetened beverages and weight gain in children and adults: a systematic review and meta-analysis. Am J Clin Nutr. 2013;98(4):1084-1102.

  4. Chen L, Caballero B, Mitchell DC, et al. Reducing consumption of sugar-sweetened beverages is associated with reduced blood pressure a prospective study among United States adults. Circulation. 2010;121(22):2398-2406.

  5. Bogart LM, Babey SH, Patel AI, Want P, Schuster MA. Lunchtime school water availability and water consumption among California adolescents. J Adolesc Health. 2016; 58(1):98-103, doi: 10.1016/j.jadohealth.2015.09.007.

  6. Schwartz AE, Leardo M, Aneja S, Elbel B. Effect of a School-Based Water Intervention on Child Body Mass Index and Obesity. JAMA Pediatr. 2016; 170(3):220-226. doi:10.1001/jamapediatrics.2015.3778.

  7. Kenney EL, Cradock AL, Long MW, et al. Cost-Effectiveness of Water Promotion Strategies in Schools for preventing Childhood Obesity and Increasing Water Intake. Obesity. 2019;27(12):2037-2045.

  8. MA Executive Office of Energy and Environmental Affairs. Environmental Justice Populations in Massachusetts. Accessed April 7, 2023. https://www.mass.gov/info-details/environmental-justice-populations-in-massachusetts

  9. Popkin BM, D’Anci KE, Rosenberg IH. Water, hydration, and health. Nutr Rev. 2010 Aug;68(8):439-58.

  10. American Dental Association and Centers for Disease Control. Nature’s Way to Prevent Tooth Decay: Water Fluoridation. Published 2006. Accessed July 13, 2021. https://www.cdc.gov/fluoridation/pdf/natures_way.pdf

  11. Neumann PJ, Cohen JT, Weinstein MC. Updating cost-effectiveness–the curious resilience of the $50,000-per-QALY threshold. New England Journal of Medicine. 2014 Aug 28;371(9):796-7. doi: 10.1056/NEJMp1405158. PMID: 25162885.

  12. The Massachusetts Clean Water Trust. About SWIG. Accessed May 5, 2022. https://www.mass.gov/info-details/school-water-improvement-grants-program

  13. Massachusetts Department of Elementary and Secondary Education. 2022-23 Enrollment By Race/Gender Report (District). Updated December 1, 2022. Accessed April 7, 2023. https://profiles.doe.mass.edu/statereport/enrollmentbyracegender.aspx

Suggested Citation:

McCulloch SM, Barrett JL, Reiner JF, Cradock AL, Gortmaker SL. Massachusetts: Water Dispensers in Schools {Issue Brief}. The CHOICES Learning Collaborative Partnership at the Harvard T.H. Chan School of Public Health, Boston, MA; June 2023. For more information, please visit www.choicesproject.org

The design for this brief and its graphics were developed by Molly Garrone, MA and partners at Burness.

This issue brief was developed at the Harvard T.H. Chan School of Public Health through the Childhood Obesity Intervention Cost-Effectiveness Study (CHOICES) Learning Collaborative Partnership. This brief is intended for educational use only. This work is supported by The JPB Foundation and the Centers for Disease Control and Prevention (U48DP006376). The findings and conclusions are those of the author(s) and do not necessarily represent the official position of the Centers for Disease Control and Prevention or other funders.
← Back to Resources

Strategy Profile: Creating Healthier Afterschool Environments

Young boy eating a green apple

The information in this resource is intended only to provide educational information. This profile describes the estimated benefits, activities, resources, and leadership needed to implement a strategy to improve child health. This information can be useful for planning and prioritization purposes.

  • Creating healthier afterschool environments is a strategy to improve nutrition and physical activity policies & practices through the Out of School Nutrition and Physical Activity (OSNAP) initiative for children in grades K-5 attending state-administered 21st Century Learning afterschool programs.

What population benefits?

Children in grades K-5 attending state-administered 21st Century Learning afterschool programs.

What are the estimated benefits?

Relative to not implementing the strategy
Increase vigorous physical activity and improve nutritional quality of snacks and beverages offered in afterschool programs, and, in turn, promote healthy child weight.

What activities and resources are needed?

Activities Resources Who Leads?
Issue regulations to improve nutrition and physical activity policies and practices in afterschool programs • Time to issue and communicate regulations State government
Provide training and technical assistance to regional Healthy Afterschool trainers on how to lead learning collaborative sessions • Time for state Healthy Afterschool coordinator to lead trainings
• Time for regional Healthy Afterschool trainers to be trained and receive technical assistance
• Travel costs
• Training material costs
State healthy afterschool coordinator
Conduct regional learning collaboratives with afterschool program staff including training and technical assistance on goals and implementation activities • Time for regional Healthy Afterschool trainers to lead learning collaboratives and provide technical assistance
• Time for afterschool program staff to attend learning collaboratives and receive technical assistance
• Training material costs
• Travel costs
Regional healthy afterschool trainer
Assess and implement actions to change program practices to meet Healthy Afterschool standards • Time for afterschool program staff to conduct program practice self-assessments and implement changes at their program
• Increase in food costs to provide snacks in compliance with nutrition standards to children attending Healthy Afterschool programs
Afterschool program director
Develop CEU-accredited course for local program staff • Cost to create a CEU-accredited course State healthy afterschool coordinator
Provide educational materials and incentives to local program staff • Material and incentive costs State government
Monitor compliance to ensure afterschool programs are following programmatic requirements • Time for state monitoring and compliance staff to monitor compliance
• Travel costs
State government monitoring and compliance staff
Establish a Healthy Afterschool recognition and monitoring website • Time to create and maintain website State government website developer
Strategy Modification

This strategy could be modified to benefit children who participate in out-of-school programs administered by other organizations (e.g., YMCA or Boys and Girls Club of America). With this modification, the activities necessary to carry out the voluntary recognition program may not be included (e.g., issuing regulations, creating a healthy afterschool nutrition website, and monitoring compliance). With this modification, the impact on health is expected to be similar, and the impact on reach and cost may vary.


FOR ADDITIONAL INFORMATION

Cradock AL, Barrett JL, Kenney EL, Giles CM, Ward ZJ, Long MW, Resch SC, Pipito AA, Wei ER, Gortmaker SL. Using cost-effectiveness analysis to prioritize policy and programmatic approaches to physical activity promotion and obesity prevention in childhood. Prev Med. 2017 Feb;95 Suppl: S17-S27. doi: 10.1016/j.ypmed.2016.10.017. Supplemental Appendix with strategy details available at: https://ars.els-cdn.com/ content/image/1-s2.0-S0091743516303395-mmc1.docx


Suggested Citation

CHOICES Strategy Profile: Creating Healthier Afterschool Environments. CHOICES Project Team at the Harvard T.H. Chan School of Public Health, Boston, MA; May 2023.

Funding

This work is supported by The JPB Foundation and the Centers for Disease Control and Prevention (U48DP006376). The information provided here is intended to be used for educational purposes. Links to other resources and websites are intended to provide additional information aligned with this educational purpose. The findings and conclusions are those of the author(s) and do not necessarily represent the official position of the Centers for Disease Control and Prevention or other funders.

Adapted from the TIDieR (Template for Intervention Description and Replication) Checklist

← Back to Resources

May 2022 Coffee Chat Resource Round-Up

This document compiles resources and information shared during the May 19, 2022 coffee chat, which featured partners who shared how improving access to safe and appealing drinking water in schools and communities is a key strategy for helping children grow up healthy.

← Back to Resources

Brief: Improving Drinking Water Equity and Access in California Schools

School-aged girl drinking water from a reusable water bottle

The information in this brief is intended only to provide educational information.

This brief summarizes a CHOICES Learning Collaborative Partnership model examining a strategy to improve access to drinking water in California schools. This voluntary water equity and access program involves the installation of touchless chilled water dispensers on or near school cafeteria lunch lines in K-8 non-charter California public schools that have adequate plumbing.

The Issue

All children should have access to clean, appealing, and free drinking water no matter where they live or where they go to school. Providing appealing access to drinking water gives students a healthier alternative to sugary drinks, like sweetened fruit drinks, sports drinks, and soda. Students drink more water when schools provide access to water at lunch at no charge,1 and improving school water access can help kids grow up at a healthy weight.2,3

In California, one in 10 schools reported having no access to free drinking water where meals are served despite state and federal requirements.4,5 Additionally, only one in five schools reported meeting criteria considered the standard for excellence in water access.4 Creating a healthy, equitable school environment that includes appealing drinking water access can help set children up for a healthy future.

About the Water Dispensers in Schools Strategy

This strategy focuses on increasing water access by installing touchless water dispensers at schools serving primarily families with low income, which also have a greater share of Black/African American and Latino students than other schools in California. Promoting better drinking water access in schools has been shown to increase water intake during the day and may help promote a healthy weight.3 Thus, it is a strategy that can help local health departments reach the twin goals of increasing access to and promotion of safe drinking water while decreasing access to and consumption of sugary drinks.6 Putting this strategy into place would require resources for administering the program, installing and maintaining dispensers, utility and disposable cup usage, lead testing and remediation, and delivering water-promotion education.

Comparing Costs and Outcomes

A CHOICES cost-effectiveness analysis compared the costs and outcomes of installing touchless water dispensers in schools with the costs and outcomes associated with not implementing the voluntary water equity and access program over 10 years (2020-2030).

Installation of touchless water dispensers in schools in California is an investment in a more equitable future. By the end of 2030:
If touchless water dispensers were installed in schools in California, then, by the end of 2030, 1.88 million children would be reached with improved access to safe drinking water in schools over 10 years; $12 million would be saved in health care costs over 10 years; and this intervention would cost $6 per child per year to implement.

Conclusions and Implications

Installing water dispensers in K-8 public schools is an effective strategy for increasing access to clean, appealing, and free drinking water. Over 10 years, this strategy is expected to improve drinking water access and consumption for over 1.8 million students in California. This strategy is estimated to prevent 3,660 cases of childhood obesity in 2030 and would cost on average $6 per child to implement each year. Comparatively, the value of lunch served to students is $3 per day or about $600 per year.7 While the costs to implement this strategy would be $21,500 per school over 10 years, there would be an estimated $12 million in obesity-related health care cost savings over the same time period.

Improving students’ access to free, clean drinking water could promote health equity. Latino youth report less availability of drinking water access in schools,8 and Black/African American youth are less likely to be adequately hydrated compared with White non-Latino youth.9 Focusing drinking water access improvements in schools with high percentages of Black/African American and Latino students may benefit these populations the most. In addition to promoting a healthy weight, this strategy may also benefit children in other ways. Adequate water consumption can lead to improvements in well-being and support cognitive function.10 Fluoridated water intake also prevents dental caries.11

Though investment is required, every student deserves access to clean, appealing drinking water, and this strategy can be a part of a suite of interventions that support children and their families. Many preventive strategies play a critical role in helping children establish healthy habits early on in life. Focusing on supporting these healthy habits now can help more children grow up at a healthy weight.

References

  1. Bogart LM, Babey SH, Patel AI, Want P, Schuster MA. Lunchtime school water availability and water consumption among California adolescents. Journal of Adolescent Health. 2016; 58(1):98-103, doi: 10.1016/j.jadohealth.2015.09.007.

  2. Schwartz AE, Leardo M, Aneja S, Elbel B. Effect of a School-Based Water Intervention on Child Body Mass Index and Obesity. JAMA Pediatr. 2016; 170(3):220-226. doi:10.1001/jamapediatrics.2015.3778.

  3. Kenney EL, Cradock AL, Long MW, et al. Cost-Effectiveness of Water Promotion Strategies in Schools for Preventing Childhood Obesity and Increasing Water Intake. Obesity. 2019;27(12):2037-2045.

  4. Altman EA, Lee KL, Hecht CA, Hampton KE, Moreno G, Patel AI. Drinking water access in California schools: Room for improvement following implementation of school water policies. Preventive Medicine Reports. 2020;19:101143. Published 2020 Jun 8. doi:10.1016/j.pmedr.2020.101143.

  5. California Department of Education. Drinking Water for Students in Schools. Reviewed January 14, 2020. https://www.cde.ca.gov/ls/nu/he/water.asp#:~:text=California%20Education%20Code%20Section%2038086%20states%20that%20if%20a%20school,reasons%20why%2C%20whether%20due%20to. Accessed February 16, 2021. 

  6. California Department of Public Health. FFY 2020-2022 SNAP-Ed Local Health Departments Programmatic Priorities. Published December 10, 2018. https://www.cdph.ca.gov/Programs/CCDPHP/DCDIC/NEOPB/CDPH%20Document%20Library/Branch16Add2FFY20-22SNAPEdLHD.pdf. Accessed January 29, 2021.

  7. California Department of Education. 2019-20 CNP Reimbursement Rates. https://www.cde.ca.gov/ls/nu/rs/rates1920.asp. Accessed December 12, 2020.

  8. Onfurak SJ, Park S, Wilking C. Student-reported school drinking fountain availability by youth characteristics and state plumbing codes. Preventing Chronic Disease. 2014; 11: E60, doi: 10.5888/pcd11.130314. 

  9. Kenney EL, Long MW, Cradock AL, Gortmaker SL. Prevalence of inadequate hydration among U.S. children and disparities by gender and race/ethnicity: National Health and Nutrition Examination Survey, 2009–2012. American Journal of Public Health. 2015; 105(8): e113-8, doi: 10.2105/AJPH.2015.302572.

  10. Popkin BM, D’Anci KE, Rosenberg IH. Water, hydration, and health. Nutition Reviews. 2010 Aug;68(8):439-58.

  11. American Dental Association and Centers for Disease Control. Nature’s Way to Prevent Tooth Decay: Water Fluoridation. Published 2006. https://www.cdc.gov/fluoridation/pdf/natures_way.pdf. Accessed July 13, 2021. 

Suggested Citation:

Gouck J, Whetstone L, Walter C, Pugliese J, Kurtz C, Seavey-Hultquist J, Barrett J, McCulloch S, Reiner J, Cradock AL. California: Improving Drinking Water Equity and Access in California Schools {Issue Brief}. California Department of Public Health, Sacramento, CA, the County of Santa Clara Public Health Department, San Jose, CA, and the CHOICES Learning Collaborative Partnership at the Harvard T.H. Chan School of Public Health, Boston, MA; December 2021. For more information, please visit www.choicesproject.org

The design for this brief and its graphics were developed by Molly Garrone, MA and partners at Burness.

This issue brief was developed at the Harvard T.H. Chan School of Public Health in collaboration with the California Department of Public Health and the County of Santa Clara Public Health Department through participation in the Childhood Obesity Intervention Cost-Effectiveness Study (CHOICES) Learning Collaborative Partnership. This brief is intended for educational use only. This work is supported by The JPB Foundation and the Centers for Disease Control and Prevention (U48DP006376). The findings and conclusions are those of the author(s) and do not necessarily represent the official position of the Centers for Disease Control and Prevention or other funders.

← Back to Resources

Brief: Creating Healthier Child Care Environments: NAPSACC in the Quality Rating Improvement System in Arkansas

Young kids playing in an early care setting

The information in this brief is intended only to provide educational information.

This brief summarizes a CHOICES Learning Collaborative Partnership model examining a strategy incorporating the Nutrition and Physical Activity Self-Assessment for Child Care (NAP SACC) assessment tools into Better Beginnings, Arkansas’ Quality Rating and Improvement System, to support quality early child care program opportunities and promote child health. 

The Issue

In Arkansas, three out of 10 kindergarteners entering school in 2018 had overweight or obesity.1 The majority of today’s children will have obesity at age 35 if we don’t act.2 Making sure children are growing up at a healthy weight from their very first days is a critical way to prevent obesity and future risk for obesity-related diseases like diabetes as adults. Conditions linked to obesity, previously only seen in adults, are appearing in Arkansas’ Medicaid-enrolled children.3 Early child care programs that support healthy nutrition and physical activity habits show great promise in promoting healthy weight.4

In Arkansas, more than half of children ages 2-5 attend a licensed child care program.5 Providing licensed child care programs with training opportunities and resources through Better Beginnings may be an effective strategy to improve the quality of child care programs and to ensure that the majority of children in Arkansas are off to a healthy start.

About NAP SACC

NAP SACC is an evidence-based, trusted strategy enabling child care centers to attain best practices regarding nutrition, active play, and screen time.4 To date, NAP SACC shows the best evidence for reducing childhood obesity risk in children under age 5.6 Early education program directors and staff complete self-assessments and receive training and technical assistance to implement practices, policies, and changes supporting healthy outcomes. Better Beginnings is designed to improve child care environments to support child health and development. Integrating NAP SACC into Better Beginnings can improve the quality of child care programs and ensure more children grow up healthy in Arkansas.

Comparing Costs and Outcomes

A CHOICES cost-effectiveness analysis compared the costs and outcomes over a 10-year time horizon (2020-2030) of implementing NAP SACC with the costs and outcomes of not implementing the program.

Implementing NAP SACC into Better Beginnings in Arkansas is an investment in child health. By the end of 2030:

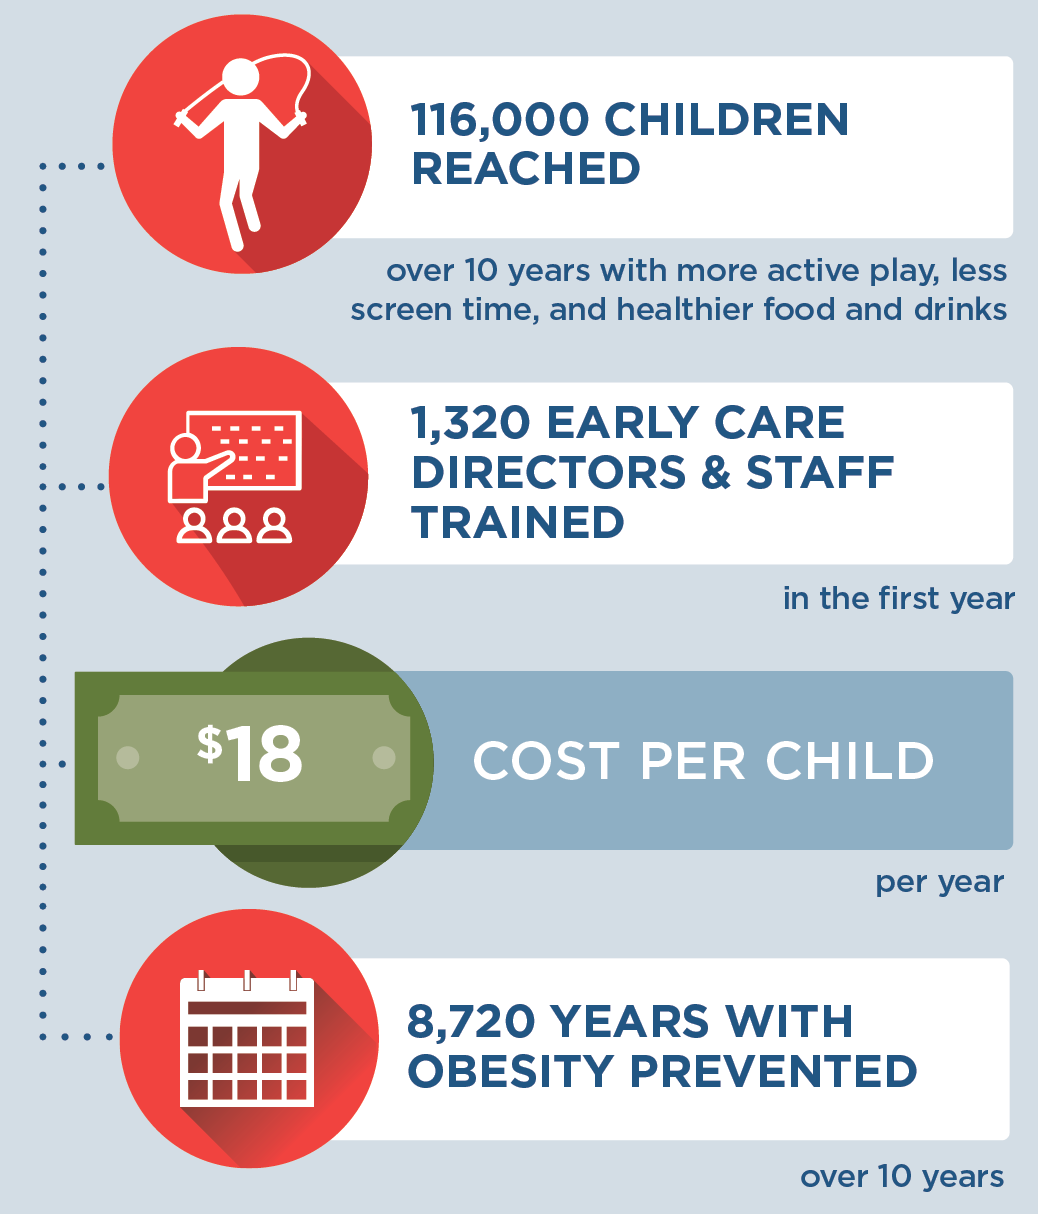
If NAP SACC was incorporated into Better Beginnings in Arkansas, then 116,000 children would be reached over 10 years with more active play, less screen time, and healthier food and drinks. 1,320 early care directors and staff would be trained in the first year. It would cost $18 per child per year to implement. 8,720 years with obesity would be prevented over 10 years.

Conclusions and Implications

Every child should have opportunities for a healthy start. A state-level initiative integrating NAP SACC into training and quality improvement through Better Beginnings could create healthier nutrition and physical activity environments in child care programs for 116,000 children over 10 years. This strategy would benefit 1,320 early care directors and staff with training and technical assistance to support using nutrition, active play, and screen time best practices at 659 child care programs. Over 10 years, children in Arkansas would have 8,720 more years lived at a healthy weight and 1,130 fewer children would have obesity in 2030 alone.

Many prevention strategies targeting children require an upfront investment because costly obesity-related health conditions generally present later in adulthood.7 While we project this strategy would cost $18 per child per year, shortchanging early prevention efforts may lead to costly and complicated treatment in the future. Already, the total annual costs of having obesity are estimated to be $6 million for the 30,000 25- to 29-year-olds enrolled in Medicaid—inclusive of Arkansas’ expansion population. This represents an excess annual cost of $200 per person due to obesity.3

Early child care programs also play a critical role in supporting healthy child development and children’s academic readiness.8 Investing in a strategy for quality improvement that provides the necessary training, technical assistance, and resources supports early educators in providing high-quality child care that nurtures healthy habits. Enabling early education leaders in Arkansas to use the best available evidence to prevent excess weight gain in children will support children’s healthy growth and development.

References

  1. ACHI. (2019). Assessment of Childhood and Adolescent Obesity in Arkansas: Year 16 (Fall 2018–Spring 2019). Arkansas Center for Health Improvement. Little Rock, AR.

  2. Ward Z, Long M, Resch S, Giles C, Cradock A, Gortmaker S. Simulation of Growth Trajectories of Childhood Obesity into Adulthood. New England Journal of Medicine. 2017; 377(22): 2145-2153.

  3. ACHI, Arkansas Medicaid. Comorbid Conditions and Medicaid Costs Associated with Childhood Obesity in Arkansas. 2019.

  4. Alkon A, Crowley AA, Neelon SE, Hill S, Pan Y, Nguyen V, Rose R, Savage E, Forestieri N, Shipman L, Kotch JB. Nutrition and physical activity randomized control trial in child care centers improves knowledge, policies, and children’s body mass index. BMC Public Health. 2014;14:215.

  5. Arkansas Department of Human Services, Division of Child Care and Early Childhood Education, Child Care Facilities Database. Unpublished data. 2020.

  6. Kenney E, Cradock A, Resch S, Giles C, Gortmaker S. The Cost-Effectiveness of Interventions for Reducing Obesity among Young Children through Healthy Eating, Physical Activity, and Screen Time. Durham, NC: Healthy Eating Research; 2019. Available at: http://healthyeatingresearch.org

  7. Gortmaker SL, Wang YC, Long MW, Giles CM, Ward ZJ, Barrett JL, …Cradock, AL. Three interventions that reduce childhood obesity are projected to save more than they cost to implement. Health Affairs. 2015; 34(11), 1932–1939.

  8. Morrisey T. The Effects of Early Care And Education on Children’s Health. Health Affairs Health Policy Brief. 2019

Suggested Citation:

Adams B, Sutphin B, Betancourt K, Balamurugan A, Kim H, Bolton A, Barrett J, Reiner J, Cradock AL. Arkansas: Creating Healthier Child Care Environments: Nutrition and Physical Activity Self-Assessment for Child Care (NAP SACC) in the Quality Rating Improvement System (QRIS) {Issue Brief}. Arkansas Department of Health, Little Rock, AR, and the CHOICES Learning Collaborative Partnership at the Harvard T.H. Chan School of Public Health, Boston, MA; May 2021. For more information, please visit www.choicesproject.org

The design for this brief and its graphics were developed by Molly Garrone, MA and partners at Burness.

This issue brief was developed at the Harvard T.H. Chan School of Public Health in collaboration with the Arkansas Department of Health through participation in the Childhood Obesity Intervention Cost-Effectiveness Study (CHOICES) Learning Collaborative Partnership. This brief is intended for educational use only. This work is supported by The JPB Foundation and the Centers for Disease Control and Prevention (U48DP006376). The findings and conclusions are those of the author(s) and do not necessarily represent the official position of the Centers for Disease Control and Prevention or other funders.

← Back to Resources

Brief: Supporting Healthy Beverage Choices in Out-of-School Time Programs in Wisconsin

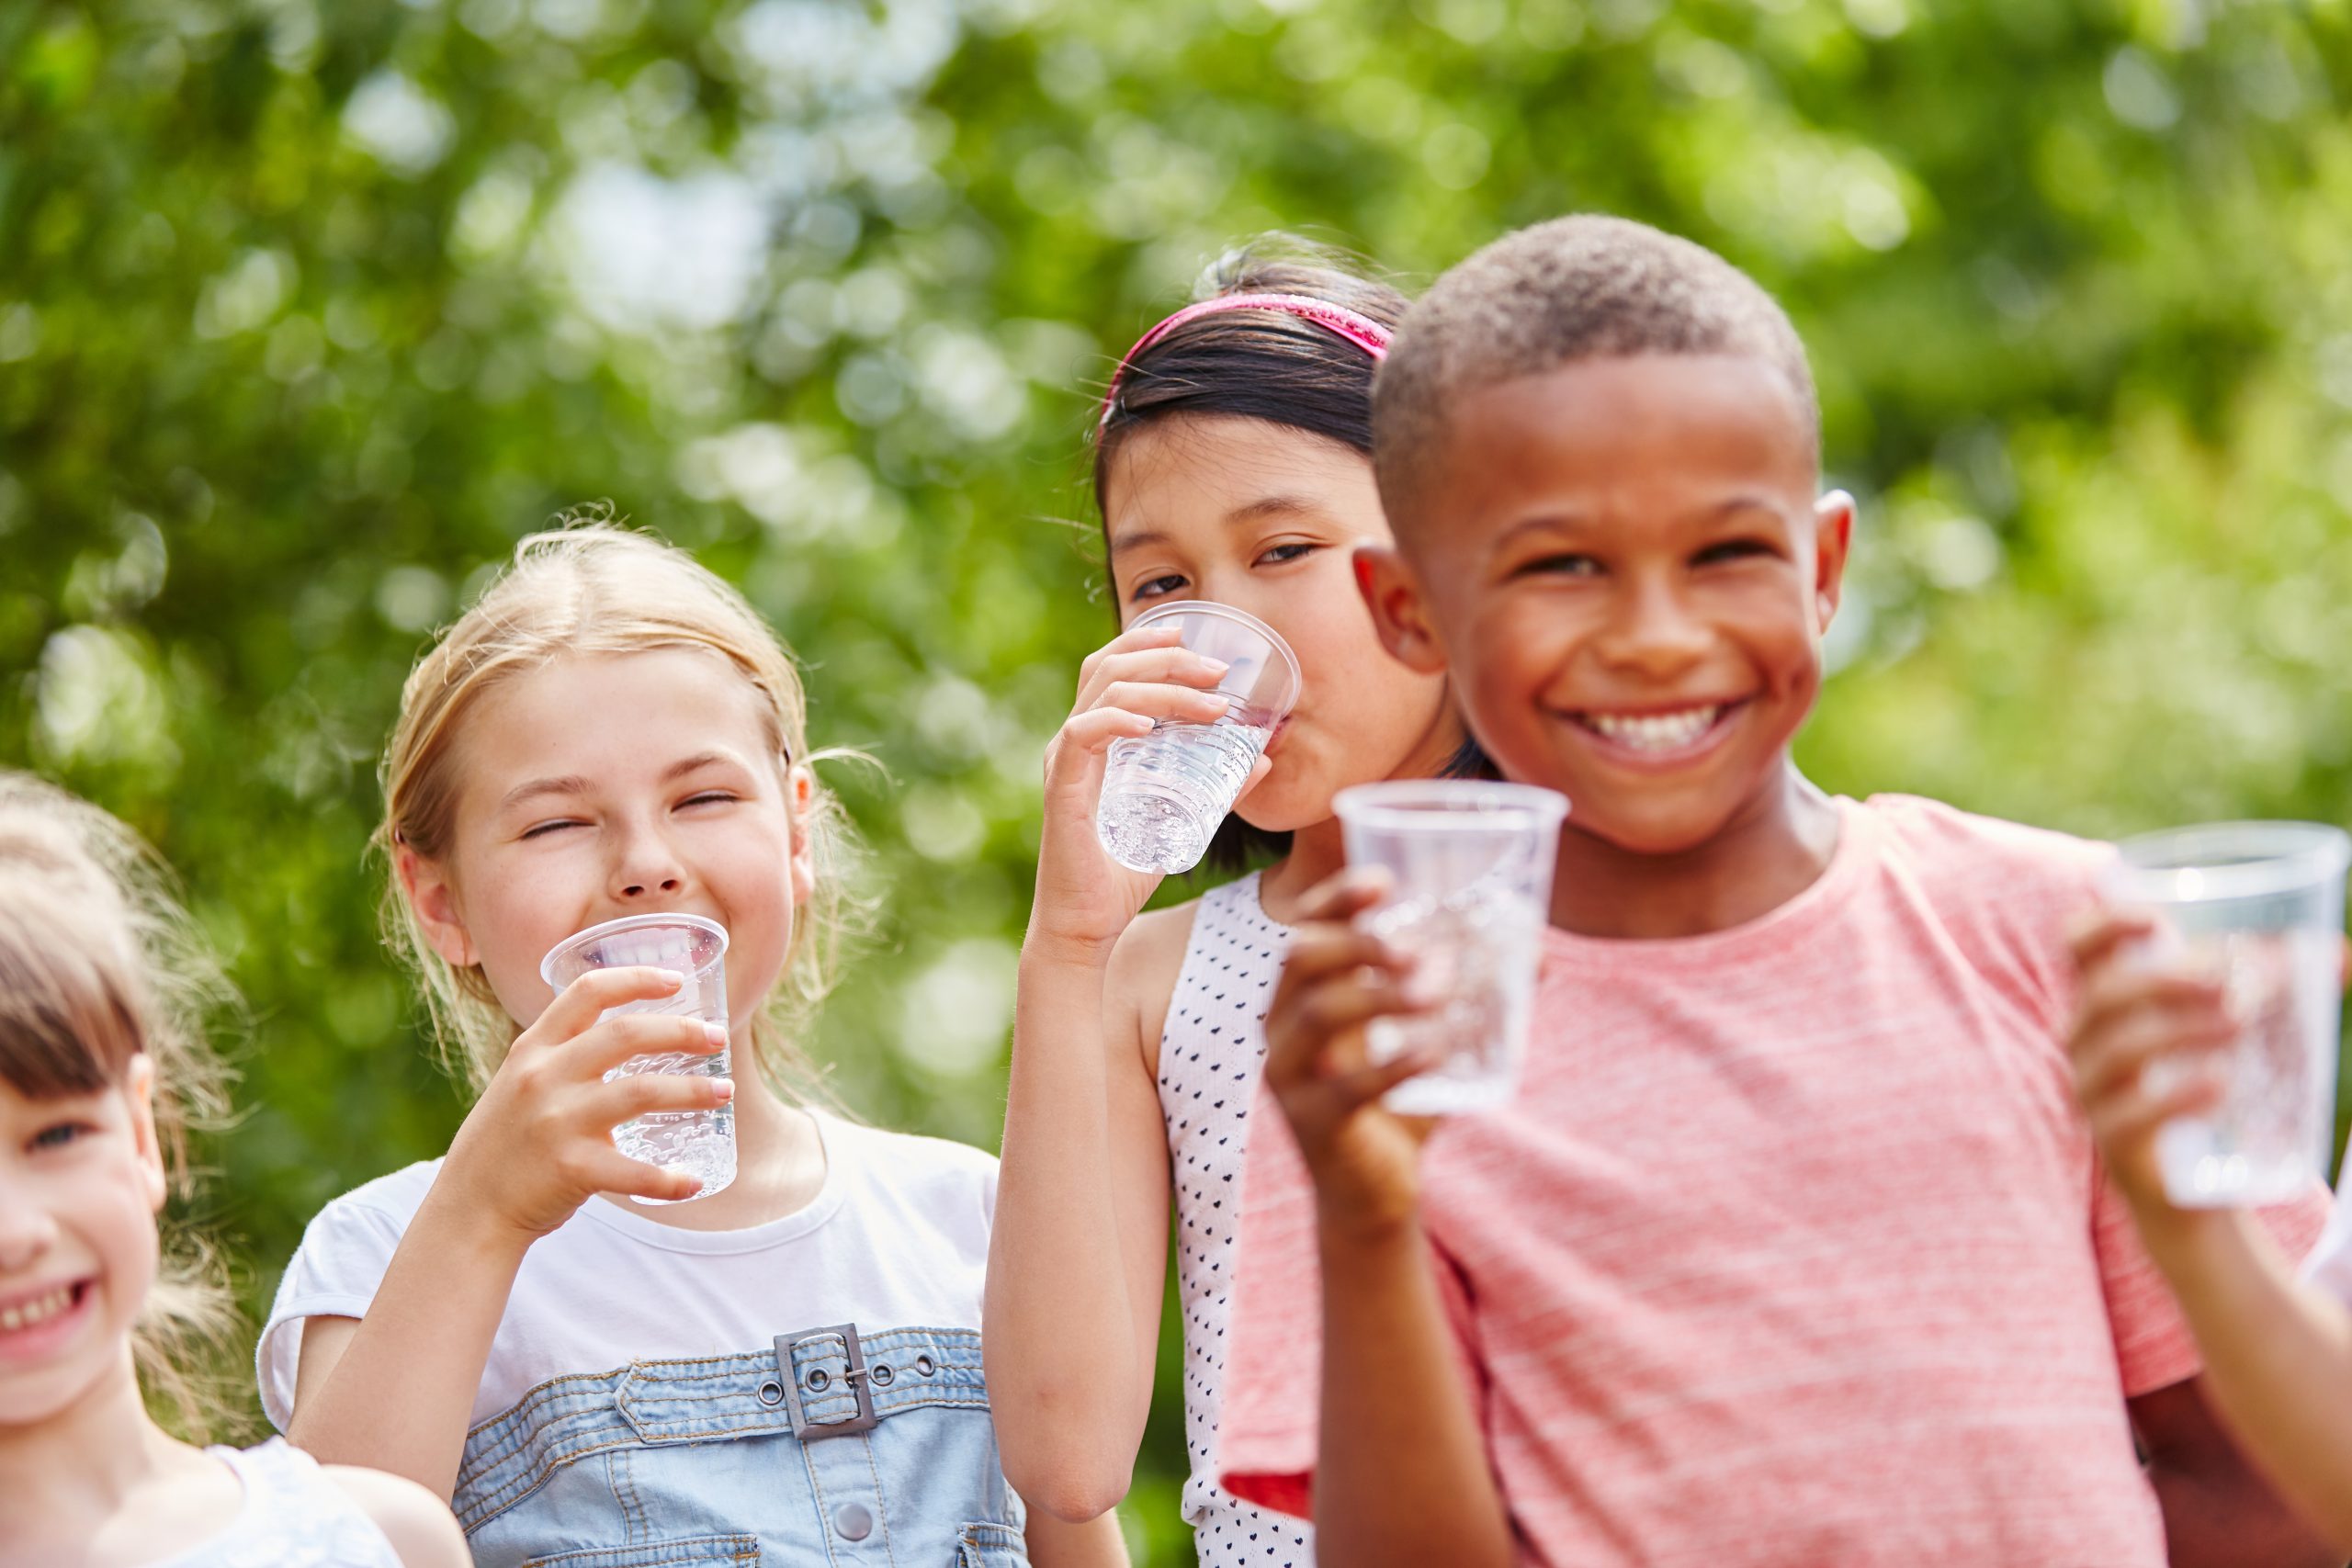
Kids drinking water

The information in this brief is intended only to provide educational information.

This brief summarizes a CHOICES Learning Collaborative Partnership model examining a policy to promote healthy beverage choices in licensed out-of-school time (OST) programs in Wisconsin.

The Issue

All children should have opportunities to grow up at a healthy weight. However, consuming sugary drinks, like sports drinks, soda, and fruit drinks sweetened with sugar, poses a health risk to children. In 2012, almost one in four (23.1%) adolescents in Wisconsin drank a sugary drink at least once a day.1

In Wisconsin, more than 120,000 children attend OST programs.2 These educational settings can provide essential opportunities for children to learn healthy eating habits. However, many OST programs in Wisconsin do not provide guidance to children or their families about the types of beverages that should be brought in to drink while children participate in program activities. Many programs must meet high national nutrition standards for the foods and beverages they serve to kids. However, when children bring in their own drinks, they can be less healthy than options served by the programs they attend.3 Promoting only healthy beverage choices in OST programs may improve children’s health by reducing sugary drink consumption.4,5

About the Healthy Beverage Policy

We looked at a strategy that would support OST programs in adopting a healthy beverage policy. Programs that participate in YoungStar, Wisconsin’s childcare quality rating and improvement system, and receive their snacks through meal programs that meet national nutrition standards, were considered the subset of eligible sites. A healthy beverage policy would set nutritional standards for the beverages that could be brought into the OST programs, ensuring that all beverages available in these programs meet national standards that support good nutrition.3 Implementation would include training and informing OST program directors about the need for policy change and ways to incorporate the new policy into their program handbooks. YoungStar Technical Consultants would provide technical assistance to support policy adoption, and program staff would complete surveys annually to monitor policy implementation.

Comparing Costs and Outcomes

A CHOICES cost-effectiveness analysis compared the costs and outcomes of implementing a healthy beverage policy in OST programs with the costs and outcomes associated with not implementing the healthy beverage policy over 10 years (2020-2030).

Implementing a healthy beverage policy in programs in Wisconsin could support good nutrition and save families money. By the end of 2030:

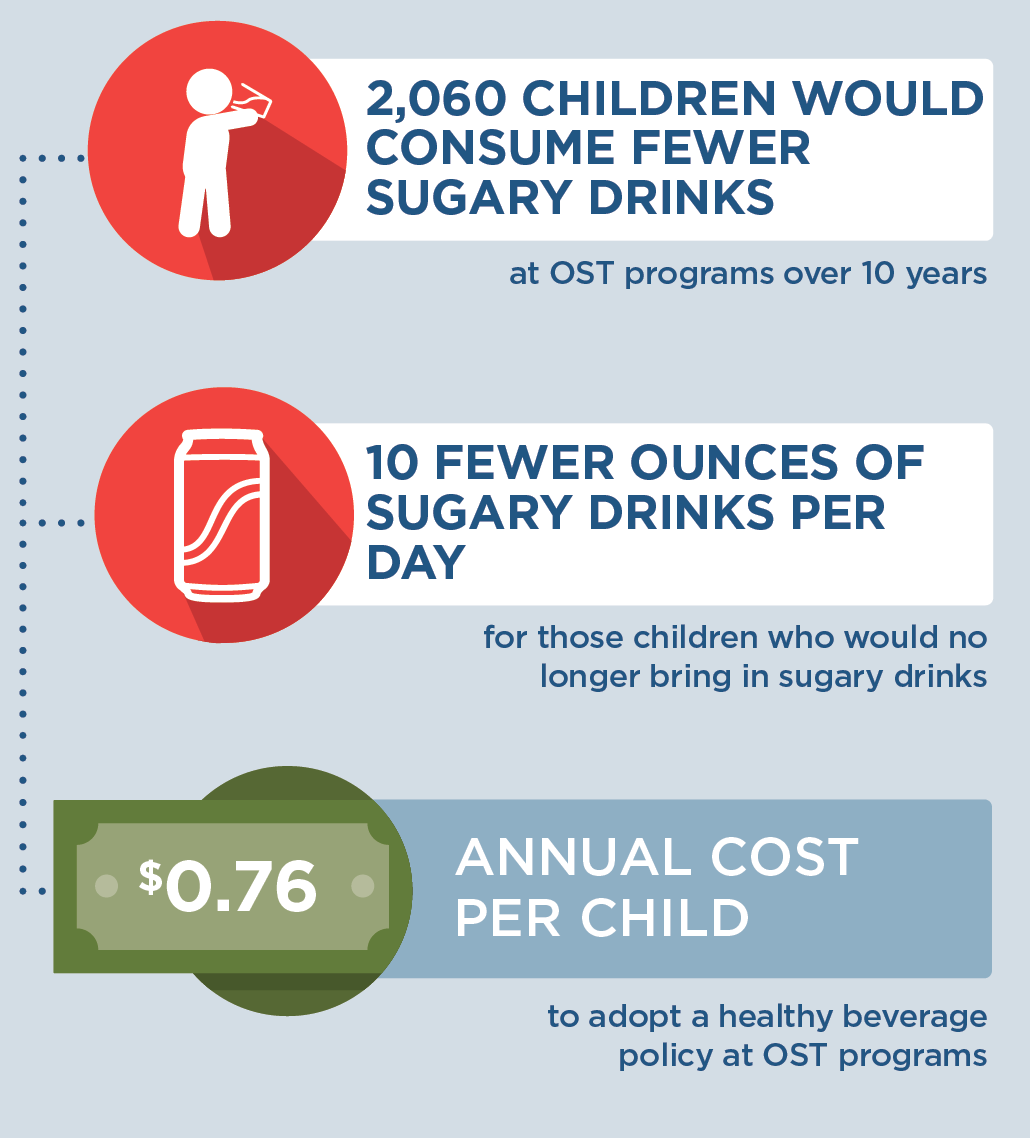
If a healthy beverage policy was implemented in OST programs in Wisconsin, then by the end of 2030, 2,060 children would consume fewer sugary drinks, and children who would no longer bring in sugary drinks would drink 10 fewer ounces of sugary drinks per day. To adopt a healthy beverage policy at OST programs in Wisconsin, it would cost $0.76 per child annually.

Conclusions and Implications

Adopting a healthy beverage policy in OST programs in Wisconsin could promote better health for children and save families money. Over 10 years, this strategy could support 145 programs in creating healthier environments for the more than 33,000 children they will serve. This would cost less than a dollar per child participating in these OST programs per year. Over 10 years, 2,060 children would be consuming 10 fewer ounces of sugary drinks per day on the days they attend the OST program. Over 10 years, this could amount to $555,000 in savings for families who no longer buy sugary beverages for their children to bring into OST programs. Consuming fewer sugary drinks can promote better oral health,6 and prevent more children from having obesity.4 In 2030 alone, it is expected there will be 15 fewer cases of obesity if Wisconsin OST programs implemented healthy beverage policies.

OST programs can play a critical role in helping children establish healthy nutritional habits early on in life. Many providers want to offer an environment that nurtures healthy children, but some programs may need support to integrate new nutrition standards. YoungStar can provide training and resources to help OST program providers adopt nutrition standards that reinforce healthy nutrition habits.7 With training on nutritional standards, OST program directors and program staff would also have the opportunity to learn about and adopt healthier eating habits as well.8 A healthy beverage policy could support OST providers in providing healthier program settings for children in the hours outside of school.

References

  1. CDC, Division of Nutrition, Physical Activity and Obesity. Wisconsin: State Nutrition, Physical Activity, and Obesity Profile. Published September 2012. https://www.cdc.gov/obesity/stateprograms/fundedstates/pdf/wisconsin-state-profile.pdf

  2. Marshfield Clinic Center for Community Outreach. Afterschool in Wisconsin: Building Our Children’s Future, One Program at a Time. https://www.ncsl.org/Portals/1/Documents/educ/Wisconsin_infographic.pdf. Accessed December 18, 2020.

  3. Kenney EL, Austin SB, Cradock AL, Giles CM, Lee RM, Davison KK, Gortmaker SL. Identifying sources of children’s consumption of junk food in Boston afterschool programs, April-May 2011. Preventing Chronic Disease. 2014 Nov 20;11:E205.

  4. Malik VS, Schulze MB, Hu FB. Intake of sugar-sweetened beverages and weight gain: a systematic review. American Journal of Clinical Nutrition. 2006;84(2):274– 88.

  5. Khan LK, Sobush K, Keener D, Goodman K, Lowry A, Kakietek J, et al. Recommended community strategies and measurements to prevent obesity in the United States. MMWR Recommendations and Reports. 2009;58(RR-7):1–26.

  6. Sheiham A, James WPT. A new understanding of the relationship between sugars, dental caries and fluoride use: implications for limits on sugars consumption. Public Health Nutrition. 2014;17(10):2176-2184.

  7. Wisconsin Department of Children and Families. YoungStar Training and Professional Development. https://dcf.wisconsin.gov/youngstar/providers/training. Accessed January 6, 2021.

  8. Weaver RG, Beets MV, Saunders RP, Beighle A, Webster C. A Comprehensive Professional Development Training’s Effect on Afterschool Program Staff Behaviors to Promote Healthy Eating and Physical Activity. Journal of Public Health Management & Practice. 2014;20(4):E6-E14.

Suggested Citation:

Salas TM, Meinen A, Kim H, McCulloch S, Reiner J, Barrett J, Cradock AL. Wisconsin: Supporting Healthy Beverage Choices in Out-of-School Time Programs {Issue Brief}. Wisconsin Department of Health Services & University of Wisconsin-Madison, Madison, WI, and the CHOICES Learning Collaborative Partnership at the Harvard T.H. Chan School of Public Health, Boston, MA; May 2021. For more information, please visit www.choicesproject.org

Funding for the Survey of the Health of Wisconsin (SHOW) was provided by the Wisconsin Partnership Program PERC Award (233 AAG9971). The authors would also like to thank the University of Wisconsin Survey Center, SHOW administrative, field, and scientific staff, as well as all the SHOW participants for their contributions to this study.

The design for this brief and its graphics were developed by Molly Garrone, MA and partners at Burness.

This issue brief was developed at the Harvard T.H. Chan School of Public Health in collaboration with the Wisconsin Department of Health Services through participation in the Childhood Obesity Intervention Cost-Effectiveness Study (CHOICES) Learning Collaborative Partnership. This brief is intended for educational use only. This work is supported by The JPB Foundation and the Centers for Disease Control and Prevention (U48DP006376). The findings and conclusions are those of the author(s) and do not necessarily represent the official position of the Centers for Disease Control and Prevention or other funders.
← Back to Resources

Brief: Supporting Healthy Food and Beverage Choices in Afterschool Programs in Allegheny County, Pennsylvania

Young boy eating a green apple

The information in this brief is intended only to provide educational information.

This brief summarizes a CHOICES Learning Collaborative Partnership model examining the potential impacts of a healthy snack policy in afterschool programs that already provide snacks through the National School Lunch Program or the Child and Adult Care Food Program.

The Issue

All children deserve the opportunity to grow up at a healthy weight. If current trends in childhood obesity continue, most of today’s children will have obesity at age 35.1 The health care costs of treating obesity-related conditions in adulthood were $147 billion in 2008.2 Snacks account for 25% of total calorie intake among most U.S. children and are frequently composed of sweet foods and sugar-sweetened drinks,3 beverages that increase the risk of excess weight gain.4 Promoting healthy food and beverage choices in afterschool programs is one opportunity to improve children’s diets and potentially reduce childhood obesity.5

In Allegheny County, nearly 10,000 children attend an afterschool program that typically allows participants to bring in snacks that they can consume during the program. When children bring in their own snacks to afterschool programs, those snacks are often less healthy than snacks served within federal reimbursable meal programs.6

About a Healthy Snack Policy

A policy that does not allow children to bring in their own snacks to afterschool programs and only offers healthy food and/or beverage choices that are part of federal reimbursable meal programs could support good nutrition. Snacks refer to both foods and beverages. In Allegheny County, UPMC Children’s Hospital of Pittsburgh, and Allegheny Partners for Out-of-School Time work with 120 sites across the county through Healthy Out-of-School Time and Quality Campaign. The majority of these sites (117) serve snacks though federal reimbursable meal programs, but allow children to bring in their own snacks. These sites could benefit from adopting a healthy snack policy. Activities to support adoption of this policy would include training site directors, who would in turn train program staff. During the academic year, Healthy Out-of-School Time and Quality Campaign site coordinators would provide technical assistance to support policy adoption.

Comparing Costs and Outcomes

CHOICES cost-effectiveness analysis compared the costs and outcomes of adopting a healthy snack policy in 117 Healthy Out-of-School Time and Quality Campaign afterschool programs over 10 years. Programs could adopt either a policy that does not allow children to bring in sugary drinks or a policy that does not allow children to bring in either sugary drinks or their own food to afterschool programs.

Implementing a healthy snack policy could support good nutrition and save families money. By the end of 2027:
An infographic about the healthy snack policy results. The bottom of the graphic shows increased numbers for a food and drink plan instead of only a drink plan. The food and drink results are: 4, 510 children would consume fewer unhealthy snacks; 50 cases of childhood obesity prevented; $1,690,000 saved by families.

Conclusions and Implications

Adopting a healthy snack policy could promote better health for children in afterschool programs and save families money. For some programs, it may be more feasible to adopt a policy addressing sugary drinks only. Clear evidence links sugary drink consumption to excess weight gain.4

We estimate that providing the training, technical assistance, communication, coordination, and monitoring in afterschool programs to support the adoption of a healthy snack policy that only addresses sugary drinks would cost $53,500 over 10 years. It could also result in $965,000 in savings for families ($243 per child) who are no longer purchasing beverages for their children to bring to afterschool. Those children who regularly bring sugary drinks to afterschool programs and attend Healthy Out-of-School Time and Quality Campaign afterschool programs that adopt a healthy snack policy could reduce sugary drink consumption by 10 ounces per day on those days they attend programming. In addition, 27 cases of childhood obesity could be prevented in 2027 and $53,900 in obesity-related health care costs could be saved. Afterschool programs adopting a healthy snack policy can support healthy nutrition habits for children and lay a foundation for better health.

References

  1. Ward ZJ, Long MW, Resch SC, Giles CM, Cradock AL, Gortmaker SL. Simulation of Growth Trajectories of Childhood Obesity into Adulthood. New England Journal of Medicine. 2017 Nov 30;377(22):2145-2153.
  2. Finkelstein EA, Trogdon JG, Cohen JW, Dietz W. Annual Medical Spending Attributable To Obesity: Payer-And Service-Specific Estimates. Health Affairs. 2009;28(5).
  3. Wang D, van der Horst K, Jacquier E, Eldridge AL. Snacking among US children: patterns differ by time of day. Journal of Nutrition Education and Behavior. 2016; 48(6), 369-375.
  4. Malik VS, Schulze MB, Hu FB. Intake of sugar-sweetened beverages and weight gain: a systematic review. American Journal of Clinical Nutrition. 2006;84(2):274–88.
  5. Khan LK, Sobush K, Keener D, Goodman K, Lowry A, Kakietek J, et al. Recommended community strategies and measurements to prevent obesity in the United States. MMWR Recomm Rep 2009;58(RR-7):1–26.
  6. Kenney EL, Austin SB, Cradock AL, Giles CM, Lee RM, Davison KK, Gortmaker SL. Identifying sources of children’s consumption of junk food in Boston after-school programs, April-May 2011. Preventing Chronic Disease. 2014 Nov 20;11:E205
Suggested Citation:

Pagnotta M, Hardy H, Burry K, Flax CN, Barrett JL, Cradock AL. Allegheny County, PA: Supporting Healthy Food and Beverage Choices in Afterschool Programs {Issue Brief}. Allegheny County Health Department, Pittsburgh, PA, and the CHOICES Learning Collaborative Partnership at the Harvard T.H. Chan School of Public Health, Boston, MA; November 2019.

The design for this brief and its graphics were developed by Molly Garrone, MA and partners at Burness.

This issue brief was developed at the Harvard T.H. Chan School of Public Health in collaboration with the Allegheny County Health Department (ACHD) through participation in the Childhood Obesity Intervention Cost-Effectiveness Study (CHOICES) Learning Collaborative Partnership. This brief is intended for educational use only. Funded by The JPB Foundation. Results are those of the authors and not the funders.

← Back to Resources

Cost-Effectiveness of Water Promotion Strategies in Schools

A CHOICES study found that installing chilled water dispensers on school lunch lines could be a relatively low-cost strategy to help children drink more water and prevent future cases of childhood obesity.

Kenney EL, Cradock AL, Long MW, Barrett JL, Giles CM, Ward ZJ, Gortmaker SL. Cost-Effectiveness of Water Promotion Strategies in Schools for Preventing Childhood Obesity and Increasing Water Intake. Obesity. 2019 Dec. doi:10.1002/oby.22615.

Increasing access to and promotion of drinking water in schools could help improve child health in a number of ways, including better hydration, improved cognition, and healthier teeth, if the water is fluoridated. However, there is limited evidence on how promoting water in schools could reduce childhood obesity and the costs of strategies that could facilitate such promotion.

The authors of this study sought to estimate the cost-effectiveness of installing chilled water dispensers (known as “water jets”) on school lunch lines and how it could impact childhood obesity. In addition, they compared key findings about water jets with three other national water promotion strategies to understand the costs of different approaches and their impacts on water consumption. The team selected the three other strategies because of existing evidence linking them to increased water intake.

To facilitate this study, the team used the CHOICES microsimulation model to estimate over a ten-year time frame the impact of each of the four strategies on children in kindergarten through eighth grade attending schools that participate in the National School Lunch Program (NSLP). The team analyzed all four strategies – Grab a Cup, Fill It Up (an intervention where signage and disposable cups are placed next to existing water fountains), portable water dispensers, bottle-less water coolers, and water jets – to assess their cost-effectiveness and impact on water intake. They also estimated how water jets could impact the number of cases of childhood obesity in 2025.

Key findings from the study included:

  • Water jets would cost $4.25 per child in the first year
  • Water jets could prevent nearly 180,000 cases of childhood obesity in the year 2025
  • Over ten years, water jets could save nearly $390 million in health care costs nationally
  • In the first year, children reached by water jets would increase their water intake by 1.43 ounces per day
  • While Grab a Cup, Fill it Up was the least costly – totaling about $122 million in costs over 10 years – it also had the lowest impact on water intake

Making water jets available for students on school lunch lines could save almost half of the money required to install these dispensers, and could positively impact child health. Interventions that promote drinking water are lower-cost solutions to consider adding to the toolkit of public health school-based strategies to reduce obesity risk.

← Back to Resources

Brief: Nutrition and Physical Activity Self-Assessment for Child Care (NAP SACC) Intervention in West Virginia

The information in this brief is intended for educational use only.

This brief provides a summary of the CHOICES Learning Collaborative Partnership simulation model of integrating Key 2 a Healthy Start, West Virginia’s implementation of Nutrition and Physical Activity Self-Assessment for Child Care (NAP SACC), into the state’s Tiered Reimbursement system, which provides subsidy incentives to child care centers meeting quality standards.

The Issue

Over the past four decades, childhood obesity has tripled.1 In WV, obesity rates in 2-4 year old WIC participants increased from 14% up to 16.4% in 2014.2 WV was one of four states that experienced increasing rates in this young population. Now labeled as an epidemic, health care costs for treating obesity-related health conditions such as heart disease and diabetes range from $147 billion to $210 billion per year.3 While multiple strategies are needed to reverse the epidemic, emerging prevention strategies directed at children show great promise for addressing the epidemic.4 A large body of evidence shows that healthy eating, physical activity, and limiting sugary drinks and screen time helps kids grow up at a healthy weight.

In West Virginia, 41% of 2-5 year olds attend a licensed child care center. Licensed centers can offer healthy, nurturing environments for children. Tiered Reimbursement can encourage and empower centers to voluntarily improve nutrition, physical activity, and screen time standards while increasing financial incentives.

About Key 2 A Healthy Start

Key 2 a Healthy Start is based on NAP SACC, an evidence-based intervention for helping child care centers attain best practices regarding nutrition, active play, and screen time.5,6 The program enables child care directors and staff to complete self-assessments of their nutrition, active play, and screen time practices and receive training and technical assistance to implement changes that create healthier environments and policies. Integrating Key 2 a Healthy Start into West Virginia’s Tiered Reimbursement system would incentivize and support participation in the intervention and broaden its availability.

Comparing Costs and Outcomes

CHOICES cost-effectiveness analysis compared the costs and outcomes of integrating Key 2 a Healthy Start into Tiered Reimbursement over 10 years versus the costs and outcomes of not implementing the intervention. This model assumes that 44% of licensed child care centers will participate in Tiered Reimbursement and thus participate in Key 2 a Healthy Start.

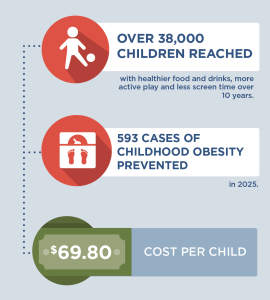
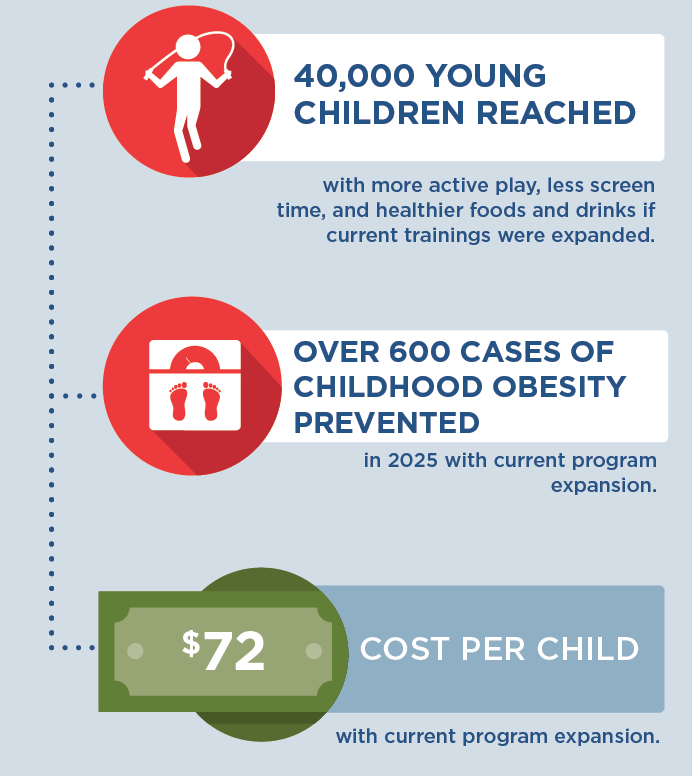
Implementing Key 2 a Healthy Start in child care centers throughout West Virginia is an investment in the future:If Key 2 a Healthy Start in child care centers were implemented throughout West Virginia, then over 38,000 children would be reached with healthier food and drinks, more active play, and less screen time over 10 years; 593 cases of childhood obesity would be prevented in 2025 (the final year of the model), and it would cost $69.80 per child to implement.

Conclusions and Implications

Every child deserves a healthy start in life. This includes ensuring that all kids have access to healthy foods and drinks and to be physically active, no matter where they live or which child care they attend. A state-level initiative to bring Key 2 a Healthy Start to West Virginia’s child care centers through the Tiered Reimbursement system could prevent 593 cases of childhood obesity in the last year of the model. Additionally, healthy child care environments and policies would be implemented for over 38,000 children.

For every $1.00 spent on implementing Key 2 a Healthy Start, a savings of $0.10 in health care costs is estimated. These results reinforce the importance of Key 2 a Healthy Start as primary obesity prevention. Implementing small changes early for young children can help them develop healthy habits for life, thereby avoiding more costly and ineffective treatment options in the future.

Evidence is growing about how to help children achieve a healthy weight. Programs such as Key 2 a Healthy Start are laying the foundation for healthier futures by helping child care centers create environments and policies that nurture healthy habits. Leaders at the federal, state, and local level should use the best available evidence to determine which evidence-based interventions hold the most promise for children to develop and maintain a healthy weight.

References

  1. Fryar CD, Carroll MD, Ogden CL, Prevalence of overweight and obesity among children and adolescents: United States, 1963-1965 through 2011-2012. Atlanta, GA: National Center for Health Statistics, 2014.
  2. Pan L, Freedman DS, Sharma AJ, et al. Trends in Obesity Among Participants Aged 2-4 Years in the Special Supplemental Nutrition Program for Women, Infants, and Children – United States, 2000–2014. Morbidity and Mortality Weekly Report (MMWR) 2016;65:1256–1260. DOI.
  3. Gortmaker SL, Wang YC, Long MW, Giles CM, Ward ZJ, Barrett JL, Kenney EL, Sonneville KR, Afzal AS, Resch SC, Cradock AL. Three interventions that reduce childhood obesity are projected to save more than they cost to implement. Health Aff (Millwood). 2015 Nov;34(11):1932-9.
  4. West Virginia Bureau of Children and Families (2015).
  5. Ward DS, Benjamin SE, Ammerman AS, Ball SC, Neelon BH, Bangdiwala SI. Nutrition and physical activity in child care: results from an environmental intervention. Am J Prev Med. 2008 Oct;35(4):352-6.
  6. Alkon A, Crowley AA, Neelon SE, Hill S, Pan Y, Nguyen V, Rose R, Savage E, Forestieri N, Shipman L, Kotch JB. Nutrition and physical activity randomized control trial in child care centers improves knowledge, policies, and children’s body mass index. BMC Public Health. 2014 Mar 1;14:215.
Suggested Citation:

Jeffrey J, Giles C, Flax C, Cradock A, Gortmaker S, Ward Z, Kenney E. West Virginia Key 2 a Healthy Start Intervention [Issue Brief]. West Virginia Department of Health and Human Resources, Charleston, WV, and the CHOICES Learning Collaborative Partnership at the Harvard T.H. Chan School of Public Health, Boston, MA; April, 2018.

This issue brief was developed at the Harvard T.H. Chan School of Public Health in collaboration with the West Virginia Department of Health and Human Resources through participation in the Childhood Obesity Intervention Cost-Effectiveness Study (CHOICES) Learning Collaborative Partnership. This brief is intended for educational use only.

← Back to Resources