Resource Type: Peer-Reviewed Publications

WIC Food Package Changes: Trends in Childhood Obesity Prevalence

A CHOICES study analyzed changes in childhood obesity prevalence among children participating in WIC both before and after food package changes were enacted in 2009, and found that obesity prevalence among children participating in WIC has been decreasing since the 2009 changes.

Daepp MIG, Gortmaker SL, Wang YC, Long MW, Kenney EL. WIC Food Package Changes: Trends in Childhood Obesity Prevalence. Pediatrics. 2019;143(5):e20182841.

The aim of this study was to evaluate if the changes made to the foods that could be purchased through the U.S. Special Supplemental Nutrition Program for Women, Infants, and Children (WIC) in 2009 had an impact on childhood obesity.

In 2009, the lists of foods that could be purchased with WIC vouchers (known as the WIC food packages), which includes basic food categories, were updated to better align with the Dietary Guidelines for Americans. The new package, still in use today, provided extra cash allowances for fruits and vegetables, cut the previous juice allowance in half, required low-fat or skim milk for 2-4 year olds, reduces cheese, and required whole-grain instead of refined-grain products (among other changes).

Earlier studies showed that this shift had resulted in significant changes in WIC participants’ diets and in lowering the amount of calories they consumed. The Centers for Disease Control showed that there had been some declines in childhood obesity prevalence among WIC participants in recent years.1 However, there had not yet been a direct test of whether the WIC package change may have catalyzed a turn-around in childhood obesity rates among WIC participants.

Using state-specific obesity prevalence data for 2-4 year olds participating in WIC from 2000 to 2014, the researchers estimated the annual trend in obesity prevalence across states, and then tested whether that trend significantly changed after the WIC package revision in 2009, adjusting for changes in demographics.

The researchers found that, before the 2009 WIC food package change, the prevalence of obesity across states among 2-4 year olds participating in WIC was growing 0.23 percentage points annually. However, after 2009, this alarming trend switched direction. Instead, the prevalence of obesity across states among 2-4 year olds participating in WIC started decreasing by 0.34 percentage points annually.

“Our study suggests that, in addition to its critical role in reducing the burden of food insecurity and improving nutrition among young children in low-income families, WIC also can help promote healthy weight,” says co-author Erica Kenney, CHOICES Co-Investigator and Professor of Public Health Policy in the Department of Health Policy and Management at the Harvard T.H. Chan School of Public Health. “This is especially encouraging given that over half of all infants born in the U.S. are eligible for the program – there is a real opportunity here to have a positive impact on childhood obesity.”

These results suggest that the 2009 WIC food package change likely helped to reverse the rapid increase in obesity prevalence among WIC participants observed before the food package change, helping set the millions of young children who benefit from WIC on a path toward a healthier weight.


References

  1. Pan L, Freedman DS, Sharma AJ, Castellanos-Brown K, Park S, Smith RB, Blanck HM. Trends in Obesity Among Participants Aged 2-4 Years in the Special Supplemental Nutrition Program for Women, Infants, and Children – United States, 2000-2014. MMWR Morb Mortal Wkly Rep. 2016 Nov 18;65(45):1256-1260. doi: 10.15585/mmwr.mm6545a2

← Back to Resources

Simulation of Growth Trajectories of Childhood Obesity into Adulthood

A CHOICES study finds that the obesity epidemic is far from over and is likely to become much worse, as study results predict that 57% of today’s children will have obesity at age 35. Public health professionals need to re-double their efforts to prevent such an outcome. The CHOICES Project has identified cost-effective interventions in school and community settings that can prevent future obesity cases.

Ward Z, Long M, Resch S, Giles C, Cradock A, Gortmaker S. Simulation of Growth Trajectories of Childhood Obesity into Adulthood. N Engl J Med. 2017 Nov 30;377(22):2145-2153.

The current childhood obesity epidemic has been well-documented, but more research is needed on the long-term risks for children. For this study, the researchers developed an individual-level simulation model for the current population of children in the U.S. that estimates the risk of adult obesity at age 35 years. Height and weight data were gathered from 5 nationally-representative longitudinal studies. The model, representative of the U.S. population in 2016, created 1,000 virtual populations of 1 million children each. Using this model with these virtual populations, obesity risk trajectories were projected up to the age of 35 years.CHOICES model projecting obesity risk up to the age of 35 years. The majority of today's children will have obesity at age 35. Predicated prevalence of obesity among 2-year-olds at future ages. Age 2: 9%. Age 5: 12%. Age 10: 26%. Age 15: 26%. Age 20: 32%. Age 25: 46%. Age 30: 55%. Age 35: 59%. Projections show that 59% of today's 2-year-olds will have obesity when they are 35.

The researchers predict that, if nothing is done to change current trends, 57% of today’s children will have obesity at age 35. This is a large increase, given that 37% of adults now have obesity. In addition, the study found that excess weight in childhood is highly predictive of adult obesity. This is especially true for children with severe obesity, even at very young ages. The team estimated that 79% of two year-olds with severe obesity will still have obesity by the time they are 35 years old, as will 94% of 19 year-olds with severe obesity. Racial and ethnic disparities in obesity are already present by the age of two and persist into adulthood.

The results of this study reinforce some important public health messages.

“We find that obesity will be a significant problem for most children in the U.S. as they grow older,” said Zachary Ward, lead author on the study. “Given their increased risk of adult obesity, it seems clear that children who already have obesity are prime candidates for early intervention. However, even children currently at a healthy weight can benefit from preventive interventions, given the high risk of developing obesity in young adulthood.”

The team also noted that the findings of this study highlight the importance of promoting a healthy weight throughout childhood and into adulthood.

Given the high risk posed to children – especially those who already have obesity – public health professionals need to work to identify and implement effective strategies that focus on preventive interventions for all children. In previous work, the CHOICES team has identified a number of cost-effective interventions that with broad population reach. Such interventions focus on preventing excess weight gain starting at an early age by providing opportunities for healthier foods, beverages, and physical activity, such as within early care and education and school settings. Some of these interventions are projected to save more in future health care costs than they cost to implement.


See our news story for the full list of media coverage of this article.


Forecasting Trends in Child Obesity with Zach Ward

Lead author Zach Ward discusses the paper with the Center for Health Decision Science.

Forecasting Trends in Child Obesity with Zach Ward from CHDS Media Hub on Vimeo.

← Back to Resources

Cost-Effectiveness of a Clinical Childhood Obesity Intervention

A CHOICES study estimates that the national implementation of an intervention focused on electronic health record (EHR)-based decision support for primary care providers and self-guided behavior change support for parents is likely a more cost-effective approach to treating children with obesity than previous clinical interventions reporting cost information.

Sharifi M, Franz C, Horan CM, Giles C, Long M, Ward Z, Resch S, Marshall R, Gortmaker S, Taveras E. Cost-Effectiveness of a Clinical Childhood Obesity Intervention. Pediatrics. 2017; 140(5):e20162998.

Over 12 million children and adolescents in the United States have obesity (17% of the population). The results of this study demonstrate that taking advantage of electronic health record (EHR) systems may be among the “best value for money” strategies currently tested for pediatric obesity treatment.

A child and doctor smiling“It is clear that the most cost-effective strategies for preventing new cases of obesity are population-level approaches like taxes and school-based policies,” said Mona Sharifi, lead author and Assistant Professor of Pediatrics at the Yale School of Medicine. “However, we need additional and different strategies to support the approximately 12 million children who already have obesity and are at highest risk for health complications and obesity in adulthood. Our study suggests that using the electronic health record to help primary care pediatricians deliver higher quality care for children with obesity may be relatively low hanging fruit among clinical interventions in terms of cost-effectiveness.”

The Study of Technology to Accelerate Research (STAR)1 involved modifications to existing EHR systems to facilitate childhood obesity management in pediatric primary care by prompting diagnosis as well as providing decision support and electronic resources for evaluation, management, and follow-up care. Evidence obtained in a cluster randomized controlled trial showed that STAR helped to prevent excess weight gain compared to usual care.

The CHOICES study of STAR offers an opportunity to both inform clinicians and policymakers about what investment would be required to adopt STAR in pediatric practices across the country and evaluate the cost-effectiveness and population impact of the intervention, if implemented nationally over 10 years from 2015-2025. Some of the key outcomes include:

  • Cases of obesity averted in 2025: 43,000
  • Life-years with obesity averted (2015-2025): 226,000
  • Cost per BMI unit reduced: $237
  • Mean BMI unit reduction: -0.5
  • 10-year reach: 2 million
  • Total health care costs saved (over 10 years): $64 million
  • 10-year net cost (the cost of implementation minus the health care cost saved): $175 million
  • Cost per child: $119

As more pediatric practices adopt fully functional EHRs (fueled by federal goals and incentives), the results indicate even greater reach and population health benefits, even if implementation is limited to large practices.

Overall, there is evidence that STAR can reduce the prevalence of childhood obesity by focusing on high-risk children, providing electronic decision support for pediatricians, and supplying self-guided behavior change strategies for parents to utilize outside of the clinical setting. Limited cost effectiveness information on other similar clinical interventions indicates that STAR is likely to have a higher magnitude of effect on improving children’s health at a lower cost per child.

STAR is one of 13 interventions that have been evaluated using CHOICES methods. While many strategies focused on preventing childhood obesity are more cost-effective than STAR, the projected impact of the STAR intervention on the prevalence of obesity is high and intervention costs are low when compared with other clinical interventions focused on treatment of obesity, such as bariatric surgery.

References:

  • Taveras EM, Marshall R, Kleinman KP, et al. Comparative effectiveness of childhood obesity interventions in pediatric primary care: A cluster-randomized clinical trial. (link: https://www.ncbi.nlm.nih.gov/pubmed/25895016) JAMA Pediatr. 2015;169(6):535-542.

← Back to Resources

Using Cost-Effectiveness Analysis to Prioritize Policy and Programmatic Approaches to Physical Activity Promotion and Obesity Prevention in Childhood

A CHOICES study found that six interventions in school, afterschool, and childcare settings in the U.S. could increase physical activity among children and adolescents and also prevent cases of childhood obesity.

Cradock AL, Barrett JL, Kenney EL, Giles CM, Ward ZJ, Long MW, Resch SC, Pipito AA, Wei ER, Gortmaker SL. Using cost-effectiveness analysis to prioritize policy and programmatic approaches to physical activity promotion and obesity prevention in childhood. Prev Med. 2017 Feb;95 Suppl:S17-S27. doi: 10.1016/j.ypmed.2016.10.017

Children running outsideThough national guidelines from the U.S. Department of Health and Human Services (2008) recommend that both children and adolescents participate in 60 minutes or more of moderate to vigorous physical activity (MVPA) per day, many in this age group throughout the U.S. do not meet this standard. A variety of interventions can increase physical activity among youth, but implementation can be challenging for decision makers who have limited resources and implementation guidance.

The Childhood Obesity Intervention Cost Effectiveness Study (CHOICES) study team identified six physical activity interventions via a systematic review process to project the ten-year population reach, health impact, implementation cost, and health care cost savings of national implementation of each strategy. The six interventions analyzed for cost-effectiveness included:

  • Active Physical Education (Active PE): Focuses on making the time that children spend in PE class more active
  • Active Recess: Focuses on making the time that children spend in school recess periods more active
  • Active School Day: Centers on the integration of strategies to increase physical activity during the school day via Active PE, Active Recess, and movement breaks within the classroom
  • Healthy Afterschool: Focuses on improving physical activity, nutrition, and screen time practices and policies in existing afterschool programs
  • New Afterschool Programs: Centers on creating afterschool programs that include time for physical activity and nutritious snacks for children who otherwise would not attend afterschool programs
  • Hip Hop to Health, Jr.: Focuses on providing structured physical activity in early childcare settings

For all six physical activity-increasing interventions, both cost-effectiveness and obesity impact were modeled. When compared to a base case of no intervention, all six interventions in school, afterschool, and childcare settings are expected to result in significant health care cost savings and reduced cases of childhood obesity in 2025. The main highlights of the study included that:

  • All interventions would increase youth physical activity levels (0.05 to 1.29 MET-hour/day).
  • The cost per MET-hour change/day ranged from cost-saving to $3.14.
  • The interventions could prevent between 2500 and 110,000 cases of children with obesity.

The analysis of these six interventions can provide valuable information to decision-makers on different strategies within structured settings where children spend a lot of time to guide them to the best value for their investment. It can also serve as an impetus for prioritizing the need for improved physical activity interventions and childhood obesity prevention strategies in school, afterschool, and childcare settings.

← Back to Resources

State-Level Estimates of Childhood Obesity Prevalence in the United States Corrected for Report Bias

Long MW, Ward ZJ, Resch SC, Cradock AL, Wang YC, Giles CM, Gortmaker SL. State-level estimates of childhood obesity prevalence in the United States corrected for report bias. Int J Obes (Lond). Epub 2016 Jul 27.

Abstract

Background/objectives

State-specific obesity prevalence data are critical to public health efforts to address the childhood obesity epidemic. However, few states administer objectively measured body mass index (BMI) surveillance programs. This study reports state-specific childhood obesity prevalence by age and sex correcting for parent-reported child height and weight bias.

Subjects/methods

As part of the Childhood Obesity Intervention Cost Effectiveness Study (CHOICES), we developed childhood obesity prevalence estimates for states for the period 2005-2010 using data from the 2010 US Census and American Community Survey (ACS), 2003-2004 and 2007-2008 National Survey of Children’s Health (NSCH) (n=133 213), and 2005-2010 National Health and Nutrition Examination Surveys (NHANES) (n=9377; ages 2-17). Measured height and weight data from NHANES were used to correct parent-report bias in NSCH using a non-parametric statistical matching algorithm. Model estimates were validated against surveillance data from five states (AR, FL, MA, PA and TN) that conduct censuses of children across a range of grades.

Results

Parent-reported height and weight resulted in the largest overestimation of childhood obesity in males ages 2-5 years (NSCH: 42.36% vs NHANES: 11.44%). The CHOICES model estimates for this group (12.81%) and for all age and sex categories were not statistically different from NHANES. Our modeled obesity prevalence aligned closely with measured data from five validation states, with a 0.64 percentage point mean difference (range: 0.23-1.39) and a high correlation coefficient (r=0.96, P=0.009). Estimated state-specific childhood obesity prevalence ranged from 11.0 to 20.4%.

Conclusion

Uncorrected estimates of childhood obesity prevalence from NSCH vary widely from measured national data, from a 278% overestimate among males aged 2-5 years to a 44% underestimate among females aged 14-17 years. This study demonstrates the validity of the CHOICES matching methods to correct the bias of parent-reported BMI data and highlights the need for public release of more recent data from the 2011 to 2012 NSCH.

← Back to Resources


U.S. States’ Childhood Obesity Surveillance Practices and Recommendations for Improving Them, 2014–2015

Blondin KJ, Giles CM, Cradock AL, Gortmaker SL, Long MW. US States’ Childhood Obesity Surveillance Practices and Recommendations for Improving Them, 2014–2015. Prev Chronic Dis. 2016;13:160060.

Abstract

Introduction

Routine collection, analysis, and reporting of data on child height, weight, and body mass index (BMI), particularly at the state and local levels, are needed to monitor the childhood obesity epidemic, plan intervention strategies, and evaluate the impact of interventions. Child BMI surveillance systems operated by the US government do not provide state or local data on children across a range of ages. The objective of this study was to describe the extent to which state governments conduct child BMI surveillance.

Methods

From August through December 2014, we conducted a structured telephone survey with state government administrators to learn about state surveillance of child BMI. We also searched websites of state health and education agencies for information about state surveillance.

Results

State agency administrators in 48 states and Washington, DC, completed telephone interviews (96% response rate). Based on our interviews and Internet research, we determined that 14 states collect child BMI data in a manner consistent with standard definitions of public health surveillance.

Conclusion

The absence of child BMI surveillance systems in most states limits the ability of public health practitioners and policymakers to develop and evaluate responses to the childhood obesity epidemic. Greater investment in surveillance is needed to identify the most effective and cost-effective childhood obesity interventions.

← Back to Resources

New Strategies to Prioritize Nutrition, Physical Activity, and Obesity Interventions

Dietz WH, Gortmaker SL. New Strategies to Prioritize Nutrition, Physical Activity, and Obesity Interventions. Am J Prev Med. 2016 Apr 26. pii: S0749-3797(16)30069-1.

Abstract

Interventions for obesity have not often been based on considerations that could predict their effectiveness. However, advances in research provide several new approaches that can inform priorities for public health interventions directed at nutrition, physical activity, and obesity. These approaches include estimation of the effect size, comparison of the calorie gap with the caloric deficit induced by the intervention, population reach and impact, cost and cost effectiveness of the intervention, time required to evaluate the effect of the intervention on weight change, and feasibility of the intervention. Incorporation of these considerations by policymakers and public health practitioners will help identify those interventions most likely to achieve changes in the prevalence of obesity.
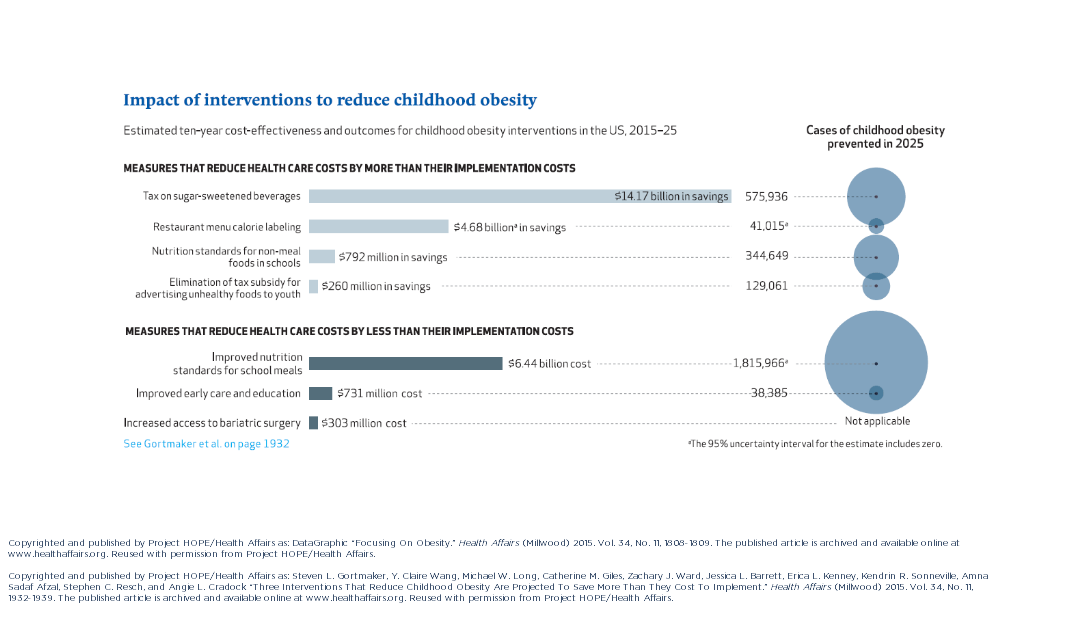
Redrawing the US Obesity Landscape: Bias-Corrected Estimates of State-Specific Adult Obesity Prevalence

A CHOICES paper reveals that adult obesity rates in the United States are higher than previously reported by the CDC.

Ward ZJ, Long MW, Resch SC, Gortmaker SL, Cradock AL, Giles C, Hsiao A, Wang YC. Redrawing the US Obesity Landscape: Bias-Corrected Estimates of State-Specific Adult Obesity Prevalence. PLoS ONE. 2016 Mar 8;11(3):e0150735.

Fig 1. described in the article

[Fig 1.] Prevalence of adult obesity (BMI ≥ 30) by state in 2013: Uncorrected vs. Corrected.


Adult overweight and obesity are among the leading causes of morbidity and mortality in the United States—a problem depicted in the Centers for Disease Control and Prevention’s (CDC) well-known obesity maps. However these figures—which have galvanized state leaders to take action, and have been used to prioritize federal obesity prevention resources—may substantially underestimate the true state-level burden. The data behind these maps rely on self-reported height and weight collected through telephone surveys, yet bias in self-reported measures is well documented and results in underestimates of body mass index (BMI). The CHOICES Project, which created a novel method to correct for this bias, found that as many as 12 million adults with obesity (including 6.7 million with severe obesity) were misclassified by CDC state-level estimates.

“Accurate estimates of state-level obesity are necessary to plan for resources to address this epidemic,” said Zachary Ward, lead author and programmer/analyst in the Center for Health Decision Science at the Harvard T.H. Chan School of Public Health. “Our corrected state-level estimates provide decision makers with a more solid foundation of data on which to base obesity prevention policies.”

Fig 2. described in the article

[Fig 2.] Prevalence of adult severe obesity (BMI ≥ 35) by state in 2013: Uncorrected vs. Corrected.

A closer look at specific states reveals some striking findings. In the adjusted data [Fig. 1], obesity prevalence was below 30 percent in only four states (California, Colorado, Hawaii, and Massachusetts), whereas the CDC maps show most states below this level. Another key finding is that in four states (Arkansas, Mississippi, Tennessee, and West Virginia), the estimated obesity prevalence was over 40 percent—a category not included in any previous CDC data. Also not seen in the existing maps is the prevalence of severe obesity greater than 17.5 percent, now apparent in Alabama, Mississippi, and West Virginia [Fig. 2].

Further, the economic implications of under-counting millions of cases of obesity are large. Assuming incremental obesity-related healthcare costs of $1,000 per individual, under-counting the total 12 million cases of obesity would result in underestimating obesity-related healthcare costs by $12 billion.

These revised maps highlight the need for improved resources to both track and prevent obesity. It is important to note that the Behavioral Risk Factor Surveillance System, on which the CDC maps are based, is the only national BMI surveillance strategy currently in place for gathering state-specific information. These data are crucial, and are what allowed for the adjustments used in this study. Accurate state-specific obesity estimates are necessary to help officials plan appropriately for the medical capacity and economic resources needed to address this epidemic, and institute preventive measures where they are needed most.

← Back to Resources

Three Interventions That Reduce Childhood Obesity Are Projected to Save More Than They Cost to Implement

A CHOICES paper identifying cost-effective nutrition interventions with broad population reach highlights the importance of primary prevention for policy makers aiming to reduce childhood obesity.

Gortmaker SL, Claire Wang Y, Long MW, Giles CM, Ward ZJ, Barrett JL, Kenney EL, Sonneville KR, Afzal AS, Resch SC, Cradock AL. Three Interventions That Reduce Childhood Obesity Are Projected to Save More Than They Cost to Implement. Health Aff, 34, no. 11 (2015):1304-1311.

Graph of impact of interventions outlined in article

Reused with permission from Project HOPE/Health Affairs. The published article is archived and available online at www.healthaffairs.org.

The United States will not be able to treat its way out of the obesity epidemic with current clinical practice. Instead, reversing the tide of obesity will require expanded investment in primary prevention, focusing on a combination of interventions with broad population reach, proven individual effectiveness, and low cost of implementation.

This study is the first of its kind to estimate the cost effectiveness of a wide variety of nutrition interventions high on the obesity policy agenda—documenting their potential reach, comparative effectiveness, implementation cost, and cost-effectiveness. Researchers identified three interventions that would more than pay for themselves by reducing healthcare costs related to obesity: an excise tax on sugar-sweetened beverages; elimination of the tax subsidy for advertising unhealthy food to children; and nutrition standards for food and drinks sold in schools outside of school meals. Implemented nationally, these interventions would prevent 576,000, 129,100, and 345,000 cases of childhood obesity, respectively, in 2025. The projected net savings to society in obesity-related health care costs for each dollar spent would be $30.78, $32.53, and $4.56, respectively.

Additional interventions modeled include restaurant menu calorie labeling, increased access to adolescent bariatric surgery, improved early care and education, and nutrition standards for school meals. The study points out that the improvements in nutrition standards for both school meals and foods and beverages sold outside of meals through current Smart Snacks in School regulation make the Healthy, Hunger-Free Kids Act of 2010 one of the most important national obesity prevention policy achievements in recent decades.

Though researchers analyzed interventions separately, no strategy on its own would be sufficient to reverse the obesity epidemic. The study also emphasizes the importance of obesity prevention that spans across multiple settings throughout the life course. While childhood interventions are necessary to reduce obesity during the early years of life and ensure that children enter into adulthood at a healthy weight, it is critical that environments spanning the life course continue to support healthy eating and drinking behaviors.

“Policy makers looking to reverse the childhood obesity epidemic and reduce long-term obesity prevalence need to focus on implementing cost-effective preventive interventions that reach a large percentage of our nation’s children,” says lead investigator of the CHOICES Project, Dr. Steve Gortmaker, who also serves as a Professor of the Practice of Health Sociology and the Director of the Prevention Research Center on Nutrition and Physical Activity at the Harvard T.H. Chan School of Public Health.

The study notes that interventions affecting both children and adults are particularly attractive, since near-term health care cost savings can be achieved by reducing adult obesity, while laying the ground work for long-term cost savings by reducing childhood obesity. The sugar-sweetened beverage excise tax, for example, would save $14.2 billion in net costs over the course of the decade, primarily due to reductions in adult health care costs.

Interventions that can achieve near-term health cost savings among adults and reduce childhood obesity offer policy makers an opportunity to make long-term investments in children’s health while generating short-term returns.

← Back to Resources

Severe Obesity In Adults Cost State Medicaid Programs Nearly $8 Billion In 2013

Wang YC, Pamplin J, Long MW, Ward ZJ, Gortmaker SL, Andreyeva T. Severe Obesity In Adults Cost State Medicaid Programs Nearly $8 Billion In 2013. Health Aff, 34, no. 11 (2015):1923-31.

Abstract

Efforts to expand Medicaid while controlling spending must be informed by a deeper understanding of the extent to which the high medical costs associated with severe obesity (having a body mass index of [Formula: see text] or higher) determine spending at the state level. Our analysis of population-representative data indicates that in 2013, severe obesity cost the nation approximately $69 billion, which accounted for 60 percent of total obesity-related costs. Approximately 11 percent of the cost of severe obesity was paid for by Medicaid, 30 percent by Medicare and other federal health programs, 27 percent by private health plans, and 30 percent out of pocket. Overall, severe obesity cost state Medicaid programs almost $8 billion a year, ranging from $5 million in Wyoming to $1.3 billion in California. These costs are likely to increase following Medicaid expansion and enhanced coverage of weight loss therapies in the form of nutrition consultation, drug therapy, and bariatric surgery. Ensuring and expanding Medicaid-eligible populations’ access to cost-effective treatment for severe obesity should be part of each state’s strategy to mitigate rising obesity-related health care costs.

Keywords: Epidemiology; Health Promotion/Disease Prevention; Medicaid; Public Health.

← Back to Resources