Resource Type: Peer-Reviewed Publications

Impact Of The Healthy, Hunger-Free Kids Act On Obesity Trends

Kids eating healthy food at lunch time

A CHOICES study examined the impact of the Healthy, Hunger-Free Kids Act of 2010 on child obesity risk, and found that policies that strengthen nutritional standards for meals and beverages at schools may be effective tools for reducing obesity among children living in poverty.

Kenney EL, Barrett JL, Bleich SN, Ward ZJ, Cradock AL, Gortmaker SL. Impact Of The Healthy, Hunger-Free Kids Act On Obesity Trends. Health Aff. 2020;39(7). doi:10.1377/hlthaff.2020.00133

Children eating lunch in a classroom.

The study’s research team, led by Erica Kenney, examined the impact of the Healthy, Hunger-Free Kids Act of 2010 on child obesity risk. The legislation strengthened nutritional standards for meals and beverages provided through the National School Lunch, Breakfast, and Smart Snacks programs. The Act’s whole grain standards were relaxed under the Trump administration, but this change was struck down in federal court. Additional rollbacks of the Act’s standards have been proposed.

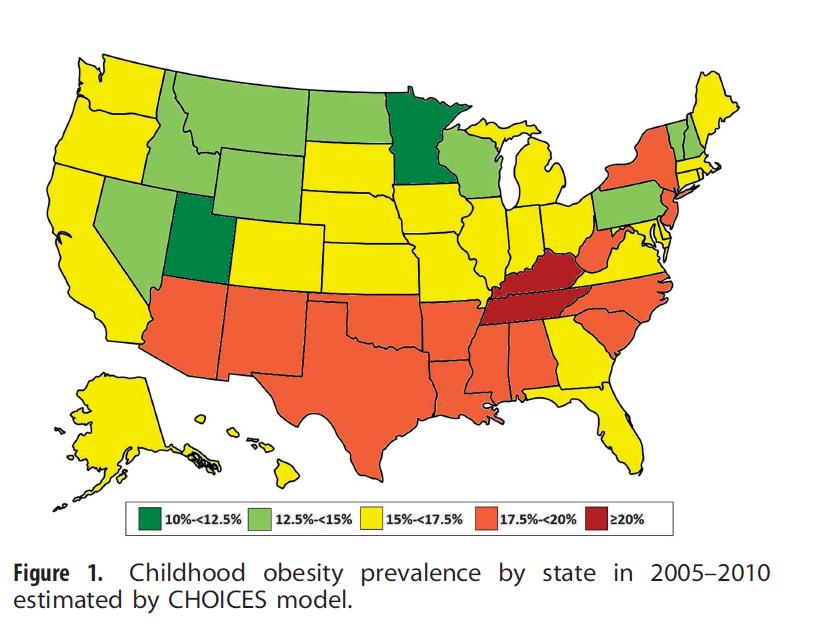
The researchers reviewed data for 173,013 youths taken from the National Survey of Children’s Health from 2003–2018, prior to when rollbacks went into effect.

While they found no significant association between the legislation and childhood obesity trends overall, they did find significant reductions in obesity risk among children living in poverty—a population that is particularly reliant on school meals. Among these children, the risk of obesity, which had been trending steadily upwards prior to the legislation going into effect, declined substantially each year following the act’s implementation, translating to a 47% reduction in obesity prevalence in 2018 from what would have been expected without the legislation.

The researchers conclude that the Healthy, Hunger-Free Kids Act’s science-based nutritional standards should be maintained to support healthy growth, especially among children living in poverty. They also suggest that policymakers consider strategies to increase participation in school meals programs.

“Based on our study, as well as research that USDA and other researchers have conducted showing improvements in diet, the improved school meals standards have been a great public health success story,” said first author Kenney. “These healthier school meals are helping to protect the health of the children who have been placed at highest risk for poor health, and they reduce hunger while also reducing their risk of chronic diseases later in life.”

← Back to Resources

Projected U.S. State-Level Prevalence of Adult Obesity and Severe Obesity

A CHOICES study finds that about half of the adult U.S. population will have obesity and about a quarter will have severe obesity by 2030. Severe obesity—once a rare condition—is projected to be the most common BMI category in 10 states and in some demographic subgroups.

Ward ZJ, Bleich SN, Cradock AL, Barrett JL, Giles CM, Flax CN, Long MW, Gortmaker SL. Projected U.S. State-Level Prevalence of Adult Obesity and Severe Obesity. N Engl J Med. 2019;381:2440-50. doi: 10.1056/NEJMsa1909301

Key resources


According to this CHOICES study, about half of the adult U.S. population will have obesity and about a quarter will have severe obesity by 2030. The study also predicts that in 29 states, more than half of the population will have obesity, and all states will have a prevalence of obesity higher than 35%. The study’s researchers estimate that, currently, 40% of American adults have obesity and 18% have severe obesity.Based on current trends, our projections show that the prevalence of overall obesity (BMI, ≥30) will rise above 50% in 29 states by 2030 and will not be below 35% in any state.

The researchers said the predictions are troubling because the health and economic effects of obesity and severe obesity take a toll on several aspects of society.

“Obesity, and especially severe obesity, are associated with increased rates of chronic disease and medical spending, and have negative consequences for life expectancy,” said Steven Gortmaker, Professor of the Practice of Health Sociology at the Harvard T.H. Chan School of Public Health and senior author of the study.

For the study, the researchers used self-reported body mass index (BMI) data from more than 6.2 million adults who participated in the Behavioral Risk Factor Surveillance System Survey (BRFSS) between 1993 and 2016. Body mass index (BMI) is calculated by dividing a person’s weight in kilograms by the square of their height in meters. Obesity is defined as a BMI of 30 or higher, and severe obesity is a BMI of 35 or higher. Self-reported BMIs are frequently biased, so the researchers used novel statistical methods to correct for this bias.

The large amount of data collected in the BRFSS allowed the researchers to drill down for obesity rates for specific states, income levels, and sub-populations. The results showed that by 2030, several states will have obesity prevalence close to 60%, while the lowest states will be approaching 40%. The researchers predicted that nationally, severe obesity will likely be the most common BMI category for women, non-Hispanic black adults, and those with annual incomes below $50,000 per year.

“The high projected prevalence of severe obesity among low-income adults has substantial implications for future Medicaid costs,” said lead author Zachary Ward, Programmer/Analyst at the Harvard T.H. Chan School of Public Health’s Center for Health Decision Science. “In addition, the effect of weight stigma could have far-reaching implications for socioeconomic disparities as severe obesity becomes the most common BMI category among low-income adults in nearly every state.”

Ward and his co-authors said that the study could help inform state policy makers. For example, previous research suggests that sugary drink taxes have been an effective and cost-effective strategy for curtailing the rise in obesity rates. “Prevention is going to be key to better managing this epidemic,” said Ward.


Resources


Animated Map GIFs


Based on current trends, our projections show that the prevalence of overall obesity (BMI, ≥30) will rise above 50% in 29 states by 2030 and will not be below 35% in any state.


We project that the prevalence of severe obesity (BMI, ≥35) will rise above 25% in 25 states


State-Level Trends in Obesity with Zach Ward

Lead author Zach Ward discusses the paper with the Center for Health Decision Science.

← Back to Resources

Cost-Effectiveness of Water Promotion Strategies in Schools

A CHOICES study found that installing chilled water dispensers on school lunch lines could be a relatively low-cost strategy to help children drink more water and prevent future cases of childhood obesity.

Kenney EL, Cradock AL, Long MW, Barrett JL, Giles CM, Ward ZJ, Gortmaker SL. Cost-Effectiveness of Water Promotion Strategies in Schools for Preventing Childhood Obesity and Increasing Water Intake. Obesity. 2019 Dec. doi:10.1002/oby.22615.

Increasing access to and promotion of drinking water in schools could help improve child health in a number of ways, including better hydration, improved cognition, and healthier teeth, if the water is fluoridated. However, there is limited evidence on how promoting water in schools could reduce childhood obesity and the costs of strategies that could facilitate such promotion.

The authors of this study sought to estimate the cost-effectiveness of installing chilled water dispensers (known as “water jets”) on school lunch lines and how it could impact childhood obesity. In addition, they compared key findings about water jets with three other national water promotion strategies to understand the costs of different approaches and their impacts on water consumption. The team selected the three other strategies because of existing evidence linking them to increased water intake.

To facilitate this study, the team used the CHOICES microsimulation model to estimate over a ten-year time frame the impact of each of the four strategies on children in kindergarten through eighth grade attending schools that participate in the National School Lunch Program (NSLP). The team analyzed all four strategies – Grab a Cup, Fill It Up (an intervention where signage and disposable cups are placed next to existing water fountains), portable water dispensers, bottle-less water coolers, and water jets – to assess their cost-effectiveness and impact on water intake. They also estimated how water jets could impact the number of cases of childhood obesity in 2025.

Key findings from the study included:

  • Water jets would cost $4.25 per child in the first year
  • Water jets could prevent nearly 180,000 cases of childhood obesity in the year 2025
  • Over ten years, water jets could save nearly $390 million in health care costs nationally
  • In the first year, children reached by water jets would increase their water intake by 1.43 ounces per day
  • While Grab a Cup, Fill it Up was the least costly – totaling about $122 million in costs over 10 years – it also had the lowest impact on water intake

Making water jets available for students on school lunch lines could save almost half of the money required to install these dispensers, and could positively impact child health. Interventions that promote drinking water are lower-cost solutions to consider adding to the toolkit of public health school-based strategies to reduce obesity risk.

← Back to Resources

Cost-Effectiveness Analysis & Stakeholder Evaluation of 2 Obesity Prevention Policies in Maine, US

The CHOICES team partnered with the Maine-Harvard Prevention Research Center and the Maine Obesity Policy Committee to evaluate two state-level obesity prevention strategies– a sugar-sweetened beverage (SSB) excise tax and a policy removing SSBs as SNAP-eligible products. Both policies were estimated to save society more than they cost to implement. However, the SNAP restriction raised greater equity concerns among stakeholders.

Long MW, Polacsek M, Bruno P, Giles CM, Ward ZJ, Cradock AL, Gortmaker SL. Cost-Effectiveness Analysis and Stakeholder Evaluation of 2 Obesity Prevention Policies in Maine, US. J Nutr Educ Behav. 2019 Aug [Epub ahead of print], pii: S1499-4046(19)30922-4.

Obesity prevention is a priority item for many policymakers at the state level. The goal of this study was to not only predict the health impact of two obesity prevention policies in Maine, but also to gauge stakeholder interest and level of support for these policies.

Two obesity prevention policies were focused on:

– A $0.01/ounce sugar-sweetened beverage (SSB) excise tax for the state of Maine
– A Supplemental Nutrition Assistance Program (SNAP) policy that would not allow SSBs to be bought using SNAP money (SNAP SSB restriction policy)

The stakeholder engagement process developed over more than 10 years as a result of a relationship between the Maine Obesity Policy Committee (Maine OPC) and the Maine-Harvard Prevention Research Center (MHPRC). The Maine OPC consists of individuals from the Maine Public Health Association, American Heart Association of Maine, American Cancer Society, the State Department of Health and Human Services, legislators, lobbyists, and health systems. The stakeholder interview process was conducted in two phases: Phase 1 in 2013 focused on an SSB excise tax and Phase 2 in 2016 focused on a SNAP SSB restriction policy.

The study authors also measured the health impact of these two policies on a virtual population that was developed for the state of Maine. The CHOICES model was used to project these policies’ impact on obesity prevalence and health care costs over 10 years (2017-2027).

The results from the CHOICES model showed the potential for both health improvement and cost-savings. In particular:

Metric*

$0.01/ounce SSB excise tax

SNAP SSB restriction policy

Health care cost savings
$78.3 million $15.3 million
Quality-adjusted life years (QALYs) saved
3,560 749

*For metric definitions, please visit the CHOICES Modeled Outputs Glossary

Study authors noted mixed levels of support for each policy by Maine stakeholders, with less support for the SNAP SSB restriction policy. Opposition to the SNAP restriction policy was based on concern that SNAP recipients were being unfairly targeted and stigmatized. This study used strategic science thinking to inform obesity prevention policy in Maine by strengthening the capacity of existing stakeholder groups and local applied researchers to integrate advanced cost-effectiveness modeling into their already well-developed policy input process. Results of the modeling were presented to the state’s legislature, which was holding hearings on a proposed SSB tax. This study points to the need for stronger, long-term partnerships between local public health researchers, cost-effectiveness modeling groups, and local policy stakeholder groups.

← Back to Resources

WIC Food Package Changes: Trends in Childhood Obesity Prevalence

A CHOICES study analyzed changes in childhood obesity prevalence among children participating in WIC both before and after food package changes were enacted in 2009, and found that obesity prevalence among children participating in WIC has been decreasing since the 2009 changes.

Daepp MIG, Gortmaker SL, Wang YC, Long MW, Kenney EL. WIC Food Package Changes: Trends in Childhood Obesity Prevalence. Pediatrics. 2019;143(5):e20182841.

The aim of this study was to evaluate if the changes made to the foods that could be purchased through the U.S. Special Supplemental Nutrition Program for Women, Infants, and Children (WIC) in 2009 had an impact on childhood obesity.

In 2009, the lists of foods that could be purchased with WIC vouchers (known as the WIC food packages), which includes basic food categories, were updated to better align with the Dietary Guidelines for Americans. The new package, still in use today, provided extra cash allowances for fruits and vegetables, cut the previous juice allowance in half, required low-fat or skim milk for 2-4 year olds, reduces cheese, and required whole-grain instead of refined-grain products (among other changes).

Earlier studies showed that this shift had resulted in significant changes in WIC participants’ diets and in lowering the amount of calories they consumed. The Centers for Disease Control showed that there had been some declines in childhood obesity prevalence among WIC participants in recent years.1 However, there had not yet been a direct test of whether the WIC package change may have catalyzed a turn-around in childhood obesity rates among WIC participants.

Using state-specific obesity prevalence data for 2-4 year olds participating in WIC from 2000 to 2014, the researchers estimated the annual trend in obesity prevalence across states, and then tested whether that trend significantly changed after the WIC package revision in 2009, adjusting for changes in demographics.

The researchers found that, before the 2009 WIC food package change, the prevalence of obesity across states among 2-4 year olds participating in WIC was growing 0.23 percentage points annually. However, after 2009, this alarming trend switched direction. Instead, the prevalence of obesity across states among 2-4 year olds participating in WIC started decreasing by 0.34 percentage points annually.

“Our study suggests that, in addition to its critical role in reducing the burden of food insecurity and improving nutrition among young children in low-income families, WIC also can help promote healthy weight,” says co-author Erica Kenney, CHOICES Co-Investigator and Professor of Public Health Policy in the Department of Health Policy and Management at the Harvard T.H. Chan School of Public Health. “This is especially encouraging given that over half of all infants born in the U.S. are eligible for the program – there is a real opportunity here to have a positive impact on childhood obesity.”

These results suggest that the 2009 WIC food package change likely helped to reverse the rapid increase in obesity prevalence among WIC participants observed before the food package change, helping set the millions of young children who benefit from WIC on a path toward a healthier weight.


References

  1. Pan L, Freedman DS, Sharma AJ, Castellanos-Brown K, Park S, Smith RB, Blanck HM. Trends in Obesity Among Participants Aged 2-4 Years in the Special Supplemental Nutrition Program for Women, Infants, and Children – United States, 2000-2014. MMWR Morb Mortal Wkly Rep. 2016 Nov 18;65(45):1256-1260. doi: 10.15585/mmwr.mm6545a2

← Back to Resources

Simulation of Growth Trajectories of Childhood Obesity into Adulthood

A CHOICES study finds that the obesity epidemic is far from over and is likely to become much worse, as study results predict that 57% of today’s children will have obesity at age 35. Public health professionals need to re-double their efforts to prevent such an outcome. The CHOICES Project has identified cost-effective interventions in school and community settings that can prevent future obesity cases.

Ward Z, Long M, Resch S, Giles C, Cradock A, Gortmaker S. Simulation of Growth Trajectories of Childhood Obesity into Adulthood. N Engl J Med. 2017 Nov 30;377(22):2145-2153.

The current childhood obesity epidemic has been well-documented, but more research is needed on the long-term risks for children. For this study, the researchers developed an individual-level simulation model for the current population of children in the U.S. that estimates the risk of adult obesity at age 35 years. Height and weight data were gathered from 5 nationally-representative longitudinal studies. The model, representative of the U.S. population in 2016, created 1,000 virtual populations of 1 million children each. Using this model with these virtual populations, obesity risk trajectories were projected up to the age of 35 years.CHOICES model projecting obesity risk up to the age of 35 years. The majority of today's children will have obesity at age 35. Predicated prevalence of obesity among 2-year-olds at future ages. Age 2: 9%. Age 5: 12%. Age 10: 26%. Age 15: 26%. Age 20: 32%. Age 25: 46%. Age 30: 55%. Age 35: 59%. Projections show that 59% of today's 2-year-olds will have obesity when they are 35.

The researchers predict that, if nothing is done to change current trends, 57% of today’s children will have obesity at age 35. This is a large increase, given that 37% of adults now have obesity. In addition, the study found that excess weight in childhood is highly predictive of adult obesity. This is especially true for children with severe obesity, even at very young ages. The team estimated that 79% of two year-olds with severe obesity will still have obesity by the time they are 35 years old, as will 94% of 19 year-olds with severe obesity. Racial and ethnic disparities in obesity are already present by the age of two and persist into adulthood.

The results of this study reinforce some important public health messages.

“We find that obesity will be a significant problem for most children in the U.S. as they grow older,” said Zachary Ward, lead author on the study. “Given their increased risk of adult obesity, it seems clear that children who already have obesity are prime candidates for early intervention. However, even children currently at a healthy weight can benefit from preventive interventions, given the high risk of developing obesity in young adulthood.”

The team also noted that the findings of this study highlight the importance of promoting a healthy weight throughout childhood and into adulthood.

Given the high risk posed to children – especially those who already have obesity – public health professionals need to work to identify and implement effective strategies that focus on preventive interventions for all children. In previous work, the CHOICES team has identified a number of cost-effective interventions that with broad population reach. Such interventions focus on preventing excess weight gain starting at an early age by providing opportunities for healthier foods, beverages, and physical activity, such as within early care and education and school settings. Some of these interventions are projected to save more in future health care costs than they cost to implement.


See our news story for the full list of media coverage of this article.


Forecasting Trends in Child Obesity with Zach Ward

Lead author Zach Ward discusses the paper with the Center for Health Decision Science.

Forecasting Trends in Child Obesity with Zach Ward from CHDS Media Hub on Vimeo.

← Back to Resources

Cost-Effectiveness of a Clinical Childhood Obesity Intervention

A CHOICES study estimates that the national implementation of an intervention focused on electronic health record (EHR)-based decision support for primary care providers and self-guided behavior change support for parents is likely a more cost-effective approach to treating children with obesity than previous clinical interventions reporting cost information.

Sharifi M, Franz C, Horan CM, Giles C, Long M, Ward Z, Resch S, Marshall R, Gortmaker S, Taveras E. Cost-Effectiveness of a Clinical Childhood Obesity Intervention. Pediatrics. 2017; 140(5):e20162998.

Over 12 million children and adolescents in the United States have obesity (17% of the population). The results of this study demonstrate that taking advantage of electronic health record (EHR) systems may be among the “best value for money” strategies currently tested for pediatric obesity treatment.

A child and doctor smiling“It is clear that the most cost-effective strategies for preventing new cases of obesity are population-level approaches like taxes and school-based policies,” said Mona Sharifi, lead author and Assistant Professor of Pediatrics at the Yale School of Medicine. “However, we need additional and different strategies to support the approximately 12 million children who already have obesity and are at highest risk for health complications and obesity in adulthood. Our study suggests that using the electronic health record to help primary care pediatricians deliver higher quality care for children with obesity may be relatively low hanging fruit among clinical interventions in terms of cost-effectiveness.”

The Study of Technology to Accelerate Research (STAR)1 involved modifications to existing EHR systems to facilitate childhood obesity management in pediatric primary care by prompting diagnosis as well as providing decision support and electronic resources for evaluation, management, and follow-up care. Evidence obtained in a cluster randomized controlled trial showed that STAR helped to prevent excess weight gain compared to usual care.

The CHOICES study of STAR offers an opportunity to both inform clinicians and policymakers about what investment would be required to adopt STAR in pediatric practices across the country and evaluate the cost-effectiveness and population impact of the intervention, if implemented nationally over 10 years from 2015-2025. Some of the key outcomes include:

  • Cases of obesity averted in 2025: 43,000
  • Life-years with obesity averted (2015-2025): 226,000
  • Cost per BMI unit reduced: $237
  • Mean BMI unit reduction: -0.5
  • 10-year reach: 2 million
  • Total health care costs saved (over 10 years): $64 million
  • 10-year net cost (the cost of implementation minus the health care cost saved): $175 million
  • Cost per child: $119

As more pediatric practices adopt fully functional EHRs (fueled by federal goals and incentives), the results indicate even greater reach and population health benefits, even if implementation is limited to large practices.

Overall, there is evidence that STAR can reduce the prevalence of childhood obesity by focusing on high-risk children, providing electronic decision support for pediatricians, and supplying self-guided behavior change strategies for parents to utilize outside of the clinical setting. Limited cost effectiveness information on other similar clinical interventions indicates that STAR is likely to have a higher magnitude of effect on improving children’s health at a lower cost per child.

STAR is one of 13 interventions that have been evaluated using CHOICES methods. While many strategies focused on preventing childhood obesity are more cost-effective than STAR, the projected impact of the STAR intervention on the prevalence of obesity is high and intervention costs are low when compared with other clinical interventions focused on treatment of obesity, such as bariatric surgery.

References:

  • Taveras EM, Marshall R, Kleinman KP, et al. Comparative effectiveness of childhood obesity interventions in pediatric primary care: A cluster-randomized clinical trial. (link: https://www.ncbi.nlm.nih.gov/pubmed/25895016) JAMA Pediatr. 2015;169(6):535-542.

← Back to Resources

Using Cost-Effectiveness Analysis to Prioritize Policy and Programmatic Approaches to Physical Activity Promotion and Obesity Prevention in Childhood

A CHOICES study found that six interventions in school, afterschool, and childcare settings in the U.S. could increase physical activity among children and adolescents and also prevent cases of childhood obesity.

Cradock AL, Barrett JL, Kenney EL, Giles CM, Ward ZJ, Long MW, Resch SC, Pipito AA, Wei ER, Gortmaker SL. Using cost-effectiveness analysis to prioritize policy and programmatic approaches to physical activity promotion and obesity prevention in childhood. Prev Med. 2017 Feb;95 Suppl:S17-S27. doi: 10.1016/j.ypmed.2016.10.017

Children running outsideThough national guidelines from the U.S. Department of Health and Human Services (2008) recommend that both children and adolescents participate in 60 minutes or more of moderate to vigorous physical activity (MVPA) per day, many in this age group throughout the U.S. do not meet this standard. A variety of interventions can increase physical activity among youth, but implementation can be challenging for decision makers who have limited resources and implementation guidance.

The Childhood Obesity Intervention Cost Effectiveness Study (CHOICES) study team identified six physical activity interventions via a systematic review process to project the ten-year population reach, health impact, implementation cost, and health care cost savings of national implementation of each strategy. The six interventions analyzed for cost-effectiveness included:

  • Active Physical Education (Active PE): Focuses on making the time that children spend in PE class more active
  • Active Recess: Focuses on making the time that children spend in school recess periods more active
  • Active School Day: Centers on the integration of strategies to increase physical activity during the school day via Active PE, Active Recess, and movement breaks within the classroom
  • Healthy Afterschool: Focuses on improving physical activity, nutrition, and screen time practices and policies in existing afterschool programs
  • New Afterschool Programs: Centers on creating afterschool programs that include time for physical activity and nutritious snacks for children who otherwise would not attend afterschool programs
  • Hip Hop to Health, Jr.: Focuses on providing structured physical activity in early childcare settings

For all six physical activity-increasing interventions, both cost-effectiveness and obesity impact were modeled. When compared to a base case of no intervention, all six interventions in school, afterschool, and childcare settings are expected to result in significant health care cost savings and reduced cases of childhood obesity in 2025. The main highlights of the study included that:

  • All interventions would increase youth physical activity levels (0.05 to 1.29 MET-hour/day).
  • The cost per MET-hour change/day ranged from cost-saving to $3.14.
  • The interventions could prevent between 2500 and 110,000 cases of children with obesity.

The analysis of these six interventions can provide valuable information to decision-makers on different strategies within structured settings where children spend a lot of time to guide them to the best value for their investment. It can also serve as an impetus for prioritizing the need for improved physical activity interventions and childhood obesity prevention strategies in school, afterschool, and childcare settings.

← Back to Resources

State-Level Estimates of Childhood Obesity Prevalence in the United States Corrected for Report Bias

Long MW, Ward ZJ, Resch SC, Cradock AL, Wang YC, Giles CM, Gortmaker SL. State-level estimates of childhood obesity prevalence in the United States corrected for report bias. Int J Obes (Lond). Epub 2016 Jul 27.

Abstract

Background/objectives

State-specific obesity prevalence data are critical to public health efforts to address the childhood obesity epidemic. However, few states administer objectively measured body mass index (BMI) surveillance programs. This study reports state-specific childhood obesity prevalence by age and sex correcting for parent-reported child height and weight bias.

Subjects/methods

As part of the Childhood Obesity Intervention Cost Effectiveness Study (CHOICES), we developed childhood obesity prevalence estimates for states for the period 2005-2010 using data from the 2010 US Census and American Community Survey (ACS), 2003-2004 and 2007-2008 National Survey of Children’s Health (NSCH) (n=133 213), and 2005-2010 National Health and Nutrition Examination Surveys (NHANES) (n=9377; ages 2-17). Measured height and weight data from NHANES were used to correct parent-report bias in NSCH using a non-parametric statistical matching algorithm. Model estimates were validated against surveillance data from five states (AR, FL, MA, PA and TN) that conduct censuses of children across a range of grades.

Results

Parent-reported height and weight resulted in the largest overestimation of childhood obesity in males ages 2-5 years (NSCH: 42.36% vs NHANES: 11.44%). The CHOICES model estimates for this group (12.81%) and for all age and sex categories were not statistically different from NHANES. Our modeled obesity prevalence aligned closely with measured data from five validation states, with a 0.64 percentage point mean difference (range: 0.23-1.39) and a high correlation coefficient (r=0.96, P=0.009). Estimated state-specific childhood obesity prevalence ranged from 11.0 to 20.4%.

Conclusion

Uncorrected estimates of childhood obesity prevalence from NSCH vary widely from measured national data, from a 278% overestimate among males aged 2-5 years to a 44% underestimate among females aged 14-17 years. This study demonstrates the validity of the CHOICES matching methods to correct the bias of parent-reported BMI data and highlights the need for public release of more recent data from the 2011 to 2012 NSCH.

← Back to Resources


U.S. States’ Childhood Obesity Surveillance Practices and Recommendations for Improving Them, 2014–2015

Blondin KJ, Giles CM, Cradock AL, Gortmaker SL, Long MW. US States’ Childhood Obesity Surveillance Practices and Recommendations for Improving Them, 2014–2015. Prev Chronic Dis. 2016;13:160060.

Abstract

Introduction

Routine collection, analysis, and reporting of data on child height, weight, and body mass index (BMI), particularly at the state and local levels, are needed to monitor the childhood obesity epidemic, plan intervention strategies, and evaluate the impact of interventions. Child BMI surveillance systems operated by the US government do not provide state or local data on children across a range of ages. The objective of this study was to describe the extent to which state governments conduct child BMI surveillance.

Methods

From August through December 2014, we conducted a structured telephone survey with state government administrators to learn about state surveillance of child BMI. We also searched websites of state health and education agencies for information about state surveillance.

Results

State agency administrators in 48 states and Washington, DC, completed telephone interviews (96% response rate). Based on our interviews and Internet research, we determined that 14 states collect child BMI data in a manner consistent with standard definitions of public health surveillance.

Conclusion

The absence of child BMI surveillance systems in most states limits the ability of public health practitioners and policymakers to develop and evaluate responses to the childhood obesity epidemic. Greater investment in surveillance is needed to identify the most effective and cost-effective childhood obesity interventions.

← Back to Resources