The information in this brief is intended only to provide educational information.
This brief summarizes a CHOICES Learning Collaborative Partnership simulation model of a Healthy Incentives Program (HIP) in Harris County, TX that aims to increase fruit and vegetable consumption among Supplemental Nutrition Assistance Program (SNAP) recipients by providing a financial incentive of $0.30 for every $1 spent on fruits and vegetables.
The Issue
Over the past three decades, more and more people have developed obesity.1 The health care costs of treating obesity-related conditions in adulthood were $147 billion in 2008.2 As a strategy to reduce the risk of obesity and chronic disease, public health authorities emphasize the goal of increasing fruit and vegetable intake.3
In Harris County, nearly 69% of adults have too much excess weight.4 Nearly 265,000 adult Harris County residents are eligible for SNAP benefits.5 SNAP is a key strategy for reducing food insecurity among low-income populations. Regardless of SNAP participation, household purchases of fruits and vegetables are low.6 And, compared to eligible nonparticipants, SNAP participants may have a lower diet quality. Interventions may be needed that support the consumption of healthy foods like fruits and vegetables.7 Financial incentives are a proven strategy in increasing fruit and vegetable purchases.8,9
About the Healthy Incentives Program
Under this program, SNAP participants will receive an incentive of $0.30 for every $1 of SNAP benefits that they spend on targeted fruits and vegetables in SNAP-authorized grocery stores and farmers markets. Targeted fruits and vegetables include fresh, canned, frozen, and dried fruits and vegetables without added sugars, fats, oils, or salt, but exclude white potatoes and 100% fruit juice. SNAP participants will be automatically enrolled in the program; then, the incentive will be automatically credited back to the participants’ SNAP account after each household purchase of these products. The incentive will be capped at $60 per household per month to prevent misuse.
Comparing Costs and Outcomes
CHOICES cost-effectiveness analysis compared the costs and outcomes of providing SNAP participants with an incentive of $0.30 for every $1 of SNAP benefits that they spend on targeted fruits and vegetables in SNAP-authorized grocery stores and farmers markets over a 10-year time horizon with the costs and outcomes expected if no incentive is provided.
Implementing a Healthy Incentives Program in Harris County could increase fruit and vegetable purchases and improve health. By the end of 2027: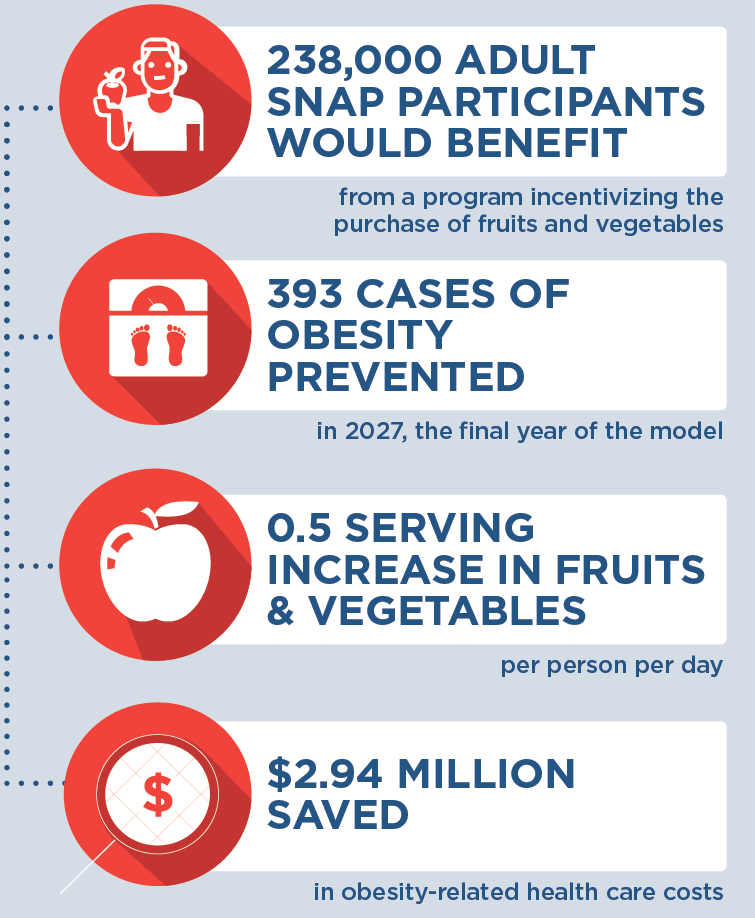 |
Conclusions and Implications
Providing SNAP participants with an incentive of $0.30 for every $1 of SNAP benefits that they spend on targeted fruits and vegetables in SNAP-authorized grocery stores and farmers markets could have a positive impact on health of the SNAP participants. This strategy could increase purchases of fruits and vegetables by more than 3 servings per week per person (a 36% increase)10 and promote better diet quality among participants. While not quantified here, this strategy may also increase fruit and vegetable consumption among children in households participating in SNAP.
A program incentivizing the purchase of fruits and vegetables among SNAP participants would require an investment of $479 per adult. For every $1.00 invested in implementing a Healthy Incentives Program, $0.03 in obesity-related health care costs would be saved. This strategy would prevent 393 cases of obesity in Harris County in 2027. Evidence is growing about how food pricing and incentive programs may help promote healthy diets and reduce the prevalence of obesity. These findings reinforce the importance of investing in preventive efforts that could have widespread community impact.
References
- Flegal, K.M., Kruszon-Moran, D., Carroll, M.D., Fryar, C.D., Ogden, C.L. (2016). Trends in Obesity Among Adults in the United States, 2005 to 2014. JAMA, 315(21), 2284-91.
- Finkelstein EA, Trogdon JG, Cohen JW, Dietz W. (2009). Annual Medical Spending Attributable To Obesity: Payer-And Service-Specific Estimates. Health Affairs. 28(5).
- U.S. Department of Health and Human Services. (2010). Healthy people 2020 (2nd ed.). Washington, DC: U.S. Government Printing Office. U.S. Department of Agriculture and U.S. Department of Health and Human Services. (2010). Dietary guidelines for Americans, 2010 (7th ed.). Washington, DC: U.S. Government Printing Office.
- Texas Department of State Health Services. Texas Behavioral Risk Factor Surveillance System. 2014
- Texas Health and Human Services Commission. (2019)
- Grummon, A., Taillie L. (2017). Nutrition profile of Supplemental Nutrition Assistance Program household food and beverages purchases. Am J Clin Nutr, 105(6). 1433-1442.
- Andreyeva T., Tripp A., Schwartz, M. (2015). Dietary Quality of Americans by Supplemental Nutrition Assistance Program Participation Status: A Systematic Review. Am J Prev Med. 49(4):594-604.
- Sturm R, An R, Segal D, Patel D. (2013). A cash-back rebate program for healthy food purchases in South Africa: results from scanner data. Am J Prev Med. 44(6):567-572.
- Gittelsohn J, Trude ACB, Kim H. Pricing Strategies to Encourage Availability, Purchase, and Consumption of Healthy Foods and Beverages: A Systematic Review. Prev Chronic Dis 2017;14:170213. DOI: https://doi.org/ 10.5888/pcd14.170213.
- Zhang, F. F., Liu, J., Rehm, C. D., Wilde, P., Mande, J. R., & Mozaffarian, D. (2018). Trends and disparities in diet quality among US adults by Supplemental Nutrition Assistance Program participation status. JAMA network open, 1(2), e180237-e180237.
Suggested Citation:Flax C, Barrett J, Cradock A. Houston Healthy Incentives Program within the Supplemental Nutrition Assistance Program in Harris County, TX [Issue Brief]. Houston Health Department, Houston, TX and the CHOICES Learning Collaborative Partnership at the Harvard T.H. Chan School of Public Health, Boston, MA; December 2019. |
This issue brief was developed at the Harvard T.H. Chan School of Public Health in collaboration with the Houston Health Department through participation in the Childhood Obesity Intervention Cost-Effectiveness Study (CHOICES) Learning Collaborative Partnership. This brief is intended for educational use only.