Topic: Health Equity

Coffee Chat: An Action Kit for Prevention: Prioritizing Cost-Effective and Equitable Healthy Eating and Physical Activity Strategies

In this coffee chat hosted by the CHOICES Community of Practice, Dr. Steven Gortmaker, Principal Investigator of the CHOICES Project at the Harvard T.H. Chan School of Public Health, highlights the new features available in the Action Kit 2.0, including more detailed information on costs and health equity impacts. Dr. Gortmaker also discusses how this information can be helpful for planning and prioritization purposes to ensure responsible investments to improve child health, nutrition, physical activity, and health equity.

View the resource round-up from this coffee chat

Download the November 2023 coffee chat presentation slides

← Back to Resources

Exploring the Cost-Effectiveness of Strategies to Improve Child Health in Boston, MA

The information in this brief is intended only to provide educational information.

The CHOICES Project at the Harvard T.H. Chan School of Public Health and the Boston Public Health Commission (BPHC) worked together as part of the Massachusetts-CHOICES Project (2019 – 2024), a training, technical assistance, and modeling initiative, to develop a playbook of strategies to promote healthy weight and advance health equity in addition to studying how cost-effectiveness metrics are used by partners throughout the state.

Methods & Strategies Modeled

CHOICES cost-effectiveness analysis examines: How many and what types of people would be affected by the policy or program? What the effect of the policy or program would be on health? What will be the implementation costs and the potential health care cost savings? How could the policy or program reduce health disparities and improve health equity?CHOICES uses cost-effectiveness analysis to compare the costs and outcomes of different policies and programs promoting improved nutrition or increased physical activity in schools, early care and education and out-of-school settings, communities, and clinics.

Using CHOICES cost-effectiveness analysis and local data, the BPHC team worked with CHOICES to create a virtual population that mirrors the current population of Boston, MA. Then, the teams examined the expected costs, health outcomes, and health care costs saved if the following strategies were implemented in Boston, Massachusetts over a 10-year timeframe (2020-2029):

Reducing Screen Time in Early Child Care Settings
More Movement Program in Early Child Care Settings
Home Visits to Reduce Screen Time
Movement Breaks in the Classroom
Creating Healthier Afterschool Environments (OSNAP)

Reducing Screen Time in Early Child Care Settings

The strategy to reduce screen time in early child care settings involves providing voluntary training to early child care educators and resources to families to limit noneducational television time at child care and home. This strategy could support Boston’s efforts to improve early child care quality through the Boston Healthy Child Care Initiative. It would include training opportunities for early child care educators, offering ongoing support and technical assistance, and providing parents with educational materials that may lead to reducing screen time in young children.1,2

Helping educators to implement practices shown to be effective in reducing television time can help the children in Boston’s early education and care settings engage in fewer minutes of screen time.

Implementing a strategy to reduce screen time in early child care settings is an investment in the future. By the end of 2029: 18,200 children reached over 10 years; 33 fewer minutes of screen time per child per day; $16 per child per year

Additional Key Findings

If a strategy to reduce screen time in early child care settings was implemented in Boston, 125 cases of obesity would be prevented in 2029, saving $138,000 in health care costs over 10 years.

In addition, this strategy would train and provide technical assistance to early childhood educators on reducing screen time. In the initial training series, this strategy would provide additional skills training and professional development for 1,380 educators and more opportunities to reduce screen time in 570 (100%) child care programs serving 3-5 year olds.

To learn more about this strategy, read the research brief.

  • Bovenzi M, Carter S, Sabir M, Bolton AA, Barrett JL, Reiner JF, Cradock AL, Gortmaker SL. Boston, MA: Reducing Screen Time in Early Child Care Settings {Issue Brief}. Boston Public Health Commission and the CHOICES Learning Collaborative Partnership at the Harvard T.H. Chan School of Public Health, Boston, MA; October 2023.
References

1. Mendoza JA, Baranowski T, Jaramillo S, et al. Fit 5 Kids TV Reduction Program for Latino Preschoolers: A Cluster Randomized Controlled Trial. American Journal of Preventive Medicine. 2016;50(5):584-592.<
2. Dennison BA, Russo TJ, Burdick PA, Jenkins PL. An intervention to reduce television viewing by preschool children. Archives of Pediatrics and Adolescent Medicine. 2004;158(2):170-176.

More Movement Program in Early Child Care Settings

The more movement program provides training opportunities and resources for early child care educators to implement actions in their programs to encourage physical activity. This strategy could support Boston’s efforts to improve early child care quality through the Boston Healthy Child Care Initiative. It would include training opportunities for early child care educators in physical activity curricula, provide resources and instructional materials, and support technical assistance opportunities that may lead to higher physical activity levels among young children.1,2

Helping educators implement practices shown to be effective in increasing physical activity can help the children in Boston’s early education and care settings to move more.

Implementing the more movement program in early child care settings is an investment in the future. By the end of 2029: 18,200 children reached over 10 years; 7.4 additional minutes of moderate-to-vigorous physical activity per child per day; $16 per child per year

Additional Key Findings

If the more movement program in early child care settings was implemented in Boston, 94 cases of obesity would be prevented in 2029, saving $104,000 in health care costs over 10 years. Besides promoting a healthy weight, increasing physical activity is linked to improved bone and muscular health and better gross motor skills in young children.3-5

In addition, this strategy would train and provide technical assistance to early childhood educators. In the initial training series, the more movement program would provide additional skills training and professional development for 1,380 educators and more physical activity promotion opportunities in 570 (100%) child care programs serving 3-5 year olds.

To learn more about this strategy, read the research brief.

  • Bovenzi M, Carter S, Sabir M, Bolton AA, Barrett JL, Reiner JF, Cradock AL, Gortmaker SL. Boston, MA: More Movement Program in Early Child Care Settings {Issue Brief}. Boston Public Health Commission and the CHOICES Learning Collaborative Partnership at the Harvard T.H. Chan School of Public Health, Boston, MA; October 2023.
References

1. Fitzgibbon ML, Stolley MR, Schiffer LA, et al. Hip-Hop to Health Jr. Obesity Prevention Effectiveness Trial: Postintervention Results. Obesity (Silver Spring). 2011;19(5):994-1003.
2. Kong A, Buscemi J, Stolley MR, Schiffer LA, Kim Y, Braunschweig CL, Gomez-Perez SL, Blumstein LB, Van Horn L, Dyer AR, Fitzgibbon ML. Hip-Hop to Health Jr. Randomized Effectiveness Trial: 1-Year Follow-up Results. American Journal of Preventive Medicine. 2016 Feb;50(2):136-44.
3. U.S. Dept of Health and Human Services. Physical Activity Guidelines for Americans, 2nd edition. U.S. Dept of Health and Human Services; 2018. Accessed Jul 23, 2021. https://health.gov/sites/default/files/2019-09/Physical_Activity_Guidelines_2nd_edition.pdf
4. Pate RR, Hillman CH, Janz KF, et al. Physical Activity and Health in Children Younger than 6 Years: A Systematic Review. Medicine & Science in Sports & Exercise. 06 2019;51(6):1282-1291.
5. Timmons BW, Leblanc AG, Carson V, et al. Systematic review of physical activity and health in the early years (aged 0-4 years). Applied Physiology, Nutrition, and Metabolism. Aug 2012;37(4):773-92.

Home Visits to Reduce Screen Time

The home visits to reduce screen time strategy aims to reduce the amount of screen time viewed at home by young children. Community health workers would provide counseling and resources on strategies to limit children’s screen time to children and families who participate in home visiting programs.

Through professional development training opportunities, community health workers would learn ways to support families and children in limiting their screen time. During a home visit, community health workers would share the importance of appropriate screen time limits and provide strategies and tools for families to use, including a screen time management device. Integrating this strategy through existing home visiting programs could help more children manage their screen time and grow up at a healthy weight.1Implementing the home visits to reduce screen time strategy is an investment in the future. By the end of 2029: 3,320 children reached over 10 years; 1.8 fewer hours of screen time per child per day; $44,600 saved in health care costs over 10 years

Additional Key Findings

If the home visits to reduce screen time strategy was implemented in Boston, 60 cases of childhood obesity would be prevented in 2029. Besides promoting a healthy weight, this strategy may also benefit children in other ways. Providing children and their families with strategies to move away from their screens allows for more time for activities like reading and active play.

By training and equipping 119 community health workers annually by ensuring that everyone has access to what they need to grow up healthy and strong, this strategy could help reach those families and children that may be at higher risk of having or developing obesity. Children in households with low income could see greater health benefits from this strategy.1

To learn more about this strategy, read the research brief.

  • Carter S, Bovenzi M, Sabir M, Bolton AA, Reiner JR, Barrett JL, Cradock AL, Gortmaker SL. Boston, MA: Home Visits to Reduce Screen Time {Issue Brief}. Boston Public Health Commission, Boston, MA, and the CHOICES Learning Collaborative Partnership at the Harvard T.H. Chan School of Public Health, Boston, MA; February 2023.
References

1. Epstein LH, Roemmich JN, Robinson JL, et al. A randomized trial of the effects of reducing television viewing and computer use on body mass index in young children. Arch Pediatr Adolesc Med. Mar 2008;162(3):239-45. doi:10.1001/archpediatrics.2007.45

Movement Breaks in the Classroom

Movement breaks in the classroom is a strategy to promote physical activity during the school day by incorporating five-to-10-minute movement breaks in K-5 public elementary school classrooms. To implement the movement breaks strategy in Boston, teachers, Wellness Champions, and staff would receive training, equipment, and materials to incorporate short activity breaks in the classroom to help children move more.1,2

This aligns with Boston Public School’s (BPS) Physical Education and Physical Activity Policy that requires schools to offer physical activity opportunities during the school day,3 as well as BPS’ Whole School, Whole Community, Whole Child approach, which supports students’ holistic health by promoting positive classroom environments that foster physical activity and learning.

Implementing movement breaks in the classroom is an investment in the future. By the end of 2029: 29,400 students reached over 10 years; 25 additional minutes of moderate-to-vigorous physical activity per student per school week; $1.74 per child per year

Additional Key Findings

If movement breaks were incorporated into classrooms in Boston, 37 cases of childhood obesity would be prevented in 2029 and save $35,300 in health care costs related to excess weight over 10 years.

By training and equipping over 600 teachers and other school staff yearly to incorporate movement breaks in the classroom, this strategy could help all Boston Public Schools cultivate a positive school climate and improve social emotional learning.4 Participation in movement breaks are associated with students spending more time on task,5 and teachers report that students are more engaged, supportive of each other, and responsive to teacher instructions after participating in a movement break.6

To learn more about this strategy, read the research brief.

  • Carter J, Greene J, Neeraja S, Bovenzi, M, Sabir M, Carter S, Bolton AA, Barrett JL, Reiner JR, Cradock AL, Gortmaker SL. Boston, MA: Movement Breaks in the Classroom {Issue Brief}. Boston Public Schools, Boston Public Health Commission, and the CHOICES Learning Collaborative Partnership at the Harvard T.H. Chan School of Public Health, Boston, MA; August 2022.
References

1. Erwin HE, Beighle A, Morgan CF, Noland M. Effect of a low-cost, teacher-directed classroom intervention on elementary students’ physical activity. J Sch Health. 2011;81(8):455-461.
2. Murtagh E, Mulvihill M, Markey O. Bizzy Break! The effect of a classroom-based activity break on in-school physical activity levels of primary school children. Pediatr Exerc Sci. 2013;25(2):300-307.
3. Boston Public Schools. Physical Education & Physical Activity Policy. 2020:8. Superintendent’s Circular. https://drive.google.com/file/d/1rSGwpFaa4LsPKxjhdsHxz2IaXg3ZFVtE/view?usp=embed_facebook
4. School-Based Physical Activity Improves the Social and Emotional Climate for Learning. Centers for Disease Control and Prevention,. Accessed March 9, 2022. https://www.cdc.gov/healthyschools/school_based_pa_se_sel.htm
5. The Community Preventive Services Task Force. Physical Activity: Classroom-based Physical Activity Break Interventions. The Community Guide. 2021:8.
Campbell AL, Lassiter JW. Teacher perceptions of facilitators and barriers to implementing classroom physical activity breaks. J Educ Res. 2020;113(2):108-119


Creating Healthier Afterschool Environments (OSNAP)

The Out of School Nutrition and Physical Activity (OSNAP) initiative helps afterschool programs improve practices and policies that increase physical activity and consumption of healthy snacks.

To implement this initiative, the Boston Public Health Commission would provide professional development opportunities for afterschool program leaders serving students in grades K-5. Afterschool staff leaders would participate in three learning collaborative sessions and receive technical assistance to assess1 and modify their programs’ practices and policies2  to meet the OSNAP nutrition and physical activity goals.

Creating healthier afterschool environments is an investment in the future. By the end of 2029: 10,800 children reached over 10 years; $34,100 saved in health care costs in 2029; $18.30 per child per year

Additional Key Findings

If the OSNAP initiative was implemented in Boston, 37 cases of obesity would be prevented in 2029. It is also projected to be cost-effective at commonly accepted thresholds3 based on net population health improvement related to excess weight ($72,100 per quality-adjusted life year gained).

This strategy may also support children’s health in a variety of other ways. Regular physical activity, healthy eating, and adequate hydration can improve children’s mental and emotional well-being and their heart, lung, and bone health.4 These healthy behaviors can also strengthen students’ attention, memory,5,6 and cognitive functioning,5 all important components for learning and academic performance.

To learn more about this strategy, read the research brief.

  • Carter S, Bovenzi M, Clarke J, Bolton AA, Reiner JF, Barrett JL, Cradock AL, Gortmaker SL. Boston, MA: Creating Healthier Afterschool Environments (OSNAP) {Issue Brief}. Boston Public Health Commission, Massachusetts, and the CHOICES Learning Collaborative Partnership at the Harvard T.H. Chan School of Public Health, Boston, MA; July 2023.
References

1. Lee RM, Emmons KM, Okechukwu CA, Barrett JL, Kenney EL, Cradock AL, Giles CM, deBlois ME, Gortmaker SL. Validity of a practitioner-administered observational tool to measure physical activity, nutrition, and screen time in school-age programs. Int J Behav Nutr Phys Act. 2014 Nov 28;11:145. doi: 10.1186/s12966-014-0145-5.
2. Kenney EL, Giles CM, deBlois ME, Gortmaker SL, Chinfatt S, Cradock AL. Improving nutrition and physical activity policies in afterschool programs: results from a group-randomized controlled trial. Prev Med. 2014;66:159-166. doi:10.1016/j.ypmed.2014.06.011
3. Neumann PJ, Cohen JT, Weinstein MC. Updating cost-effectiveness–the curious resilience of the $50,000-per-QALY threshold. New England Journal of Medicine. 2014 Aug 28;371(9):796-7. DOI: 10.1056/NEJMp1405158. PMID: 25162885.
4. Health Benefits of Physical Activity for Children. Centers for Disease Control and Prevention. https://www.cdc.gov/physicalactivity/basics/adults/health-benefits-of-physical-activity-for-children.html. Published Jan 12, 2022. Updated 2022-01-12T05:06:09Z. Accessed Dec 7, 2022.
5. Childhood Nutrition Facts. Centers for Disease Control and Prevention. https://www.cdc.gov/healthyschools/nutrition/facts.htm. Published 2022. Updated 2022-08-05T03:49:26Z. Accessed Dec 12, 2022.
6. Blanding N. Afterschool Programs in Boston, MA, Expand Opportunities for Obesity Prevention. Centers for Disease Control and Prevention; 2016. http://nccd.cdc.gov/nccdsuccessstories


The design for this brief and its graphics were developed by Molly Garrone, MA and partners at Burness.

This document was developed at the Harvard T.H. Chan School of Public Health through the Childhood Obesity Intervention Cost-Effectiveness Study (CHOICES) Learning Collaborative Partnership. This document is intended for educational use only. This work is supported by The JPB Foundation and the Centers for Disease Control and Prevention (U48DP006376). The findings and conclusions are those of the author(s) and do not necessarily represent the official position of the Centers for Disease Control and Prevention or other funders.

← Back to Resources


Explore and compare these strategies and more using the CHOICES National Action Kit 2.0!

Coffee Chat: Using Local Data to Improve Health and Advance Health Equity

In this coffee chat hosted by the CHOICES Community of Practice, guest speakers Dr. Susan Carlson and Magdalena Pankowska highlighted the resources and data available through PLACES — a collaboration between the CDC, Robert Wood Johnson Foundation, and the CDC Foundation that provides local data estimates for all U.S. counties, places, census tracts, and ZIP Code tabulation areas — showcased the 2023 data release, and shared how these resources can be used to inform work around healthy eating, active living, and advancing health equity.

View the resource round-up from this coffee chat

Download the October 2023 coffee chat presentation slides

← Back to Resources

Coffee Chat: Improving Social Determinants of Health: Year 2 Getting Further Faster Project Findings

In this coffee chat, partners from National Association of County and City Health Officials (NACCHO) and Association of State and Territorial Health Officials (ASTHO) shared key findings from the second year of their ongoing project funded by the Centers for Disease Control and Prevention: Improving Social Determinants of Health – Getting Further Faster.

View the resource round–up from this coffee chat.

Download the May 2023 coffee chat presentation slides.

← Back to Resources

May 2022 Coffee Chat Resource Round-Up

This document compiles resources and information shared during the May 19, 2022 coffee chat, which featured partners who shared how improving access to safe and appealing drinking water in schools and communities is a key strategy for helping children grow up healthy.

← Back to Resources

Brief: Improving Drinking Water Equity and Access in California Schools

School-aged girl drinking water from a reusable water bottle

The information in this brief is intended only to provide educational information.

This brief summarizes a CHOICES Learning Collaborative Partnership model examining a strategy to improve access to drinking water in California schools. This voluntary water equity and access program involves the installation of touchless chilled water dispensers on or near school cafeteria lunch lines in K-8 non-charter California public schools that have adequate plumbing.

The Issue

All children should have access to clean, appealing, and free drinking water no matter where they live or where they go to school. Providing appealing access to drinking water gives students a healthier alternative to sugary drinks, like sweetened fruit drinks, sports drinks, and soda. Students drink more water when schools provide access to water at lunch at no charge,1 and improving school water access can help kids grow up at a healthy weight.2,3

In California, one in 10 schools reported having no access to free drinking water where meals are served despite state and federal requirements.4,5 Additionally, only one in five schools reported meeting criteria considered the standard for excellence in water access.4 Creating a healthy, equitable school environment that includes appealing drinking water access can help set children up for a healthy future.

About the Water Dispensers in Schools Strategy

This strategy focuses on increasing water access by installing touchless water dispensers at schools serving primarily families with low income, which also have a greater share of Black/African American and Latino students than other schools in California. Promoting better drinking water access in schools has been shown to increase water intake during the day and may help promote a healthy weight.3 Thus, it is a strategy that can help local health departments reach the twin goals of increasing access to and promotion of safe drinking water while decreasing access to and consumption of sugary drinks.6 Putting this strategy into place would require resources for administering the program, installing and maintaining dispensers, utility and disposable cup usage, lead testing and remediation, and delivering water-promotion education.

Comparing Costs and Outcomes

A CHOICES cost-effectiveness analysis compared the costs and outcomes of installing touchless water dispensers in schools with the costs and outcomes associated with not implementing the voluntary water equity and access program over 10 years (2020-2030).

Installation of touchless water dispensers in schools in California is an investment in a more equitable future. By the end of 2030:
If touchless water dispensers were installed in schools in California, then, by the end of 2030, 1.88 million children would be reached with improved access to safe drinking water in schools over 10 years; $12 million would be saved in health care costs over 10 years; and this intervention would cost $6 per child per year to implement.

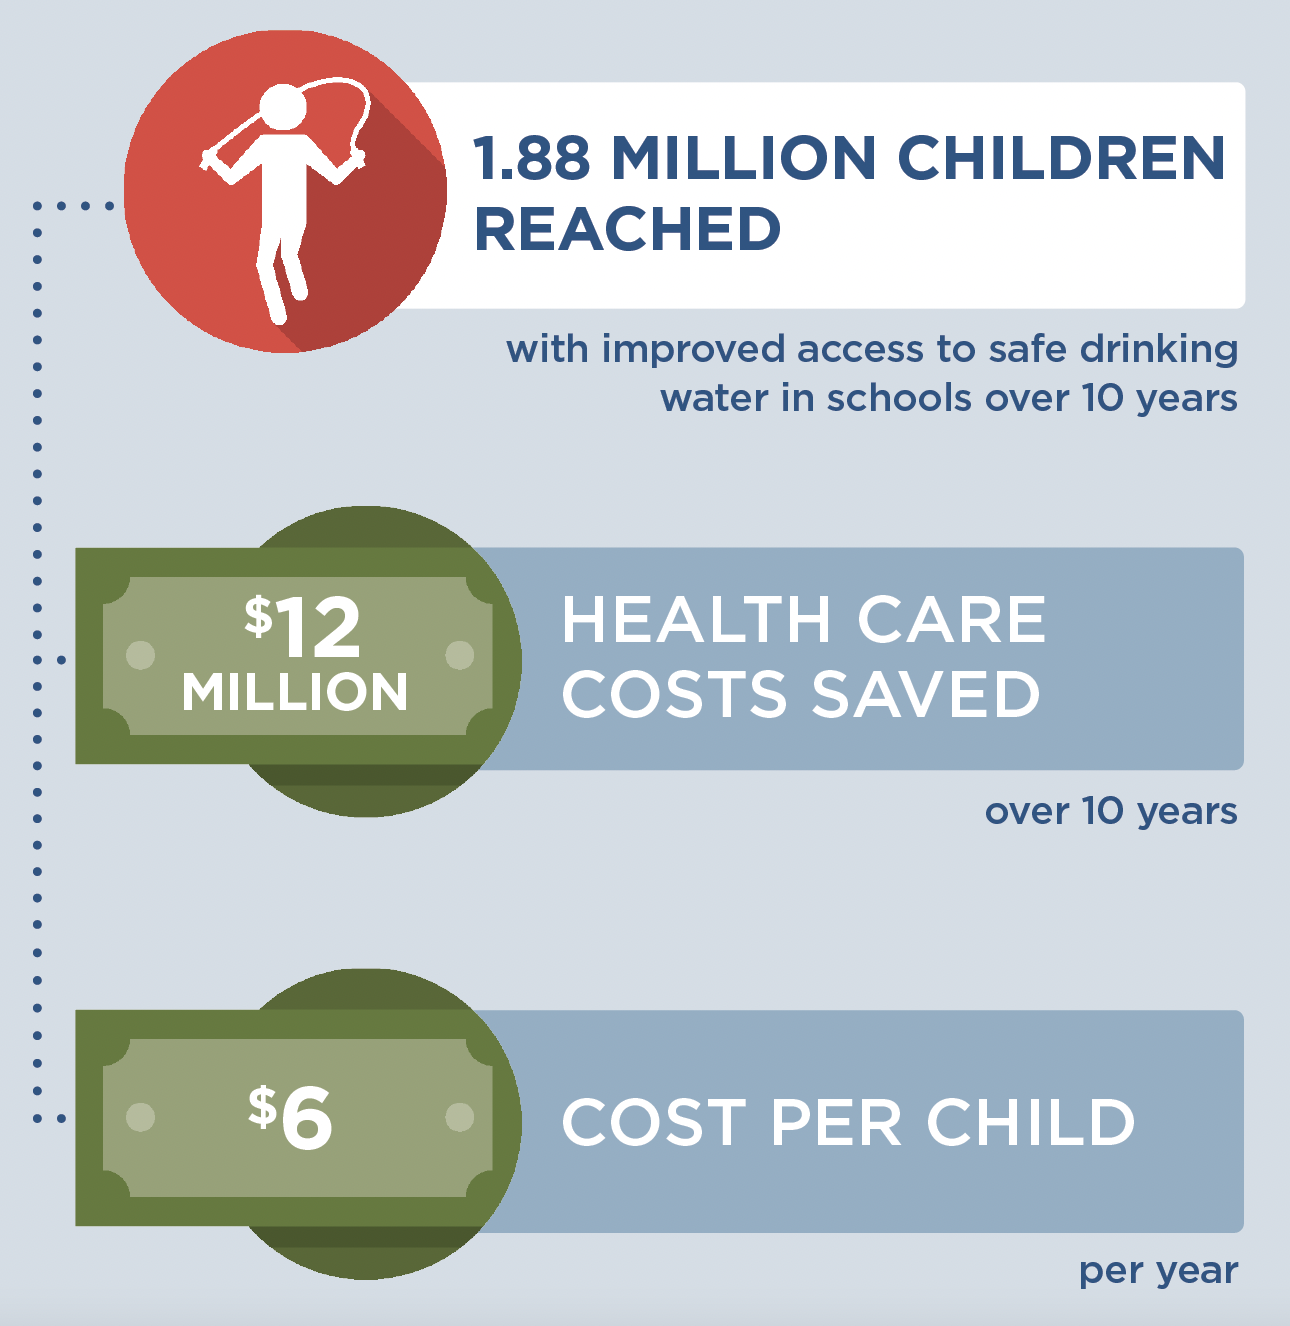
Conclusions and Implications

Installing water dispensers in K-8 public schools is an effective strategy for increasing access to clean, appealing, and free drinking water. Over 10 years, this strategy is expected to improve drinking water access and consumption for over 1.8 million students in California. This strategy is estimated to prevent 3,660 cases of childhood obesity in 2030 and would cost on average $6 per child to implement each year. Comparatively, the value of lunch served to students is $3 per day or about $600 per year.7 While the costs to implement this strategy would be $21,500 per school over 10 years, there would be an estimated $12 million in obesity-related health care cost savings over the same time period.

Improving students’ access to free, clean drinking water could promote health equity. Latino youth report less availability of drinking water access in schools,8 and Black/African American youth are less likely to be adequately hydrated compared with White non-Latino youth.9 Focusing drinking water access improvements in schools with high percentages of Black/African American and Latino students may benefit these populations the most. In addition to promoting a healthy weight, this strategy may also benefit children in other ways. Adequate water consumption can lead to improvements in well-being and support cognitive function.10 Fluoridated water intake also prevents dental caries.11

Though investment is required, every student deserves access to clean, appealing drinking water, and this strategy can be a part of a suite of interventions that support children and their families. Many preventive strategies play a critical role in helping children establish healthy habits early on in life. Focusing on supporting these healthy habits now can help more children grow up at a healthy weight.

References

  1. Bogart LM, Babey SH, Patel AI, Want P, Schuster MA. Lunchtime school water availability and water consumption among California adolescents. Journal of Adolescent Health. 2016; 58(1):98-103, doi: 10.1016/j.jadohealth.2015.09.007.

  2. Schwartz AE, Leardo M, Aneja S, Elbel B. Effect of a School-Based Water Intervention on Child Body Mass Index and Obesity. JAMA Pediatr. 2016; 170(3):220-226. doi:10.1001/jamapediatrics.2015.3778.

  3. Kenney EL, Cradock AL, Long MW, et al. Cost-Effectiveness of Water Promotion Strategies in Schools for Preventing Childhood Obesity and Increasing Water Intake. Obesity. 2019;27(12):2037-2045.

  4. Altman EA, Lee KL, Hecht CA, Hampton KE, Moreno G, Patel AI. Drinking water access in California schools: Room for improvement following implementation of school water policies. Preventive Medicine Reports. 2020;19:101143. Published 2020 Jun 8. doi:10.1016/j.pmedr.2020.101143.

  5. California Department of Education. Drinking Water for Students in Schools. Reviewed January 14, 2020. https://www.cde.ca.gov/ls/nu/he/water.asp#:~:text=California%20Education%20Code%20Section%2038086%20states%20that%20if%20a%20school,reasons%20why%2C%20whether%20due%20to. Accessed February 16, 2021. 

  6. California Department of Public Health. FFY 2020-2022 SNAP-Ed Local Health Departments Programmatic Priorities. Published December 10, 2018. https://www.cdph.ca.gov/Programs/CCDPHP/DCDIC/NEOPB/CDPH%20Document%20Library/Branch16Add2FFY20-22SNAPEdLHD.pdf. Accessed January 29, 2021.

  7. California Department of Education. 2019-20 CNP Reimbursement Rates. https://www.cde.ca.gov/ls/nu/rs/rates1920.asp. Accessed December 12, 2020.

  8. Onfurak SJ, Park S, Wilking C. Student-reported school drinking fountain availability by youth characteristics and state plumbing codes. Preventing Chronic Disease. 2014; 11: E60, doi: 10.5888/pcd11.130314. 

  9. Kenney EL, Long MW, Cradock AL, Gortmaker SL. Prevalence of inadequate hydration among U.S. children and disparities by gender and race/ethnicity: National Health and Nutrition Examination Survey, 2009–2012. American Journal of Public Health. 2015; 105(8): e113-8, doi: 10.2105/AJPH.2015.302572.

  10. Popkin BM, D’Anci KE, Rosenberg IH. Water, hydration, and health. Nutition Reviews. 2010 Aug;68(8):439-58.

  11. American Dental Association and Centers for Disease Control. Nature’s Way to Prevent Tooth Decay: Water Fluoridation. Published 2006. https://www.cdc.gov/fluoridation/pdf/natures_way.pdf. Accessed July 13, 2021. 

Suggested Citation:

Gouck J, Whetstone L, Walter C, Pugliese J, Kurtz C, Seavey-Hultquist J, Barrett J, McCulloch S, Reiner J, Cradock AL. California: Improving Drinking Water Equity and Access in California Schools {Issue Brief}. California Department of Public Health, Sacramento, CA, the County of Santa Clara Public Health Department, San Jose, CA, and the CHOICES Learning Collaborative Partnership at the Harvard T.H. Chan School of Public Health, Boston, MA; December 2021. For more information, please visit www.choicesproject.org

The design for this brief and its graphics were developed by Molly Garrone, MA and partners at Burness.

This issue brief was developed at the Harvard T.H. Chan School of Public Health in collaboration with the California Department of Public Health and the County of Santa Clara Public Health Department through participation in the Childhood Obesity Intervention Cost-Effectiveness Study (CHOICES) Learning Collaborative Partnership. This brief is intended for educational use only. This work is supported by The JPB Foundation and the Centers for Disease Control and Prevention (U48DP006376). The findings and conclusions are those of the author(s) and do not necessarily represent the official position of the Centers for Disease Control and Prevention or other funders.

← Back to Resources