An overview of the CHOICES Community of Practice.
Resource Type: Fact Sheets
Fact Sheet: Movement Breaks in the Classroom (Grades K-5)

The information provided here is intended to be used for educational purposes. Links to other resources and websites are intended to provide additional information aligned with this educational purpose.
Not all students have access to safe streets, playgrounds, or spaces to be physically active. Movement breaks in the classroom provide students with the opportunity to be physically active and help them meet the national physical activity standards1 of at least 60 minutes per day.
- Movement breaks are short physical activity opportunities done in the classroom.
- Only one in four children2 meets the national recommendations1 of physical activity. Movement breaks can supplement other school physical activity opportunities, like recess and physical education, to help more children meet physical activity guidelines.3,4
- Students enjoy having opportunities to be physically active in the classroom, and movement breaks allow students to refocus and bring full attention back to academic work.5-7
Movement breaks can help teachers create a positive classroom climate and culture.8
- Movement breaks in the classroom can increase students’ time spent on tasks3,4 and engagement in learning.4
- Movement breaks can help with classroom management when implemented appropriately.4,5
- Students say they can focus and learn better and are more excited about school after movement breaks.6,7
- Teachers enjoy leading movement breaks. When teachers participate in the breaks, they can also experience the health benefits of being physically active.4
Childhood is a crucial period for developing movement skills and healthy habits. Providing students with physical activity will help them build a foundation for overall health and well-being.
- Regular physical activity can reduce anxiety, stress, and symptoms of depression and improve self-esteem.1
- Active students generally have better heart and lung health, stronger muscles and bones, and healthier body weight than inactive students.1
- Students who are physically active tend to have better grades, attendance at school, memory, and attention.9
Experts agree that students should have opportunities for classroom physical activity. Teachers can help students meet the physical activity recommendations by incorporating movement breaks in the classroom.10-12
- Providing resources and proper training in effective ways to promote movement in the classroom can increase teacher uptake and confidence in implementation and provide children with opportunities for physical activity.4
- Some tips to help teachers run movement breaks are:
✓Introduce and demonstrate activity breaks using a video or other examples.7 Tailor the breaks to the context of your classroom.4
✓Be consistent with the days and times you do movement breaks.7
✓Outline expectations for students and make sure children are aware of their physical space.7 Modify activities to allow all students to participate in the breaks.4 Deep breaths after the movement break can help students transition to the next activity.5
✓Participate in the movement break activities with the students when possible.4
✓Explain the benefits of moving during the school day and provide students with positive reinforcement, especially those who may find movement breaks more challenging.7
✓Consider students’ preferences when doing breaks.3 Students like movement breaks that allow choice, imagination, and that are at an appropriate level of difficulty. They do not like breaks that are too difficult or silly.6
Additional Resources
- Centers for Disease Control and Prevention – Physical Activity Guidelines for Americans, 2nd Edition. Available at: https://health.gov/sites/default/files/2019-09/Physical_Activity_Guidelines_2nd_edition.pdf
- Centers for Disease Control and Prevention: Classroom Physical Activity. Available at: https://www.cdc.gov/healthyschools/physicalactivity/classroom-pa.htm
- Carter J, Greene J, Neeraja S, Bovenzi, M, Sabir M, Carter S, Bolton AA, Barrett JL, Reiner JR, Cradock AL. Boston, MA: Movement Breaks in the Classroom {Issue Brief}. Boston Public Schools, Boston Public Health Commission, and the CHOICES Learning Collaborative Partnership at the Harvard T.H. Chan School of Public Health, Boston, MA; August 2022. Available at: https://choicesproject.org/publications/brief-movement-breaks
- CHOICES Strategy Profile: Movement Breaks in the Classroom. CHOICES Project Team at the Harvard T.H. Chan School of Public Health, Boston, MA; October 2022. Available at: https://choicesproject.org/publications/movement-breaks-profile
- The Community Preventive Services Task Force. Physical Activity: Classroom-based Physical Activity Break Interventions. The Community Guide. 2021:8. Available at: https://www.thecommunityguide.org/findings/physical-activity-classroom-based-physical-activity-break-interventions
References
- U.S. Department of Health and Human Services. Physical Activity Guidelines for Americans, 2nd Edition. U.S. Department of Health and Human Services; 2018:118. Accessed November 29, 2021. https://health.gov/sites/default/files/2019-09/Physical_Activity_Guidelines_2nd_edition.pdf
- Data Resource Center for Child & Adolescent Health. National Performance Measure 8.1: Percent of children, ages 6 through 11, who are physically active at least 60 minutes per day. Childhealthdata.org. Accessed August 15, 2022. https://www.childhealthdata.org/browse/survey/results?q=9184&r=1
- The Community Preventive Services Task Force. Physical Activity: Classroom-based Physical Activity Break Interventions. The Guide to Community Preventive Services (The Community Guide). Published August 9, 2021. Accessed November 29, 2021. https://www.thecommunityguide.org/findings/physical-activity-classroom-based-physical-activity-break-interventions
- Centers for Disease Control and Prevention. Strategies for Classroom Physical Activity in Schools. U.S. Department of Health and Human Services; 2018:25. Accessed November 29, 2021. https://www.cdc.gov/healthyschools/physicalactivity/classroom-pa.htm
- Campbell AL, Lassiter JW. Teacher perceptions of facilitators and barriers to implementing classroom physical activity breaks. J Educ Res. 2020;113(2):108-119. doi:10.1080/00220671.2020.1752613
- Watson A, Timperio A, Brown H, Hesketh KD. Process evaluation of a classroom active break (ACTI-BREAK) program for improving academic-related and physical activity outcomes for students in years 3 and 4. BMC Public Health. 2019;19(1):633. doi:10.1186/s12889-019-6982-z
- Cline A, Knox G, De Martin Silva L, Draper S. A Process Evaluation of A UK Classroom-Based Physical Activity Intervention—‘Busy Brain Breaks.’ Children. 2021;8(2):63. doi:10.3390/children8020063
- Centers for Disease Control and Prevention. School-Based Physical Activity Improves the Social and Emotional Climate for Learning.Cdc.gov. Published March 29, 2021. Accessed March 9, 2022. https://www.cdc.gov/healthyschools/school_based_pa_se_sel.htm
- Centers for Disease Control and Prevention. The Association Between School-Based Physical Activity, Including Physical Education, and Academic Performance. U.S. Department of Health and Human Services; 2010:84. Accessed November 29, 2021. https://www.cdc.gov/healthyyouth/health_and_academics/pdf/pa-pe_paper.pdf
- SHAPE America. Shape of the Nation: Status of Physical Education in the USA. SHAPE America – Society of Health and Physical Educators. 2016:142. Accessed November 29, 2021. https://www.shapeamerica.org/advocacy/son/
- Institute of Medicine. Educating the Student Body: Taking Physical Activity and Physical Education to School. National Academies Press. 2013:420. Accessed August 17, 2022. https://nap.nationalacademies.org/catalog/18314/educating-the-student-body-taking-physical-activity-and-physical-education
- Centers for Disease Control and Prevention. Classroom Physical Activity. Cdc.gov. Published July 27, 2022. Accessed Oct 8, 2021. https://www.cdc.gov/healthyschools/physicalactivity/classroom-pa.htm
Suggested Citation
Get the Facts: Movement Breaks in the Classroom (Grades K-5). Prevention Research Center on Nutrition and Physical Activity Team at the Harvard T.H. Chan School of Public Health, Boston, MA; March 2023.
Funding
This work is supported by The JPB Foundation and the Centers for Disease Control and Prevention (U48DP006376). The findings and conclusions are those of the author(s) and do not necessarily represent the official position of the Centers for Disease Control and Prevention or other funders. The information provided here is intended to be used for educational purposes. Links to other resources and websites are intended to provide additional information aligned with this educational purpose.
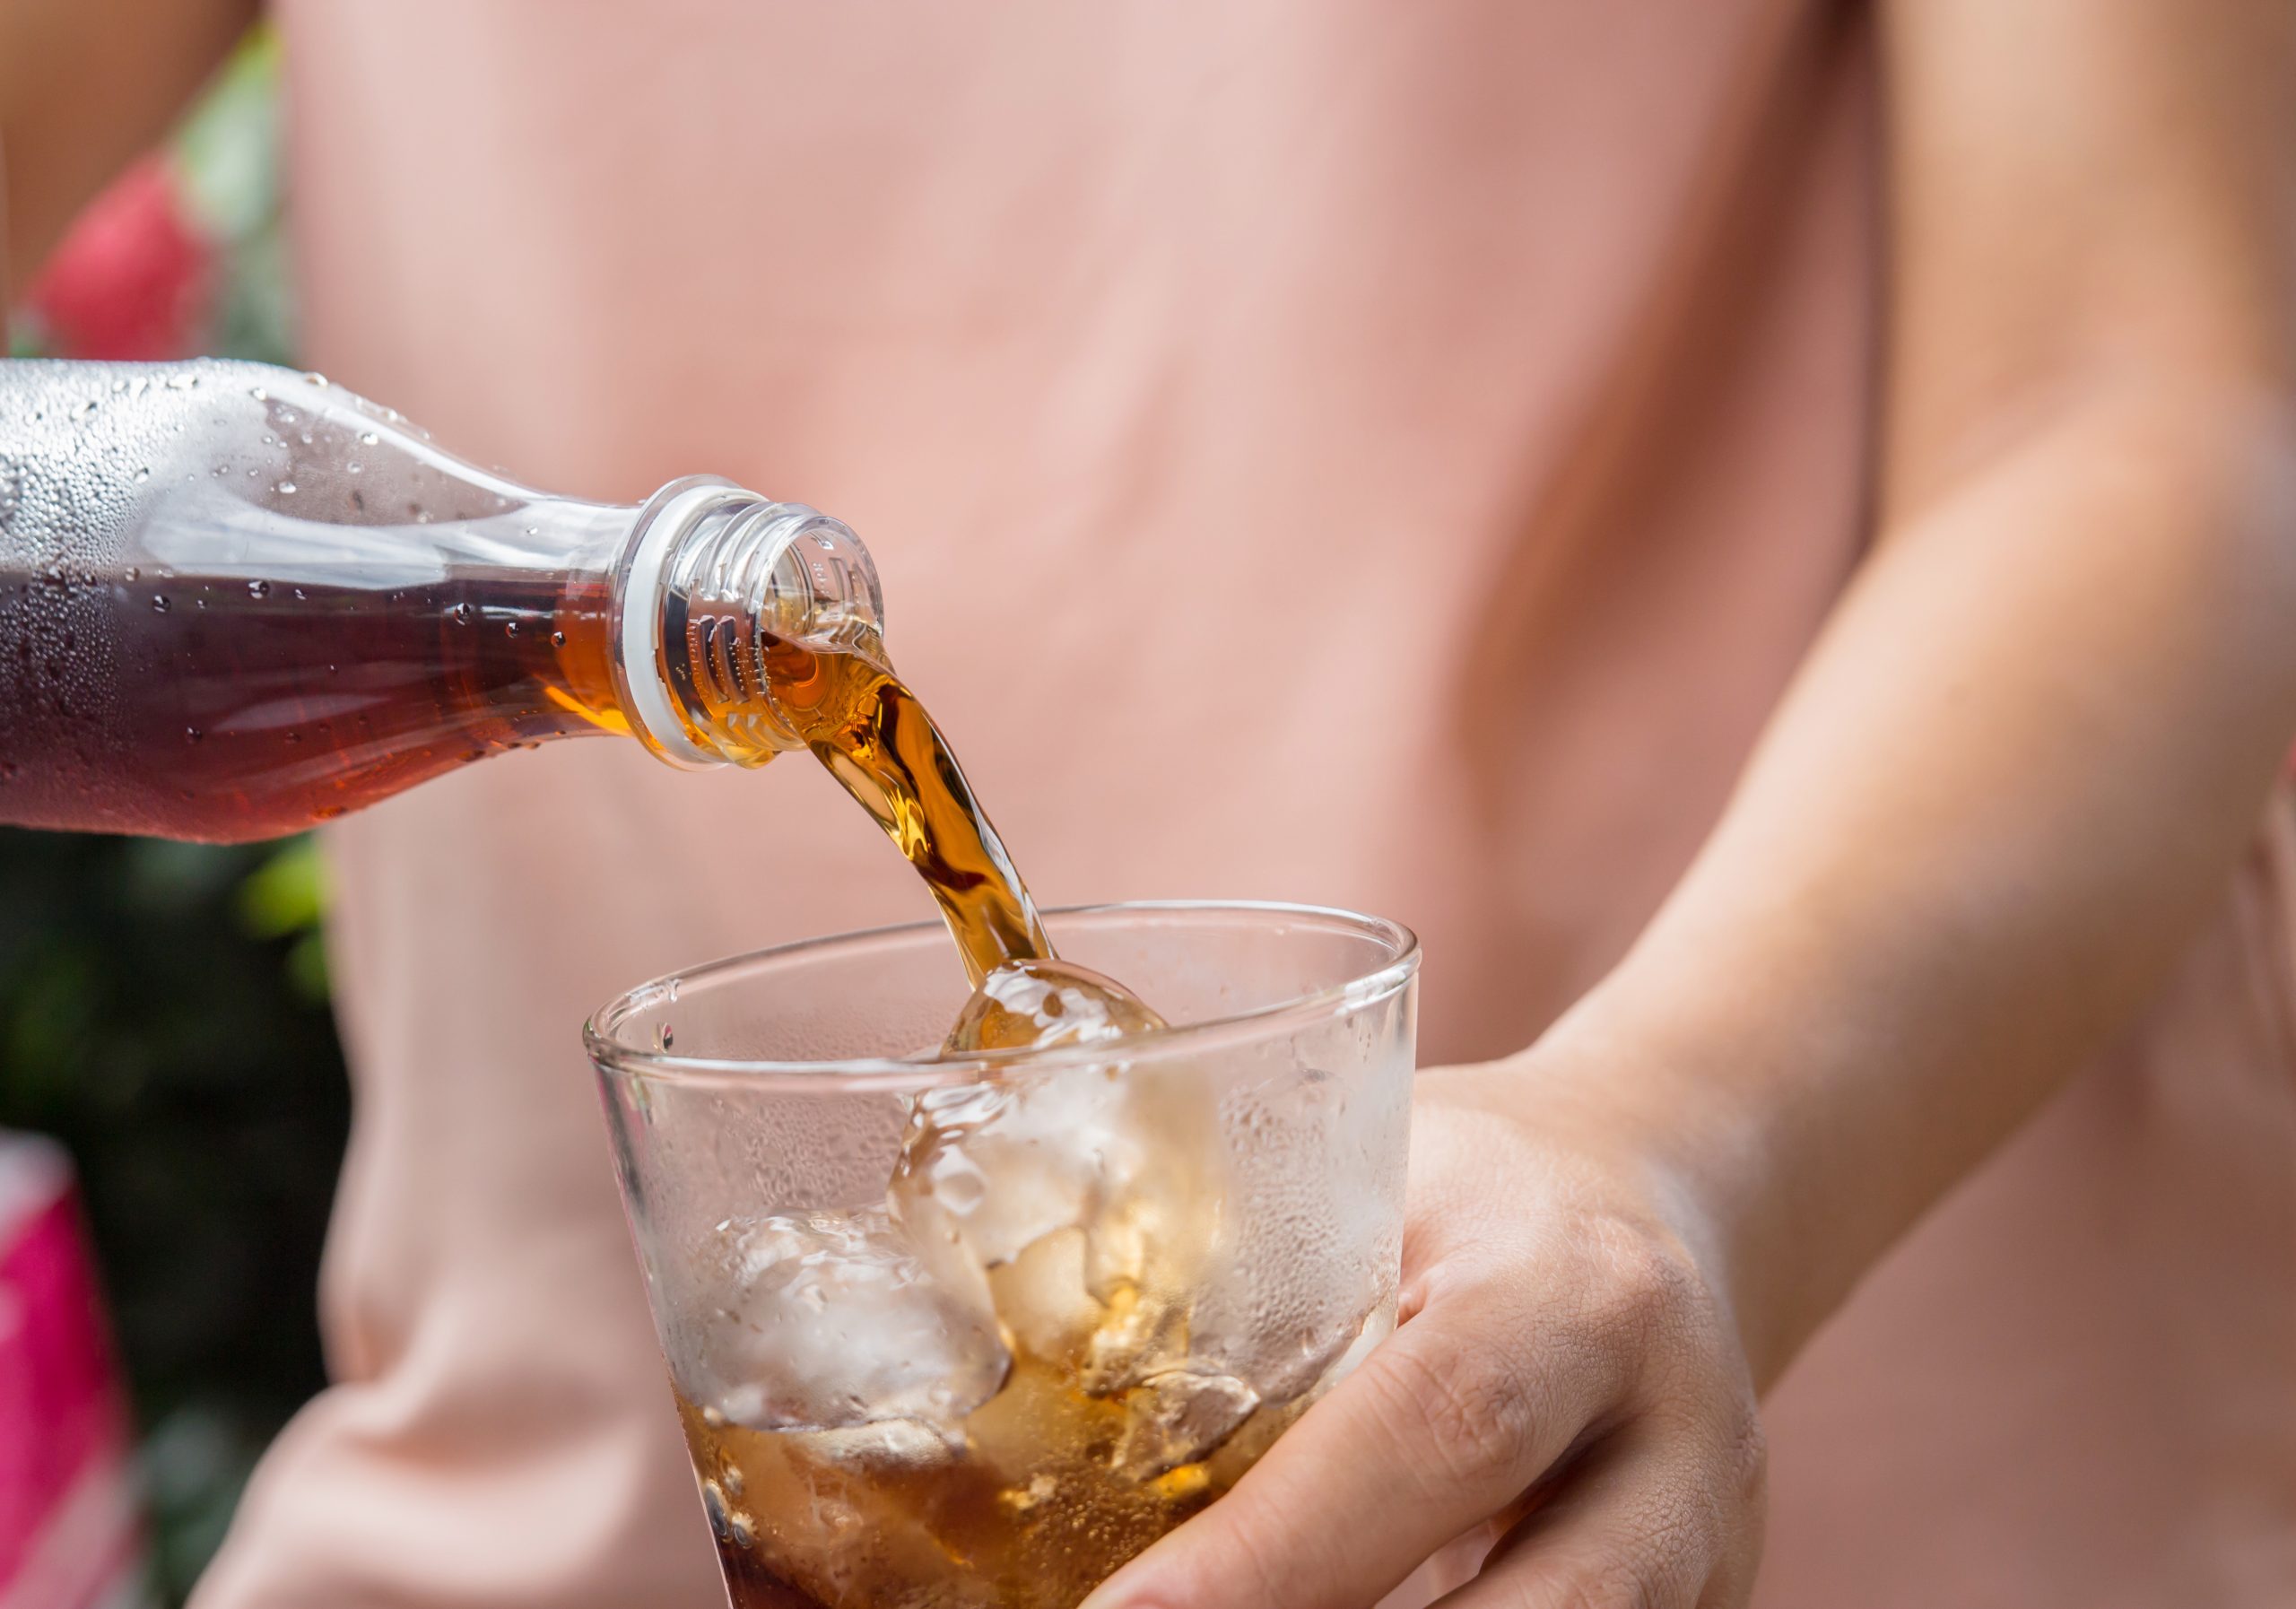
Fact Sheet: Sugary Drink Consumption

The information provided here is intended to be used for educational purposes. Links to other resources and websites are intended to provide additional information aligned with this educational purpose.
Sugary drinks include regular soda, fruit drinks with less than 100% juice, sweetened water, sports and energy drinks, and coffees and teas with added sugars.1,2
- Diet drinks, alcohol, coffee, and teas without added sugars and flavored milks that contain 50% dairy or more are usually not considered sugary drinks.3
- On average, US adults and children consume nearly 150 calories a day from sugary drinks, or about 6-12% of their daily caloric needs.2,4
Sugary drinks account for nearly half of the total added sugars in a typical American diet.1 About half of adults and over 60% of kids consume a sugary drink on any given day.2-5
- Despite some decline in consumption in recent years, both adults and kids in the US continue to consume more sugary drinks and added sugars than recommended.1,6,7 Sugary drinks are often cheaper than bottled water, making them an attractive option when tap water is not safe to drink.8,9
- Beverage companies focus advertising10,11 and retail marketing12 efforts on African Americans and Hispanic Americans, as well as on children.13
- Research shows that African Americans and Hispanic Americans drink more sugary drinks compared to non-Hispanic White Americans.4,14,15 Among households with young children, those with lower incomes purchased more sweetened fruit drinks compared to households with higher incomes.16
There is strong evidence suggesting that drinking too many sugary drinks substantially increases the risk of gaining excess weight and obesity,17,18 and developing chronic diseases including diabetes, cardiovascular disease, tooth decay, and cavities.19-22
Experts recommend drinking water instead of sugary drinks.23 There are many ways to make drinking water more available:
- At home:
- ✓Be a model to kids by limiting or eliminating your own consumption of sugary drinks.
- ✓Offer drinking water or other non-sugary options.
- At school:
- ✓Teach students about the amount of sugar in common beverages and the importance of reducing intake for improved health outcomes.24,25
- ✓Implement federal food and beverage standards that prohibit sales of unhealthy options like sugary drinks in schools.26,27
- ✓Increase access to and promotion of free, safe drinking water in schools.28
- In your city, county, or state:
- ✓Limit sales of sugary drinks on city property.29
- ✓Create healthier out-of-school time environments by training staff to adopt a healthy beverage policy in their programs.30,31
- ✓Implement a sugary drink excise tax to discourage consumption, as many US jurisdictions have successfully done.32,33 This is projected to be a cost-saving strategy that can improve population health and health equity.
Additional Resources
- The CHOICES Project has evaluated the potential impact on health and health equity that a sugary drink excise tax could have in Hawaii, Minnesota, Denver, Utah, California, New York City, and New York state. Learn more: https://choicesproject.org/choices-map
- Sugary Drinks. Prevention Research Center on Nutrition and Physical Activity at the Harvard T.H. Chan School of Public Health. Available at: https://www.hsph.harvard.edu/prc/priority-areas/sugary-drinks
- Carter J, Wiecha JL, Peterson KE, Nobrega S, Gortmaker SL. Lesson 19: Pass the Sugar. In: Planet Health: An Interdisciplinary Curriculum for Teaching Middle School Nutrition and Physical Activity (Second Edition). Champaign, Illinois: Human Kinetics; 2007. Available at: https://cdn1.sph.harvard.edu/wp-content/uploads/sites/84/2022/12/Planet-Health-Lesson_19.pdf
- U.S. Department of Health and Human Services and U.S. Department of Agriculture. 2015 – 2020 Dietary Guidelines for Americans. 8th Edition. December 2015. Available at https://health.gov/our-work/food-nutrition/previous-dietary-guidelines/2015
- Sugar Toolkit Overview: Why take on sugar? Healthy Food America. Available at www.healthyfoodamerica.org/sugartoolkit_overview
- Consensus Statement: Healthy Beverage Consumption in Early Childhood – Recommendations from Key National Health and Nutrition Organizations. September 2019. Healthy Eating Research.Available at https://healthyeatingresearch.org/wp-content/uploads/2019/09/HER-HealthyBeverage-ConsensusStatement.pdf
References
- U.S. Department of Health and Human Services, U.S. Department of Agriculture. 2015-2020 Dietary Guidelines for Americans. U.S. Department of Health and Human Services and U.S. Department of Agriculture; 2015:144. Accessed November 29, 2021. https://health.gov/sites/default/files/2019-09/2015-2020_Dietary_Guidelines.pdf
- Rosinger A, Herrick K, Gahche J, Park S. Sugar-sweetened Beverage Consumption Among U.S. Youth, 2011-2014. NCHS Data Brief. 2017;(271):1-8.
- City of Philadelphia Department of Revenue. What is subject to the tax. City of Philadelphia. Published November 8, 2019. Accessed November 29, 2021. https://www.phila.gov/services/payments-assistance-taxes/business-taxes/philadelphia-beverage-tax/what-is-subject-to-the-tax
- Rosinger A, Herrick K, Gahche J, Park S. Sugar-sweetened Beverage Consumption Among U.S. Adults, 2011-2014. NCHS Data Brief. 2017;(270):1-8.
- Centers for Disease Control and Prevention. Get the Facts: Sugar-Sweetened Beverages and Consumption. Centers for Disease Control and Prevention. Published March 11, 2021. Accessed November 29, 2021. https://www.cdc.gov/nutrition/data-statistics/sugar-sweetened-beverages-intake.html
- Vercammen KA, Moran AJ, Soto MJ, Kennedy-Shaffer L, Bleich SN. Decreasing Trends in Heavy Sugar-Sweetened Beverage Consumption in the United States, 2003 to 2016. J Acad Nutr Diet. 2020;120(12):1974-1985.e5. doi:10.1016/j.jand.2020.07.012
- Bleich SN, Wang YC, Wang Y, Gortmaker SL. Increasing consumption of sugar-sweetened beverages among US adults: 1988-1994 to 1999-2004. Am J Clin Nutr. 2009;89(1):372-381. doi:10.3945/ajcn.2008.26883
- Blecher E. Global Trends in the Affordability of Sugar-Sweetened Beverages, 1990–2016. Prev Chronic Dis. 2017;14. doi:10.5888/pcd14.160406
- Brooks CJ, Gortmaker SL, Long MW, Cradock AL, Kenney EL. Racial/Ethnic and Socioeconomic Disparities in Hydration Status Among US Adults and the Role of Tap Water and Other Beverage Intake. Am J Public Health. 2017;107(9):1387-1394. doi:10.2105/AJPH.2017.303923
- Powell LM, Wada R, Kumanyika SK. Racial/Ethnic and Income Disparities in Child and Adolescent Exposure to Food and Beverage Television Ads across U.S. Media Markets. Health Place. 2014;29:124-131. doi:10.1016/j.healthplace.2014.06.006
- Cassady DL, Liaw K, Miller LMS. Disparities in Obesity-Related Outdoor Advertising by Neighborhood Income and Race. J Urban Health. 2015;92(5):835-842. doi:10.1007/s11524-015-9980-1
- Adjoian T, Dannefer R, Sacks R, Van Wye G. Comparing Sugary Drinks in the Food Retail Environment in Six NYC Neighborhoods. J Community Health. 2014;39(2):327-335. doi:10.1007/s10900-013-9765-y
- Smith R, Kelly B, Yeatman H, Boyland E. Food Marketing Influences Children’s Attitudes, Preferences and Consumption: A Systematic Critical Review. Nutrients. 2019;11(4):875. doi:10.3390/nu11040875
- Kit BK, Fakhouri THI, Park S, Nielsen SJ, Ogden CL. Trends in sugar-sweetened beverage consumption among youth and adults in the United States: 1999-2010. Am J Clin Nutr. 2013;98(1):180-188. doi:10.3945/ajcn.112.057943
- Bleich SN, Vercammen KA, Koma JW, Li Z. Trends in Beverage Consumption Among Children and Adults, 2003-2014. Obes Silver Spring Md. 2018;26(2):432-441. doi:10.1002/oby.22056
- Choi YY, Andreyeva T, Fleming-Milici F, Harris JL. U.S. Households’ Children’s Drink Purchases: 2006–2017 Trends and Associations With Marketing. Am J Prev Med. 2021;0(0). doi:10.1016/j.amepre.2021.06.013
- Ludwig DS, Peterson KE, Gortmaker SL. Relation between consumption of sugar-sweetened drinks and childhood obesity: a prospective, observational analysis. Lancet Lond Engl. 2001;357(9255):505-508. doi:10.1016/S0140-6736(00)04041-1
- Hu FB. Resolved: there is sufficient scientific evidence that decreasing sugar-sweetened beverage consumption will reduce the prevalence of obesity and obesity-related diseases. Obes Rev. 2013 Aug;14(8):606-19.
- Reilly JJ, Kelly J. Long-term impact of overweight and obesity in childhood and adolescence on morbidity and premature mortality in adulthood: systematic review. Int J Obes 2005. 2011;35(7):891-898. doi:10.1038/ijo.2010.222
- Global Burden of Metabolic Risk Factors for Chronic Diseases Collaboration (BMI Mediated Effects), Lu Y, Hajifathalian K, et al. Metabolic mediators of the effects of body-mass index, overweight, and obesity on coronary heart disease and stroke: a pooled analysis of 97 prospective cohorts with 1·8 million participants. Lancet Lond Engl. 2014;383(9921):970-983. doi:10.1016/S0140-6736(13)61836-X
- Singh GM, Danaei G, Farzadfar F, et al. The Age-Specific Quantitative Effects of Metabolic Risk Factors on Cardiovascular Diseases and Diabetes: A Pooled Analysis. PLOS ONE. 2013;8(7):e65174. doi:10.1371/journal.pone.0065174
- World Cancer Research Fund, American Institute for Cancer Research. Food, Nutrition, Physical Activity, and the Prevention of Cancer: A Global Perspective.; 2008:537. Accessed November 29, 2021. http://choicereviews.org/review/10.5860/CHOICE.45-5024
- Water. The Nutrition Source, Harvard T.H. Chan School of Public Health. Accessed September 2, 2022. https://www.hsph.harvard.edu/nutritionsource/water
- Rauba J, Tahir A, Milford B, et al. Reduction of Sugar-Sweetened Beverage Consumption in Elementary School Students Using an Educational Curriculum of Beverage Sugar Content. Glob Pediatr Health. 2017;4:2333794X17711778. doi:10.1177/2333794X17711778
- Cheung PLYH, Dart H, Kalin S, Otis B, Gortmaker SL. Lesson 19: Beverage Buzz: Sack the Sugar; Lesson 20: Go for H2O. In: Eat Well and Keep Moving. 3rd Edition Champaign, Illinois: Human Kinetics Press, 2016.
- Centers for Disease Control and Prevention. Competitive Foods and Beverages in U.S. Schools, A State Policy Analysis.; 2012:32. Accessed November 29, 2021. https://www.cdc.gov/healthyschools/nutrition/pdf/compfoodsbooklet.pdf
- Muckelbauer R, Gortmaker SL, Libuda L, et al. Changes in water and sugar-containing beverage consumption and body weight outcomes in children. Br J Nutr. 2016;115(11):2057-2066. doi:10.1017/S0007114516001136
- Kenney EL, Cradock AL, Long MW, Barrett JL, Giles CM, Ward ZJ, Gortmaker SL. Cost-Effectiveness of Water Promotion Strategies in Schools for Preventing Childhood Obesity and Increasing Water Intake. Obesity (Silver Spring). 2019 Dec;27(12):2037-2045. doi: 10.1002/oby.22615. PMID: 31746555.
- Cradock AL, Kenney EL, McHugh A, Conley L, Mozaffarian RS, Reiner JF, et al. Evaluating the Impact of the Healthy Beverage Executive Order for City Agencies in Boston, Massachusetts, 2011–2013. Prev Chronic Dis 2015;12:140549. doi:10.5888/pcd12.140549
- Kenney EL, Austin SB, Cradock AL, Giles CM, Lee RM, Davison KK, Gortmaker SL. Identifying sources of children’s consumption of junk food in Boston afterschool programs, April-May 2011. Preventing Chronic Disease. 2014 Nov 20;11:E205.
- Salas TM, Meinen A, Kim H, McCulloch S, Reiner J, Barrett J, Cradock AL. Wisconsin: Supporting Healthy Beverage Choices in Out-of-School Time Programs {Issue Brief}. Wisconsin Department of Health Services & University of Wisconsin-Madison, Madison, WI, and the CHOICES Learning Collaborative Partnership at the Harvard T.H. Chan School of Public Health, Boston, MA; May 2021. For more information, please visit www.choicesproject.org
- Krieger J, Bleich SN, Scarmo S, Ng SW. Sugar-Sweetened Beverage Reduction Policies: Progress and Promise. Annu Rev Public Health. 2021 Apr 1;42:439-461. doi: 10.1146/annurev-publhealth-090419-103005. Epub 2021 Nov 30. PMID: 33256536.
- Gortmaker SL, Bleich SN, Kenney EL, Barrett JL, Ward ZJ, Long MW, Cradock AL. Cost-Effective Strategies to Prevent Obesity and Improve Health Equity. Harvard T.H. Chan School of Public Health, 2021. https://choicesproject.org/publications/cost-effective-strategies-health-equity
Suggested Citation
Get the Facts: Sugary Drink Consumption. Prevention Research Center on Nutrition and Physical Activity Team at the Harvard T.H. Chan School of Public Health, Boston, MA; January 2023.
Funding
This work is supported by The JPB Foundation and the Centers for Disease Control and Prevention (U48DP006376). The findings and conclusions are those of the author(s) and do not necessarily represent the official position of the Centers for Disease Control and Prevention or other funders. The information provided here is intended to be used for educational purposes. Links to other resources and websites are intended to provide additional information aligned with this educational purpose.
Fact Sheet: Low- and No-Calorie Sweetened Drinks
The information provided here is intended to be used for educational purposes. Links to other resources and websites are intended to provide additional information aligned with this educational purpose.
Low- and no-calorie sweeteners are man-made sweeteners that are much sweeter than regular sugar but have few to no calories.1
-
Low- and no-calorie sweeteners are sometimes called artificial sweeteners, high-intensity sweeteners, and non-nutritive sweeteners.1-3
-
There are 19 different low- and no-calorie sweeteners,4 six of which are approved by the US Food and Drug Administration as food additives: advantame, aspartame, acesulfame potassium, neotame, saccharin, and sucralose.1
-
Two other kinds of low- and no-calorie sweeteners—steviol glycosides from the stevia plant and extracts from the monk fruit—are considered “Generally Recognized as Safe,” which allows them to be used in food and drinks.2
Data from 2009-2012 show that about 19% of kids and 31% of adults in the US drink beverages made with low- and no-calorie sweeteners.5
-
This is a big increase from 1999-2000, when only 6% of kids and about 19% of adults were drinking these beverages.6
-
During both of these time periods, non-Hispanic White Americans were more likely to report drinking these beverages than non-Hispanic African Americans and Hispanic Americans as well as those with a high income compared to those with a middle or low income.5,6
There are mixed findings about the health effects of drinking low- and no-calorie sweetened drinks and multiple concerning studies.7,8 Ongoing research is looking at long-term impacts on the body for kids and adults.9
-
There’s some good evidence that suggests replacing sugary drinks (like soda) with low- and no-calorie sweetened drinks is a strategy to avoid excess weight gain in children.10
-
However, experts suggest replacing sugary and artificially-sweetened drinks with water, if possible. Water is an excellent beverage choice, especially for kids. It’s perfect for hydration, very affordable, has no calories, and fluoridated water helps protect teeth.11
Additional Resources
- High-Intensity Sweeteners. U.S. Food and Drug Administration. 2014. Available at https://www.fda.gov/food/food-additives-petitions/high-intensity-sweeteners
- Non-Nutritive Sweeteners (Artificial Sweeteners). American Heart Association. 2018. Available at https://www.heart.org/en/healthy-living/healthy-eating/eat-smart/sugar/nonnutritive-sweeteners-artificial-sweeteners
- Low-Calorie Sweeteners. The Nutrition Source at the Harvard T.H. Chan School of Public Health. Available at https://www.hsph.harvard.edu/nutritionsource/healthy-drinks/artificial-sweeteners
References
- Food and Drug High-Intensity Sweeteners. FDA. Published online February 20, 2020. Accessed November 29, 2021. https://www.fda.gov/food/food-additives-petitions/high-intensity-sweeteners
- USDA Food and Nutrition Information Nutritive and Nonnutritive Sweetener Resources. National Agricultural Library. Accessed November 29, 2021. https://www.nal.usda.gov/human-nutrition-and-food-safety/food-composition/sweeteners
- Center for Science in the Public Interest. Trends in Low Calorie Sweetener Consumption in the United States. CSPI. September 2021. Accessed June 9, 2022. https://www.cspinet.org/resource/trends-low-calorie-sweetener-consumption-united-states
- American Heart Non-Nutritive Sweeteners (Artificial Sweeteners). www.heart.org. Published April 16, 2018. Accessed November 29, 2021. https://www.heart.org/en/healthy-living/healthy-eating/eat-smart/sugar/nonnutritive-sweeteners-artificial-sweeteners
- Sylvetsky AC, Jin Y, Clark EJ, Welsh JA, Rother KI, Talegawkar Consumption of Low-Calorie Sweeteners among Children and Adults in the United States. J Acad Nutr Diet. 2017;117(3):441-448.e2. doi:10.1016/j.jand.2016.11.004
- Sylvetsky AC, Welsh JA, Brown RJ, Vos Low-calorie sweetener consumption is increasing in the United States123. Am J Clin Nutr. 2012;96(3):640-646. doi:10.3945/ajcn.112.034751
- Swithers SE. Artificial sweeteners are not the answer to childhood obesity. Appetite. 2015 Oct;93:85-90. doi: 10.1016/j.appet.2015.03.027. Epub 2015 Mar 28.
- Yin J, Zhu Y, Malik V, Li X, Peng X, Zhang FF, Shan Z, Liu L. Intake of Sugar-Sweetened and Low-Calorie Sweetened Beverages and Risk of Cardiovascular Disease: A Meta-Analysis and Systematic Review. Adv Nutr. 2021 Feb 1;12(1):89-101. doi: 10.1093/advances/nmaa084
- Johnson RK, Lichtenstein AH, Anderson CAM, et Low-Calorie Sweetened Beverages and Cardiometabolic Health: A Science Advisory From the American Heart Association. Circulation. 2018;138(9):e126-e140. doi:10.1161/CIR.0000000000000569
- de Ruyter JC, Olthof MR, Seidell JC, Katan A Trial of Sugar-free or Sugar-Sweetened Beverages and Body Weight in Children. N Engl J Med. 2012;367(15):1397-1406. doi:10.1056/NEJMoa1203034
- NIH Office of Dietary Fluoride. Published March 29, 2021. Accessed November 29, 2021. https://ods.od.nih.gov/factsheets/Fluoride-HealthProfessional
Suggested Citation
Get the Facts: Low- and No-Calorie Sweetened Drinks. Prevention Research Center on Nutrition and Physical Activity Team at the Harvard T.H. Chan School of Public Health, Boston, MA; November 2022.
Funding
This work is supported by The JPB Foundation and the Centers for Disease Control and Prevention (U48DP006376). The findings and conclusions are those of the author(s) and do not necessarily represent the official position of the Centers for Disease Control and Prevention or other funders. The information provided here is intended to be used for educational purposes. Links to other resources and websites are intended to provide additional information aligned with this educational purpose.
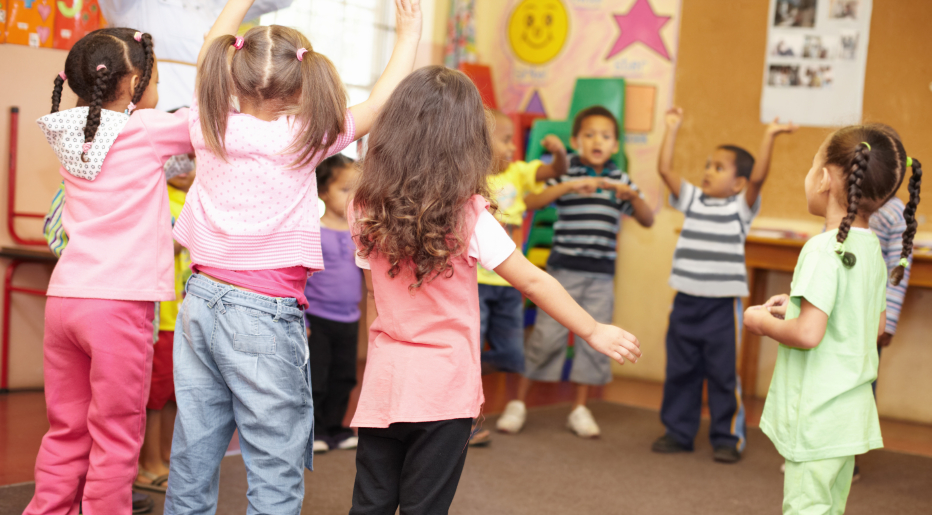
Fact Sheet: Physical Activity is Key for Young Kids’ Health (Ages 3 through 5)
The information provided here is intended to be used for educational purposes. Links to other resources and websites are intended to provide additional information aligned with this educational purpose.
Early childhood is a critical time to establish movement skills and learn healthy habits. Regular physical activity is vital for healthy growth and development.
- Being active improves bone health,1–3 helps maintain a healthy weight,2,3 and strengthens important muscles in the bodies of young children.
Young kids should get at least three hours each day of total physical activity to enhance their growth and development.3,5
- Many (but not all) young children get recommended levels of physical activity.4,5
- Participating in a variety of activities like playing dress up, or more moderate intensity activities like riding tricycles, and more vigorous intensity activities like skipping and jumping helps young children grow up healthy
- However, only about one-third of kids’ physical activity during child care hours is done at moderate-to-vigorous intensity levels.6
Increasing physical activity in early care and education settings is a national health priority.7
- Only about one-third of physical activity that happens during a child’s time in an early care and education setting is done at moderate-to-vigorous intensity levels.6 Most opportunities should allow for moderate-to-vigorous intensity movements, like running.8
- Every day, early educators can offer multiple active play opportunities, like playing on a playground, in addition to structured activities, like playing tag.
- ✓Planning safe, fun outdoor activities that can occur in imperfect weather7,8,9and integrating physical activity into educational lessons can help children move more.4,10
- Young kids are generally physically active in short bursts,8,11 so offering a variety of activities and opportunities throughout the day can help young kids accumulate enough movement.
- While in early care and education settings, all young children should have about 15 minutes per hour of active and outdoor play opportunities (or about two hours per eight-hour day in care).4,8
Early care and education settings are important places for helping the children who spend time there to move more.11
- Having open spaces and accessible portable play equipment, like balls or soft building blocks, can promote physical activity for all children,4,12–14 even in smaller early care spaces.
- Children should have daily opportunities to play outside.4,8,13
- Early care educators can support physical activity through:
- ✓Modifying games and activities to help all children stay moving throughout the duration of the activity, including children with disabilities or lower fitness levels.15,16
- ✓Participating in physical activity with the children.* This motivates children to move,10,17 especially those who are less active.17
- ✓Sharing ideas for games to play or suggesting ways to go back into games to help children stay moving.17
- ✓Not taking physical activity opportunities away from children as a punishment.4,8
*Added benefit!: Initiating and engaging in physical activity with children can help educators be more physically active too. Being physically active reduces the risk of heart disease, type 2 diabetes, and depression and also leads to better sleep and less anxiety.3
Additional Resources
The following additional resources may be useful to:
✓Help children move more
- Stolley M. Hip Hop to Health Jr. SNAP-Ed Toolkit. Available at https://snapedtoolkit.org/interventions/programs/hip-hop-to-health-jr
- Go NAP SACC (Nutrition and Physical Activity Self-Assessment for Child Care). Available at https://gonapsacc.org
✓Provide more guidance on physical activity and young children
- Early Care and Education. Centers for Disease Control and Prevention. 2021. Available at https://www.cdc.gov/obesity/strategies/childcareece.html
- Physical Activity Guidelines for Americans, 2nd Edition. U.S. Department of Health and Human Services. 2018. Available at https://health.gov/sites/default/files/2019-09/Physical_Activity_Guidelines_2nd_edition.pdf
- Health Benefits of Physical Activity for Children. Centers for Disease Control and Prevention. 2022. Available at https://www.cdc.gov/physicalactivity/basics/adults/health-benefits-of-physical-activity-for-children.html
References
- Carson V, Lee EY, Hewitt L, et al. Systematic review of the relationships between physical activity and health indicators in the early years (0-4 years). BMC Public Health. 2017;17(5):854. doi:10.1186/s12889-017-4860-0
- Pate RR, Hillman CH, Janz KF, et al. Physical Activity and Health in Children Younger than 6 Years: A Systematic Review. Med Sci Sports Exerc. 2019;51(6):1282-1291. doi:10.1249/MSS.0000000000001940
- U.S. Department of Health and Human Services. Physical Activity Guidelines for Americans, 2nd Edition. U.S. Department of Health and Human Services; 2018:118. Accessed November 29, 2021. https://health.gov/sites/default/files/2019-09/Physical_Activity_Guidelines_2nd_edition.pdf
- Institute of Medicine. Early Childhood Obesity Prevention Policies. (Birch LL, Parker L, Burns A, eds.). The National Academies Press; 2011. doi:10.17226/13124
- Bruijns BA, Truelove S, Johnson AM, Gilliland J, Tucker P. Infants’ and toddlers’ physical activity and sedentary time as measured by accelerometry: a systematic review and meta-analysis. Int J Behav Nutr Phys Act. 2020;17(1):14. doi:10.1186/s12966-020-0912-4
- Tassitano RM, Weaver RG, Tenório MCM, Brazendale K, Beets MW. Physical activity and sedentary time of youth in structured settings: a systematic review and meta-analysis. Int J Behav Nutr Phys Act. 2020;17(1):160. doi:10.1186/s12966-020-01054-y
- Office of Disease Prevention and Health Promotion, Office of the Assistant Secretary for Health. Increase the proportion of child care centers where children aged 3 to 5 years do at least 60 minutes of physical activity a day — PA-R01. Accessed December 6, 2021. https://health.gov/healthypeople/objectives-and-data/browse-objectives/physical-activity/increase-proportion-child-care-centers-where-children-aged-3-5-years-do-least-60-minutes-physical-activity-day-pa-r01
- American Academy of Pediatrics, National Resource Center for Health and Safety in Child Care (U.S.), American Public Health Association, United States, eds. Caring for Our Children: National Health and Safety Performance Standards, Guidelines for Early Care, and Education Programs. Fourth edition. American Academy of Pediatrics; 2019.
- Timmons BW, Leblanc AG, Carson V, et al. Systematic review of physical activity and health in the early years (aged 0-4 years). Appl Physiol Nutr Metab Physiol Appl Nutr Metab. 2012;37(4):773-792. doi:10.1139/h2012-070
- Physical Activity Alliance. Physical Activity for Preschoolers during the COVID Pandemic. Published online April 2021. Accessed December 6, 2021. https://paamovewithus.org/wp-content/uploads/2021/04/PAA-Preschool-Covid-FINAL-04-13-2021.pdf
- Ruiz RM, Tracy D, Sommer EC, Barkin SL. A novel approach to characterize physical activity patterns in preschool-aged children. Obesity. 2013;21(11):2197-2203. doi:10.1002/oby.20560
- Hoyos-Quintero AM, García-Perdomo HA. Factors Related to Physical Activity in Early Childhood: A Systematic Review. J Phys Act Health. 2019;16(10):925-936. doi:10.1123/jpah.2018-0715
- Tonge KL, Jones RA, Okely AD. Correlates of children’s objectively measured physical activity and sedentary behavior in early childhood education and care services: A systematic review. Prev Med. 2016;89:129-139. doi:10.1016/j.ypmed.2016.05.019
- Terrón-Pérez M, Molina-García J, Martínez-Bello VE, Queralt A. Relationship Between the Physical Environment and Physical Activity Levels in Preschool Children: A Systematic Review. Curr Environ Health Rep. 2021;8(2):177-195. doi:10.1007/s40572-021-00318-4
- Physical Activity for Students With Special Needs. Action for Healthy Kids. Published September 6, 2018. Accessed December 6, 2021. https://www.actionforhealthykids.org/physical-activity-for-students-with-special-needs/
- Including All Children: Health for Kids With Disabilities. Action for Healthy Kids. Published September 4, 2018. Accessed December 6, 2021. https://www.actionforhealthykids.org/including-all-children-health-for-kids-with-disabilities/
- Kippe KO, Fossdal TS, Lagestad PA. An Exploration of Child–Staff Interactions That Promote Physical Activity in Pre-School. Front Public Health. 2021;9:998. doi:10.3389/fpubh.2021.607012
Suggested Citation
Get the Facts: Physical Activity is Key for Young Kids’ Health (Ages 3 through 5). Prevention Research Center on Nutrition and Physical Activity Team at the Harvard T.H. Chan School of Public Health, Boston, MA; May 2022.
Funding
This work is supported by The JPB Foundation and the Centers for Disease Control and Prevention (U48DP006376). The findings and conclusions are those of the author(s) and do not necessarily represent the official position of the Centers for Disease Control and Prevention or other funders. The information provided here is intended to be used for educational purposes. Links to other resources and websites are intended to provide additional information aligned with this educational purpose.
CHOICES Project Overview Fact Sheet
An overview of the challenge that the CHOICES Project works to address and our approach.