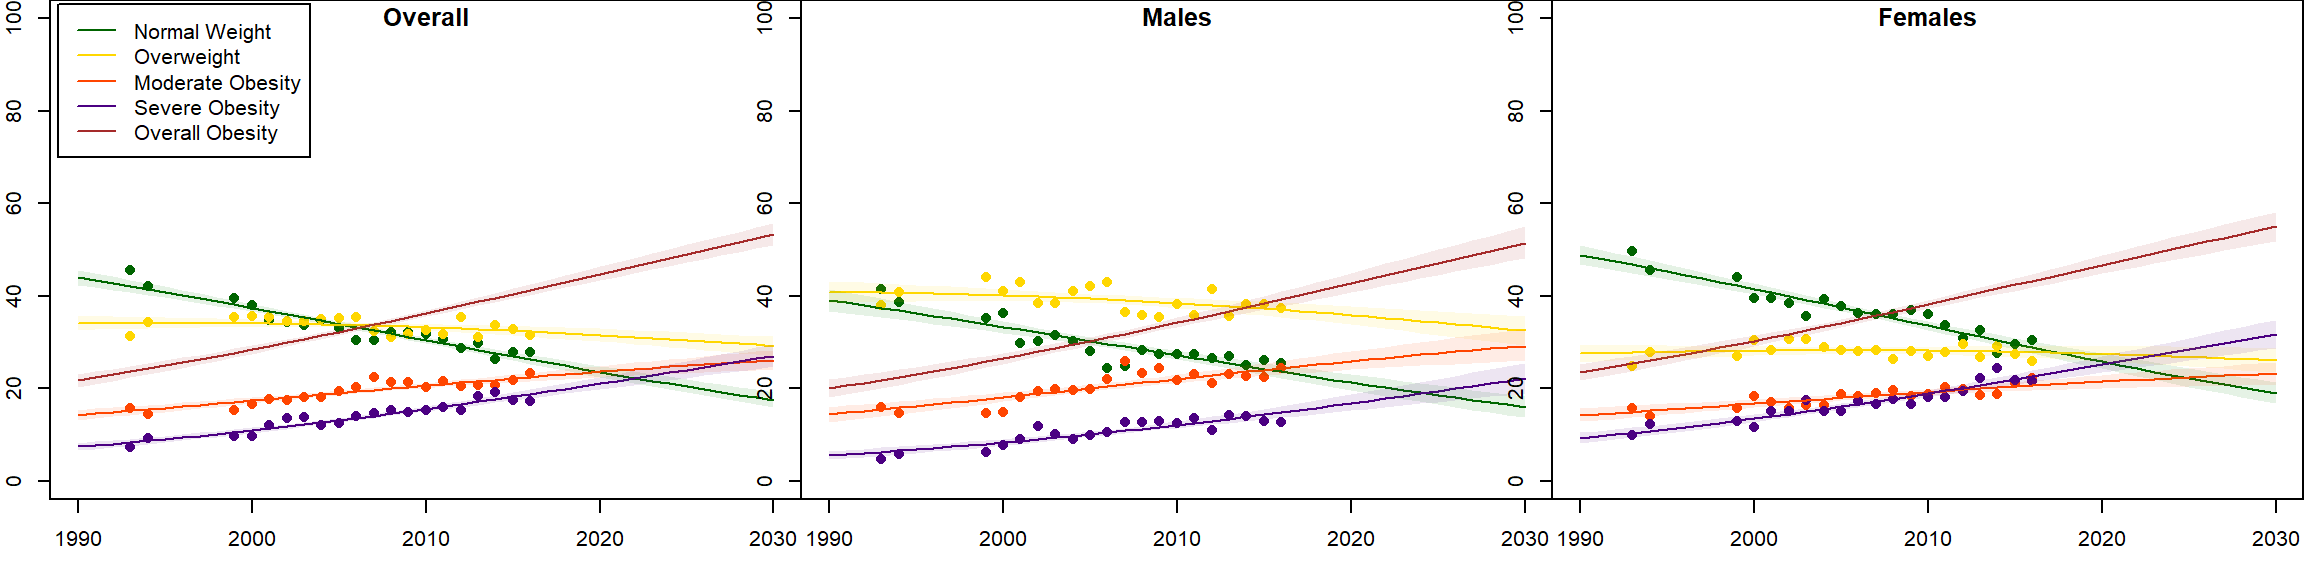
Obesity Prevalence
| Group | 1990 | 2000 | 2010 | 2020 | 2030 |
|---|---|---|---|---|---|
| Overall | 21.8 (20.4-23.1) | 28.4 (27.5-29.3) | 36.3 (35.6-37.0) | 44.8 (43.4-46.3) | 53.2 (51.0-55.7) |
| Males | 20.0 (18.1-21.9) | 26.5 (25.3-27.7) | 34.3 (33.3-35.3) | 42.8 (40.7-45.0) | 51.4 (48.2-55.0) |
| Females | 23.6 (21.7-25.4) | 30.3 (29.2-31.4) | 38.2 (37.3-39.1) | 46.7 (44.8-48.7) | 55.0 (51.9-58.1) |
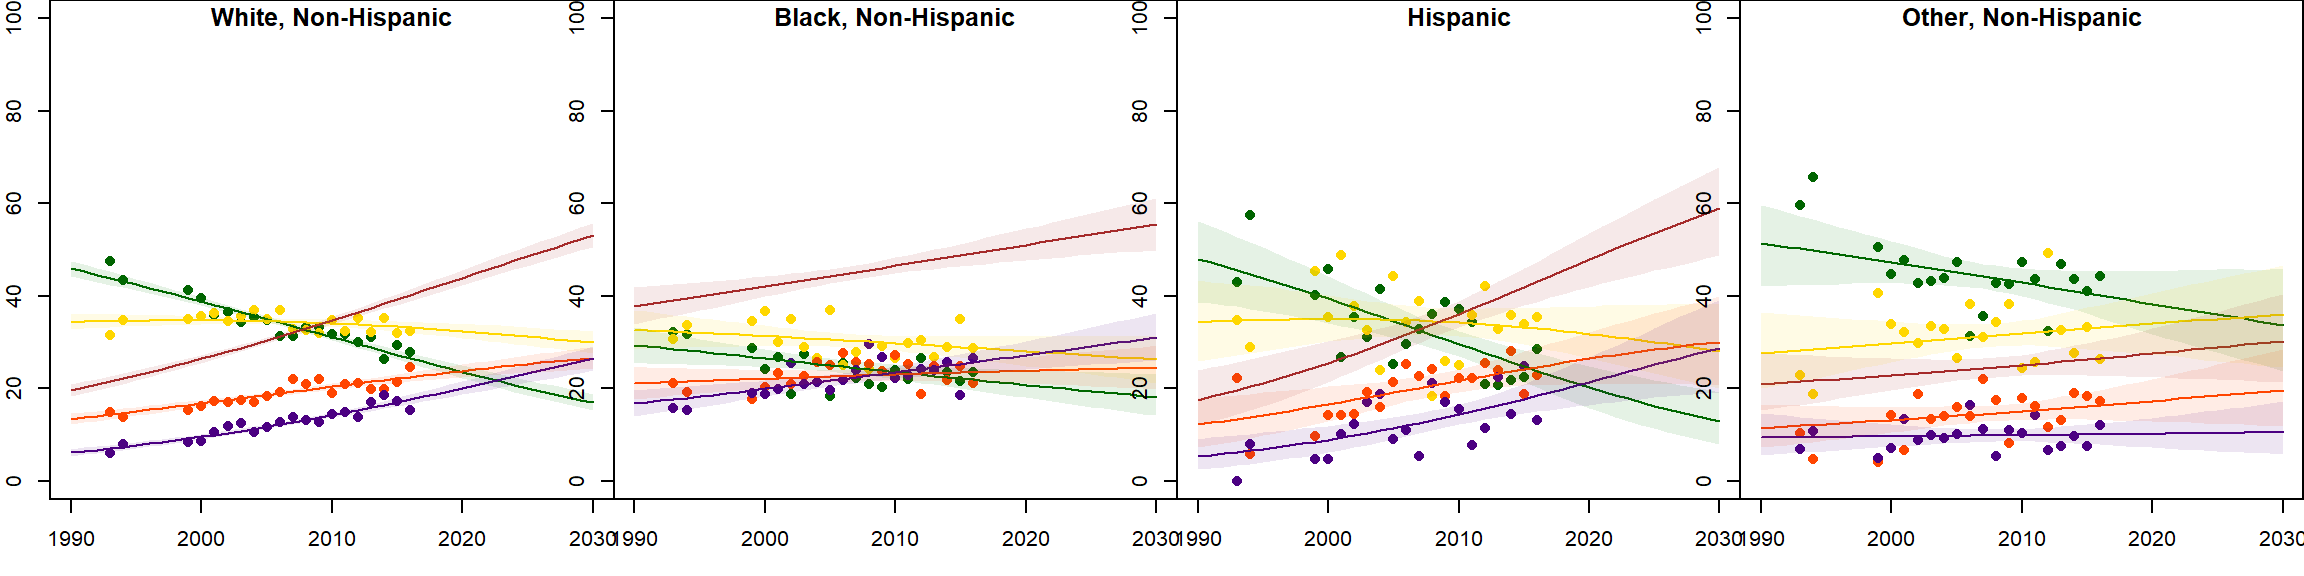
| White, non-Hispanic | 19.6 (18.3-21.0) | 26.5 (25.6-27.3) | 34.8 (34.0-35.5) | 43.9 (42.3-45.6) | 53.1 (50.6-55.8) |
| Black, non-Hispanic | 37.9 (33.9-42.0) | 42.1 (39.9-44.2) | 46.6 (45.0-48.3) | 51.1 (47.8-54.5) | 55.5 (50.0-61.2) |
| Hispanic | 17.6 (12.1-24.0) | 25.6 (21.4-30.3) | 36.1 (33.3-38.9) | 47.9 (41.9-53.5) | 58.9 (48.7-67.7) |
| Other, non-Hispanic | 21.0 (15.3-27.7) | 22.9 (19.6-26.5) | 25.1 (22.9-27.2) | 27.6 (22.4-33.0) | 30.3 (21.4-40.4) |
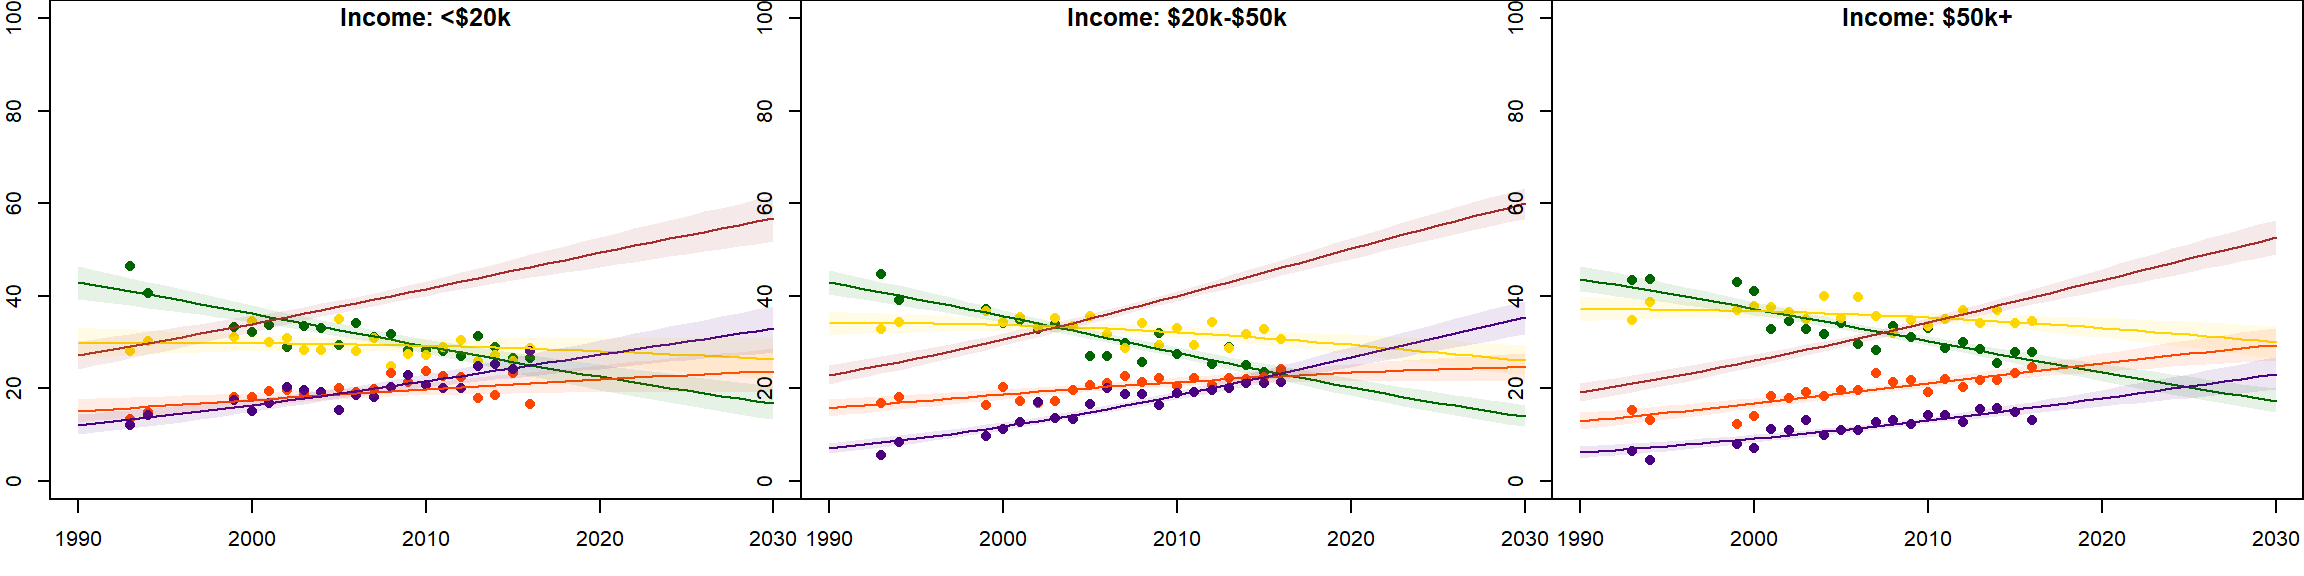
| Income: Less than $20k | 27.2 (24.3-30.3) | 34.0 (32.2-35.8) | 41.6 (40.0-43.2) | 49.4 (46.3-52.6) | 56.8 (51.9-61.7) |
| Income: $20k to $50k | 22.9 (21.0-25.0) | 30.6 (29.3-32.0) | 40.0 (38.9-41.0) | 50.2 (48.0-52.5) | 60.0 (56.7-63.3) |
| Income: $50k or more | 19.2 (17.2-21.2) | 26.1 (24.7-27.4) | 34.3 (33.3-35.3) | 43.4 (41.2-45.9) | 52.6 (49.0-56.5) |
NOTES:
• Data shown in the table are estimated means with 95% confidence intervals (CIs)
• Obesity is defined as a BMI value that is greater than or equal to 30
• Severe obesity is defined as a BMI value that is greater than or equal to 35
Severe Obesity Prevalence
| Group | 1990 | 2000 | 2010 | 2020 | 2030 |
|---|---|---|---|---|---|
| Overall | 7.5 (6.7-8.3) | 11.0 (10.4-11.6) | 15.6 (15.1-16.2) | 21.1 (19.8-22.5) | 27.1 (24.8-29.6) |
| Males | 5.6 (4.7-6.5) | 8.4 (7.7-9.1) | 12.2 (11.5-13.0) | 16.9 (15.2-18.7) | 22.2 (19.0-25.6) |
| Females | 9.3 (8.2-10.5) | 13.5 (12.8-14.4) | 18.9 (18.2-19.7) | 25.2 (23.5-27.0) | 31.7 (28.7-34.8) |
| White, non-Hispanic | 6.2 (5.5-7.0) | 9.6 (9.0-10.2) | 14.3 (13.7-14.8) | 20.1 (18.7-21.5) | 26.5 (23.9-29.2) |
| Black, non-Hispanic | 16.8 (14.0-19.7) | 20.0 (18.3-21.8) | 23.5 (22.1-24.9) | 27.2 (24.2-30.3) | 31.1 (26.1-36.2) |
| Hispanic | 5.4 (2.6-9.1) | 9.0 (6.2-12.0) | 14.4 (12.3-16.5) | 21.4 (16.4-26.9) | 28.8 (19.3-39.1) |
| Other, non-Hispanic | 9.5 (5.6-14.7) | 9.7 (7.5-12.3) | 9.9 (8.6-11.3) | 10.2 (7.2-13.6) | 10.6 (5.8-17.3) |
| Income: Less than $20k | 12.1 (10.0-14.4) | 16.4 (15.0-17.8) | 21.6 (20.3-23.0) | 27.3 (24.3-30.4) | 33.0 (27.8-37.8) |
| Income: $20k to $50k | 7.1 (6.0-8.3) | 11.8 (11.0-12.7) | 18.6 (17.7-19.5) | 26.8 (24.7-29.0) | 35.3 (31.7-39.0) |
| Income: $50k or more | 6.2 (5.0-7.5) | 9.2 (8.4-10.1) | 13.2 (12.5-13.8) | 17.9 (16.2-19.7) | 23.2 (19.8-26.8) |
NOTES:
• Data shown in the table are estimated means with 95% confidence intervals (CIs)
• Obesity is defined as a BMI value that is greater than or equal to 30
• Severe obesity is defined as a BMI value that is greater than or equal to 35
All tables and charts based on data from:
Ward ZJ, Bleich SN, Cradock AL, Barrett JL, Giles CM, Flax CN, Long MW, Gortmaker SL. Projected U.S. State-Level Prevalence of Adult Obesity and Severe Obesity. N Engl J Med. 2019;381:2440-50. doi: 10.1056/NEJMsa1909301