The information in this report is intended to provide educational information on the cost-effectiveness of sugary drink excise taxes.
Executive Summary
 In California, health disparities and inequities persist for specific subsets of the population – the reasons for this are deep-seated and multi-faceted. Sugary drink consumption is one health behavior for which disparities exist, and it has been linked to excess weight gain, obesity, and the incidence of type 2 diabetes, heart disease, and cancer. Federal, state, and local governments have considered excise taxes on sugary drinks to reduce consumption, reduce obesity and associated chronic disease, and provide a new source of government revenue.1,2,3 In California, statewide legislative measures to introduce sugary drink excise taxes have been proposed for a number of years in efforts to improve the health of Californians and reduce inequities, but none have passed.4
We modeled the implementation of a state excise tax on sugary drinks in California at a tax rate of $0.02/ounce. CHOICES cost-effectiveness analysis compared the costs and outcomes over a 10-year time horizon (2020-2030) of implementing a tax with the costs and outcomes associated with not implementing a tax.
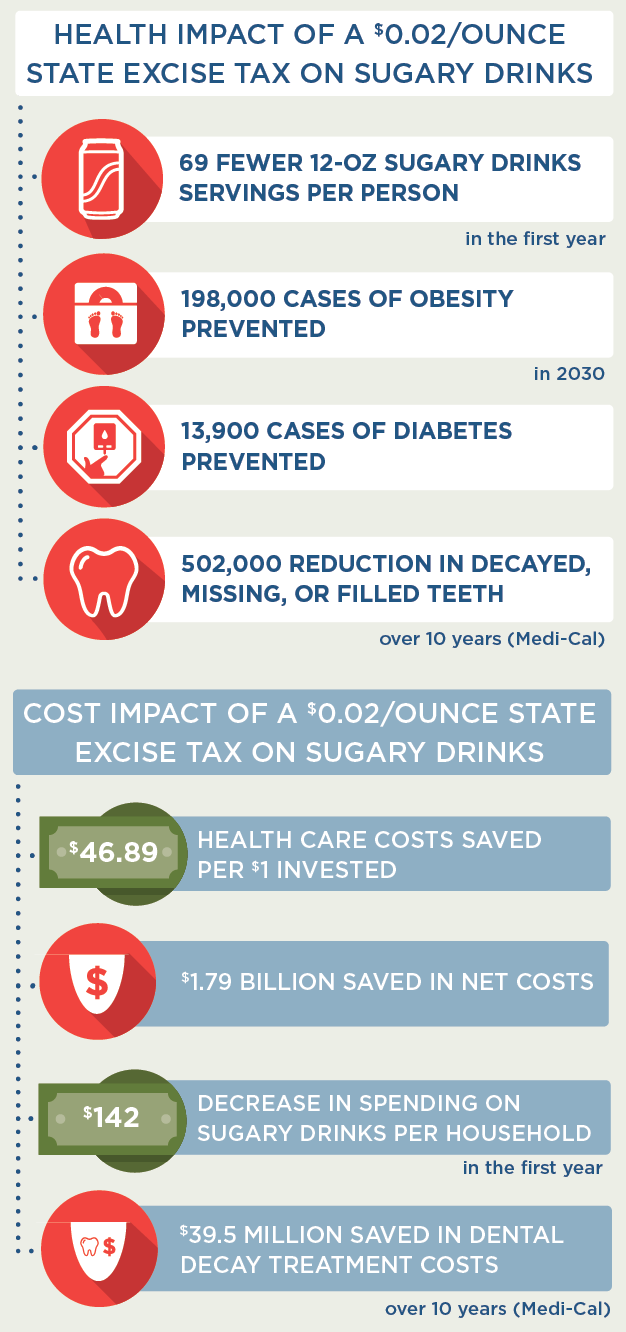
The tax modeled is projected to be cost-saving (that is, the tax saves more in future health care costs than it costs to implement even absent the potential revenues). The tax is projected to decrease sugary drink consumption among California residents, prevent nearly 200,000 cases of obesity, and save more than 1.8 billion dollars in health care costs. People who consume sugary drinks are expected to spend less on these drinks with the tax in place. We also project that non-Latino Black/African American and Latino California residents will experience even greater health benefits than the average resident after the tax is implemented. These results are summarized below and in the complete report.
Background
In California, health disparities and inequities persist for specific subsets of the population – the reasons for this are deep-seated and multi-faceted including systems that perpetuate the unequal distribution of power and resources along racial lines.5 Overconsumption of added sugars is common, with more than half of the United States population ages two years and older exceeding the daily recommended limit for added sugars put forth in the 2015-2020 Dietary Guidelines for Americans.6 Sugary drinks (defined as all drinks with added caloric sweeteners) are the number one source of added sugars that Americans consume.6
According to recent estimates, 40% of California residents drink at least one serving of sugary drinks daily.7 Higher than average sugary drink consumption levels are common among Latino and Black/African American Californians.7 In 2018, the beverage industry spent $1 billion to advertise sugary drinks in television, digital platforms (internet and mobile), radio, magazines, newspapers, coupons, and outdoor venues in order to drive preferences and purchases of unhealthy beverages.8 Beverage companies frequently target their sugary drink advertising towards youth, and are more likely to target Black/African American and Latino youth. Additionally, Black/African American and Latino populations are less likely to be the audience for marketing of healthy drinks like water.8
Strong evidence links increased consumption of sugary drinks to higher risk for obesity and other diseases that are tied to what people eat, such as type 2 diabetes,9,10 and the prevalence of these diseases is higher among people with lower income and Latino and Black/African American Californians.7,11 An estimated 37% of adults11 and 21% of youth12 in California have obesity. If current trends continue, 42% of adults in the state will have obesity by 2030.11
Taxes have emerged as a promising strategy to reduce consumption of sugary drinks. In addition to the potential of a sugary drink tax to reduce obesity, it has cost implications as well. This report models the projected effect of a sugary drink excise tax on health, disease outcomes, and health care cost savings over the next decade.
Key Terms
|
Projected Impact of a Sugary Drink Excise Tax in California
We modeled implementation of a California excise tax on sugary drinks, at a tax rate of $0.02/ounce. All drinks with added caloric sweeteners were considered to be taxed, while 100% juice, milk products, and beverages with fewer than 25 kcals per 12 fluid ounces were considered exempt.
Results: What did we find?
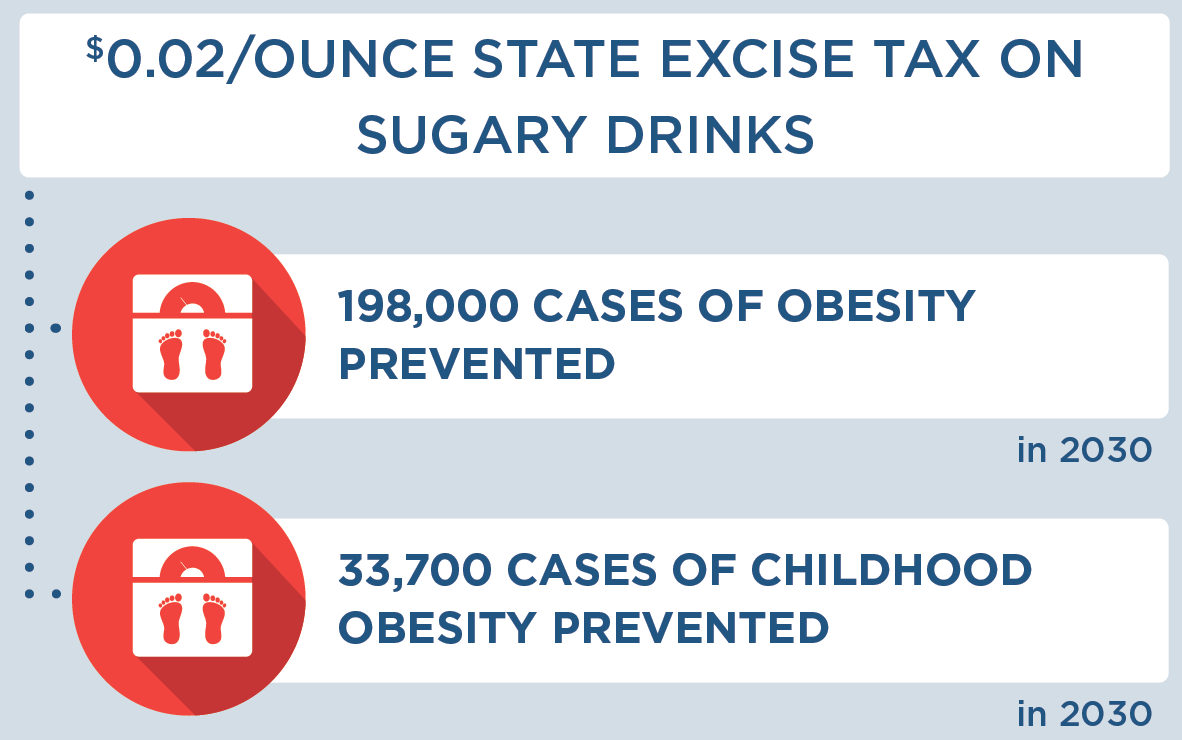
We project that implementation of a state excise tax on sugary drinks only, at a tax rate of $0.02/ounce, has a 100% likelihood of being cost-saving. It will prevent more than 195,000 cases of childhood and adult obesity, prevent new cases of diabetes, increase healthy life years, improve health equity, and save more in future health care costs than it will cost to implement. Implementing the tax could also serve as a powerful social signal to reduce sugar consumption. Model results are presented as the most likely estimate as well as a likely range. The likely range is an uncertainty interval that is estimated by considering uncertainty from data sources and population projections and calculating a central range in which 95 percent of these model results fell.
How many people would be affected by the tax?
This can be thought of as reach or the number of people affected by the strategy. Based on our modeling, the table below presents the estimated number of people affected by the tax in the first year and the number of people affected by the tax over ten years.
| Number of people affected by the tax |
Likely Range |
|
|
First Year Population Reach |
38.0 million |
37.9 million; 38.1 million |
|
Ten Year Population Reach |
42.2 million |
42.0 million; 42.5 million |
The Likely Range is a 95% uncertainty interval estimated by running the model 1,000 times, taking into account uncertainty from data sources and population projections, and calculating a central range in which 95 percent of these model results fell.
What effect would the tax have on sugary drink consumption and spending?
Compared to projections of sugary drink consumption without a tax, the tax is projected to result in lower levels of sugary drink consumption. We project a 90% likelihood that individuals and households who purchase sugary drinks will spend less on sugary drinks after the tax is implemented, even though sugary drink prices will be higher with the tax.
| Impact of the tax on sugary drink consumption & spending |
Likely Range |
|
|
Decrease in 12-oz Servings of Sugary Drinks per Person in the First Year |
69 |
42; 125 |
|
Decrease in Spending on Sugary Drinks in the First Year per Person Consuming Sugary Drinks |
$48 |
-$10; $170 90% likelihood of decrease in spending |
|
Decrease in Spending on Sugary Drinks in the First Year per Household |
$142 |
-$29; $502 90% likelihood of decrease in spending |
|
Decrease in Spending on Sugary Drinks in the First Year Overall in California |
$1.09 billion |
-$220 million; $3.88 billion 90% likelihood of decrease in spending |
The Likely Range is a 95% uncertainty interval estimated by running the model 1,000 times, taking into account uncertainty from data sources and population projections, and calculating a central range in which 95 percent of these model results fell.
Average Annual Pre-Tax Sugary Drink Consumption Per Person in California by Race/Ethnicity
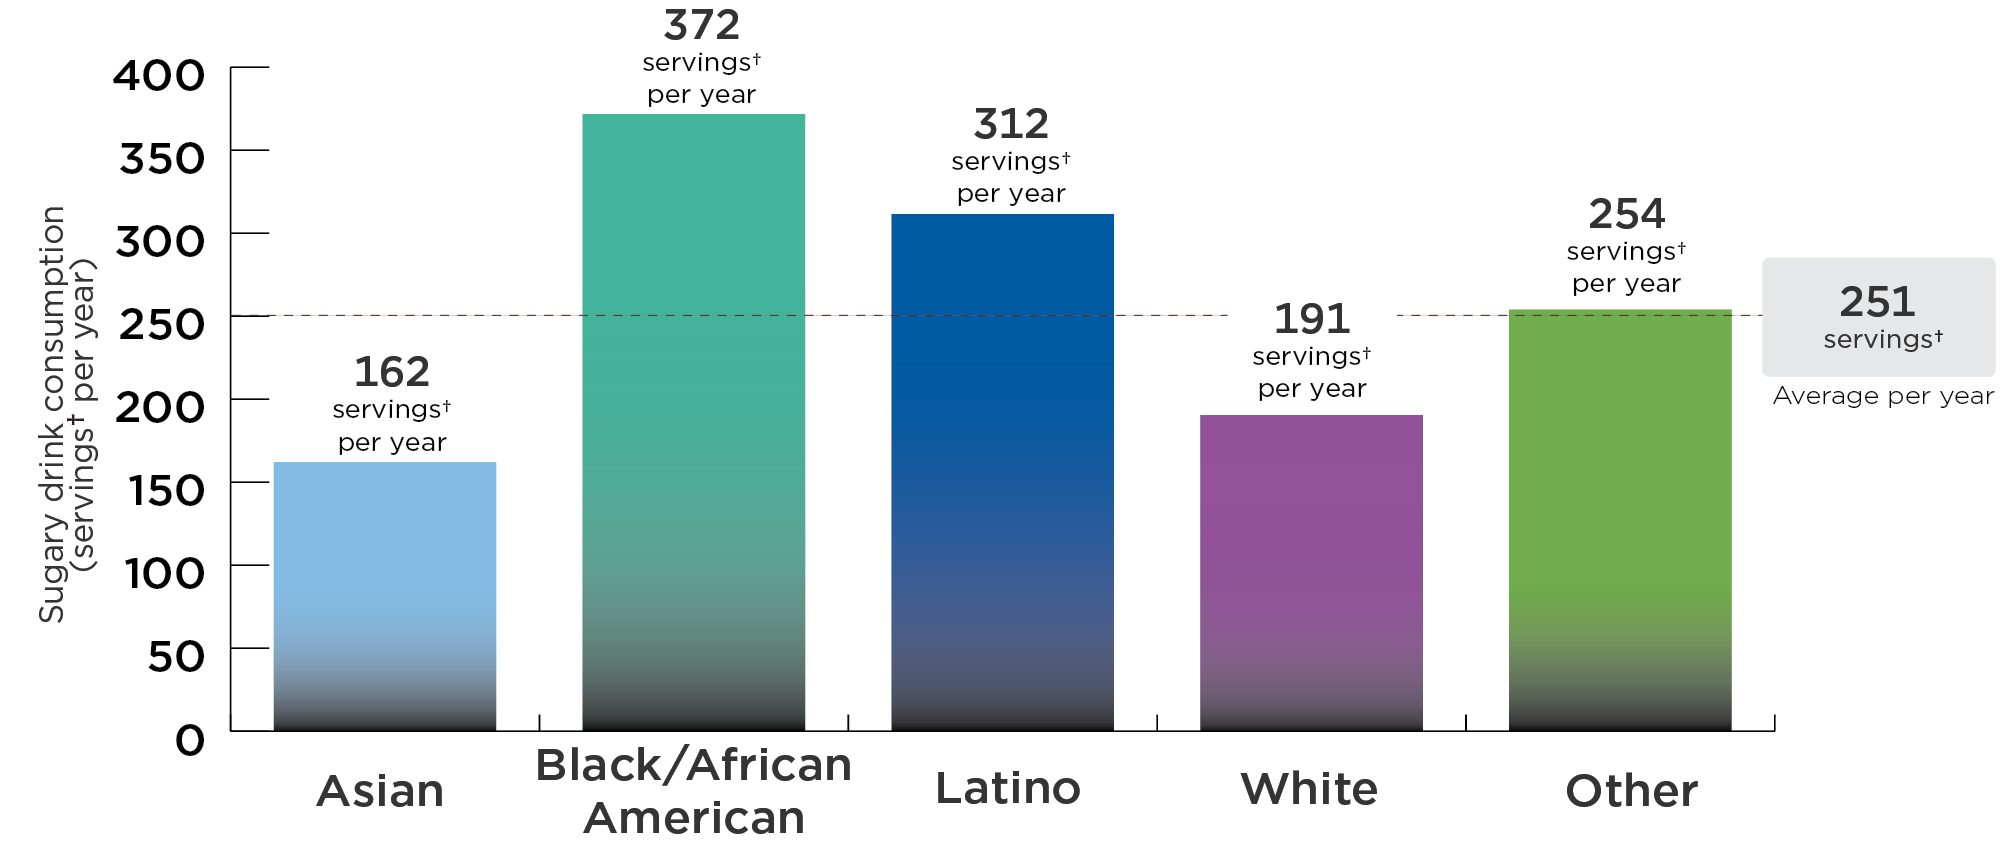
DATA SOURCES: California Health Interview Survey 2011-2017, NHANES 2011-2016, UConn Rudd Center for Food Policy & Obesity Sugary Drink Tax Calculator 2020; Analysis by CHOICES Project, 2020.
✝Each serving is 12 ounces.
While Californians, on average, consume 251 servings of sugary drinks each in a year, higher than average sugary drink consumption levels are common among Latino and Black/African American Californians.
Post-Tax Decrease in Sugary Drink Consumption Per Person in California by Race/Ethnicity*
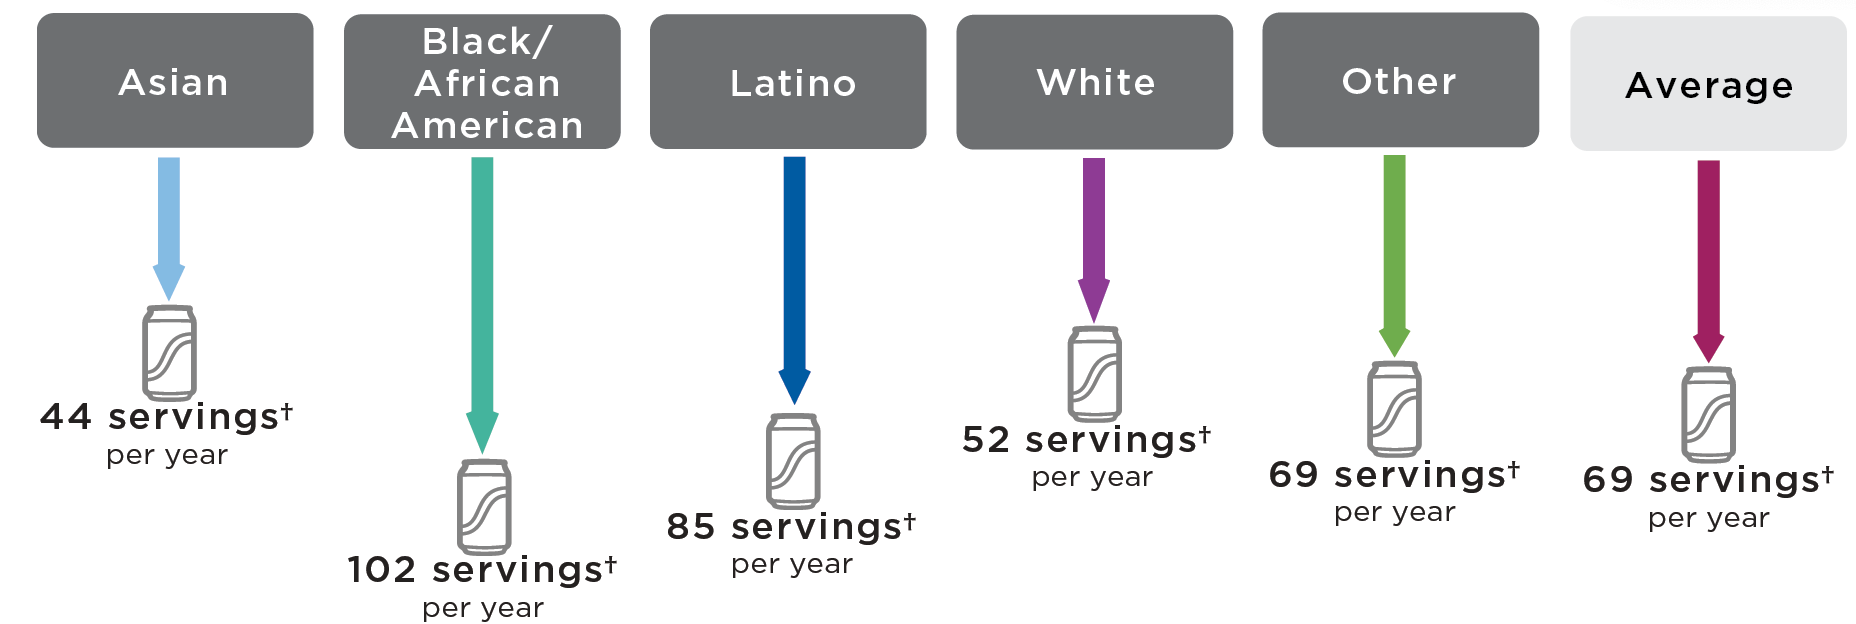
*In the first year following an excise tax of $0.02/ounce on sugary drinks.
✝Each serving is 12 ounces.
With a tax, sugary drink consumption would decrease the most among Latino and Black/African American Californians. On average, each Latino Californian would reduce consumption by 85 servings per year and each Black/African American Californian would reduce consumption by 102 servings per year.
| Impact of the tax on sugary drink consumption, by race and ethnicity | |||||
|---|---|---|---|---|---|
|
Outcome |
Asian Mean Likely Range |
Black/African American Mean Likely Range |
Latino Mean Likely Range |
White Mean Likely Range |
Other* Mean Likely Range |
|
Decrease in 12-oz Servings of Sugary Drinks per Person in the First Year |
44 27; 81 |
102 62; 186 |
85 52; 154 |
52 32; 98 |
69 42; 124 |
The Likely Range is a 95% uncertainty interval estimated by running the model 1,000 times, taking into account uncertainty from data sources and population projections, and calculating a central range in which 95 percent of these model results fell.
*Other includes people of Native Hawaiian and Pacific Islander, American Indian and Alaska Native, and two or more races.
What effect would the tax have on obesity and related health outcomes, overall and by race/ethnicity?
Compared to projections of obesity and related health outcomes without a tax, the tax is projected to result in fewer cases of obesity and fewer deaths over the 10-year period under consideration. Under the proposed tax, Black/African American Californians will experience a 39% higher than average reduction in obesity prevalence, and Latino Californians will experience a 33% higher than average reduction in obesity prevalence.
| Impact of the tax on obesity and related health outcomes |
Likely Range |
|
|
Quality Adjusted Life Years (QALYs) Gained Over 10 Years |
58,200 |
25,000; 130,000 |
|
Years of Life Gained Over 10 Years |
14,600 |
5,410; 34,500 |
|
Deaths Prevented Over 10 Years* |
4,280 |
1,680; 10,000 |
|
Years with Obesity Prevented Over 10 Years |
1,410,000 |
696,000; 2,770,000 |
|
Cases of Obesity Prevented in 2030* |
198,000 |
96,700; 394,000 |
|
Cases of Childhood Obesity Prevented in 2030* |
33,700 |
12,500; 74,800 |
The Likely Range is a 95% uncertainty interval estimated by running the model 1,000 times, taking into account uncertainty from data sources and population projections, and calculating a central range in which 95 percent of these model results fell.
Costs and health outcomes are discounted at 3% per year, unless otherwise noted. Discounting estimates the present value of costs and health outcomes that are spent or received in the future, given that they are worth more today than they would be tomorrow.
*Not discounted.
Pre-Tax Obesity Prevalence in California by Race/Ethnicity
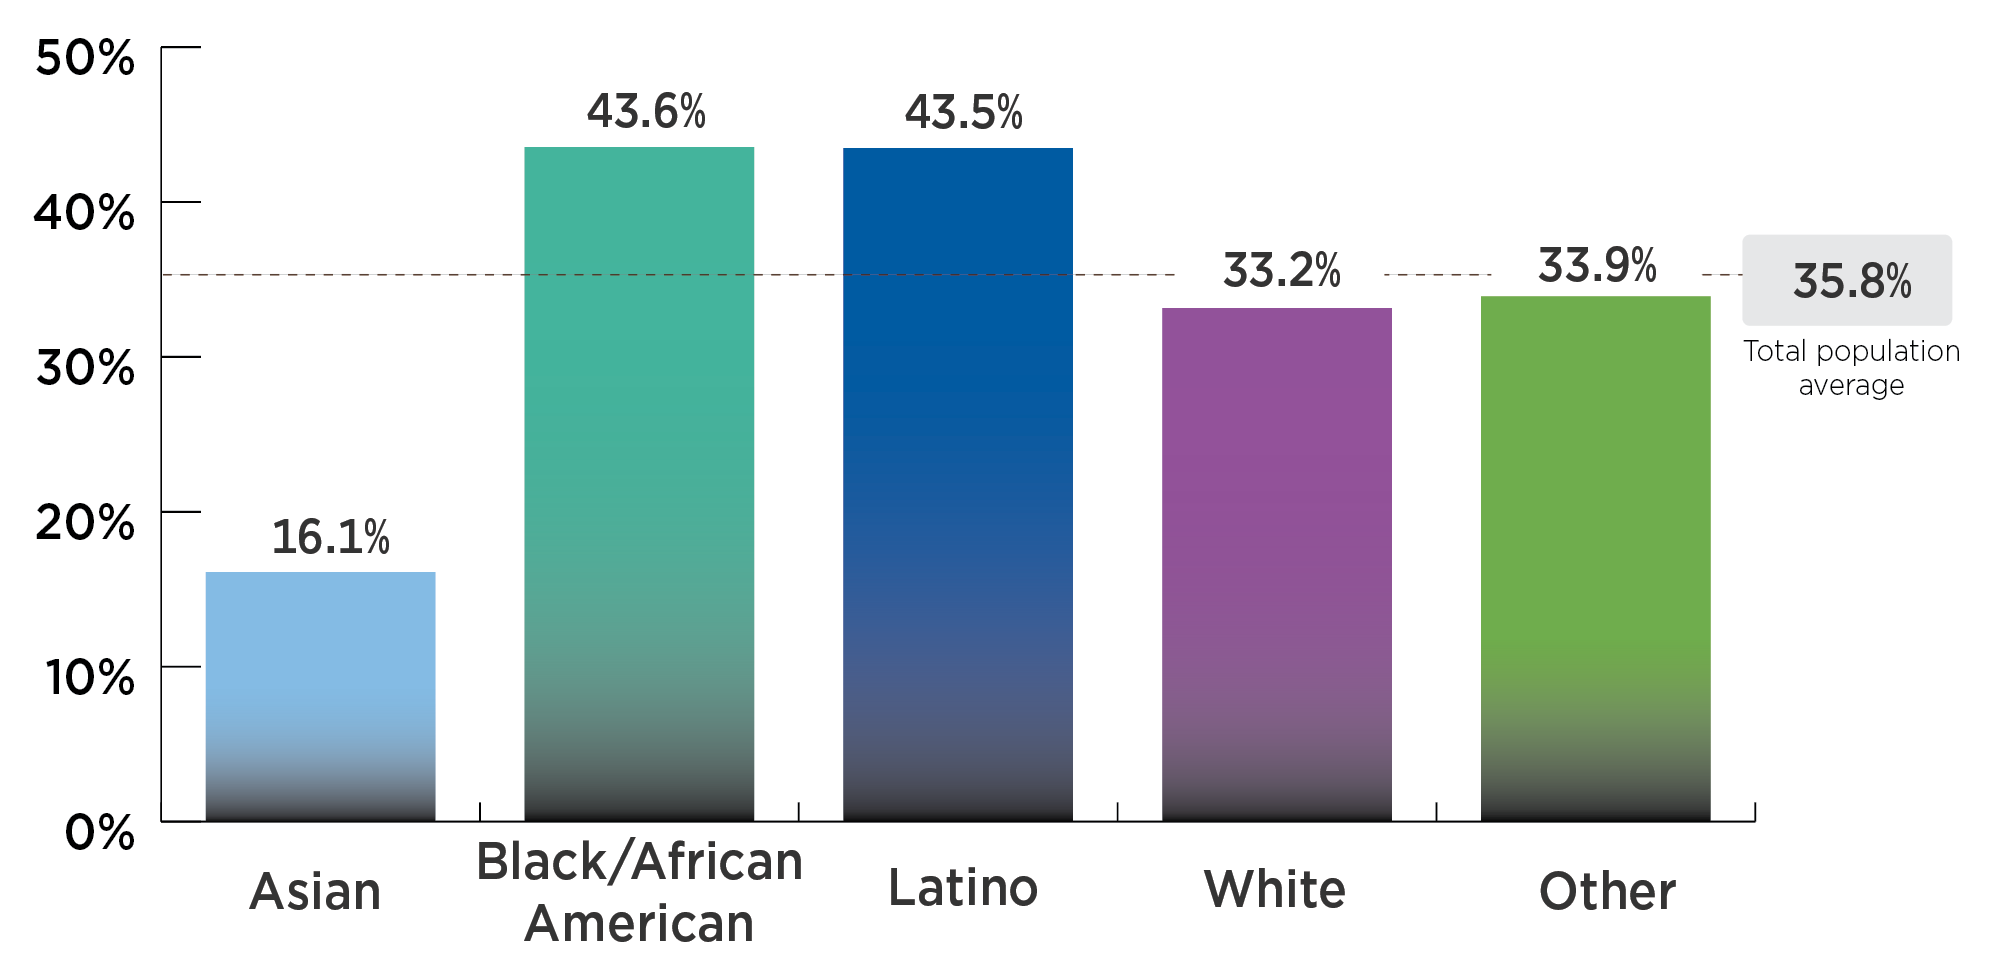
DATA SOURCES: California FitnessGram 2013-2017, NHANES 2011-2016, NSCH 2003-2018; Analysis by CDPH and the CHOICES Project, 2020.
Nearly half of Latino (43.5%) and Black/African American (43.6%) Californians have obesity, while smaller percentages of Asian (16.1%), White (33.2%), and Californians of another race (33.9%) have obesity.
Post-Tax Cases of Obesity Prevented in 2030 in California by Race/Ethnicity*
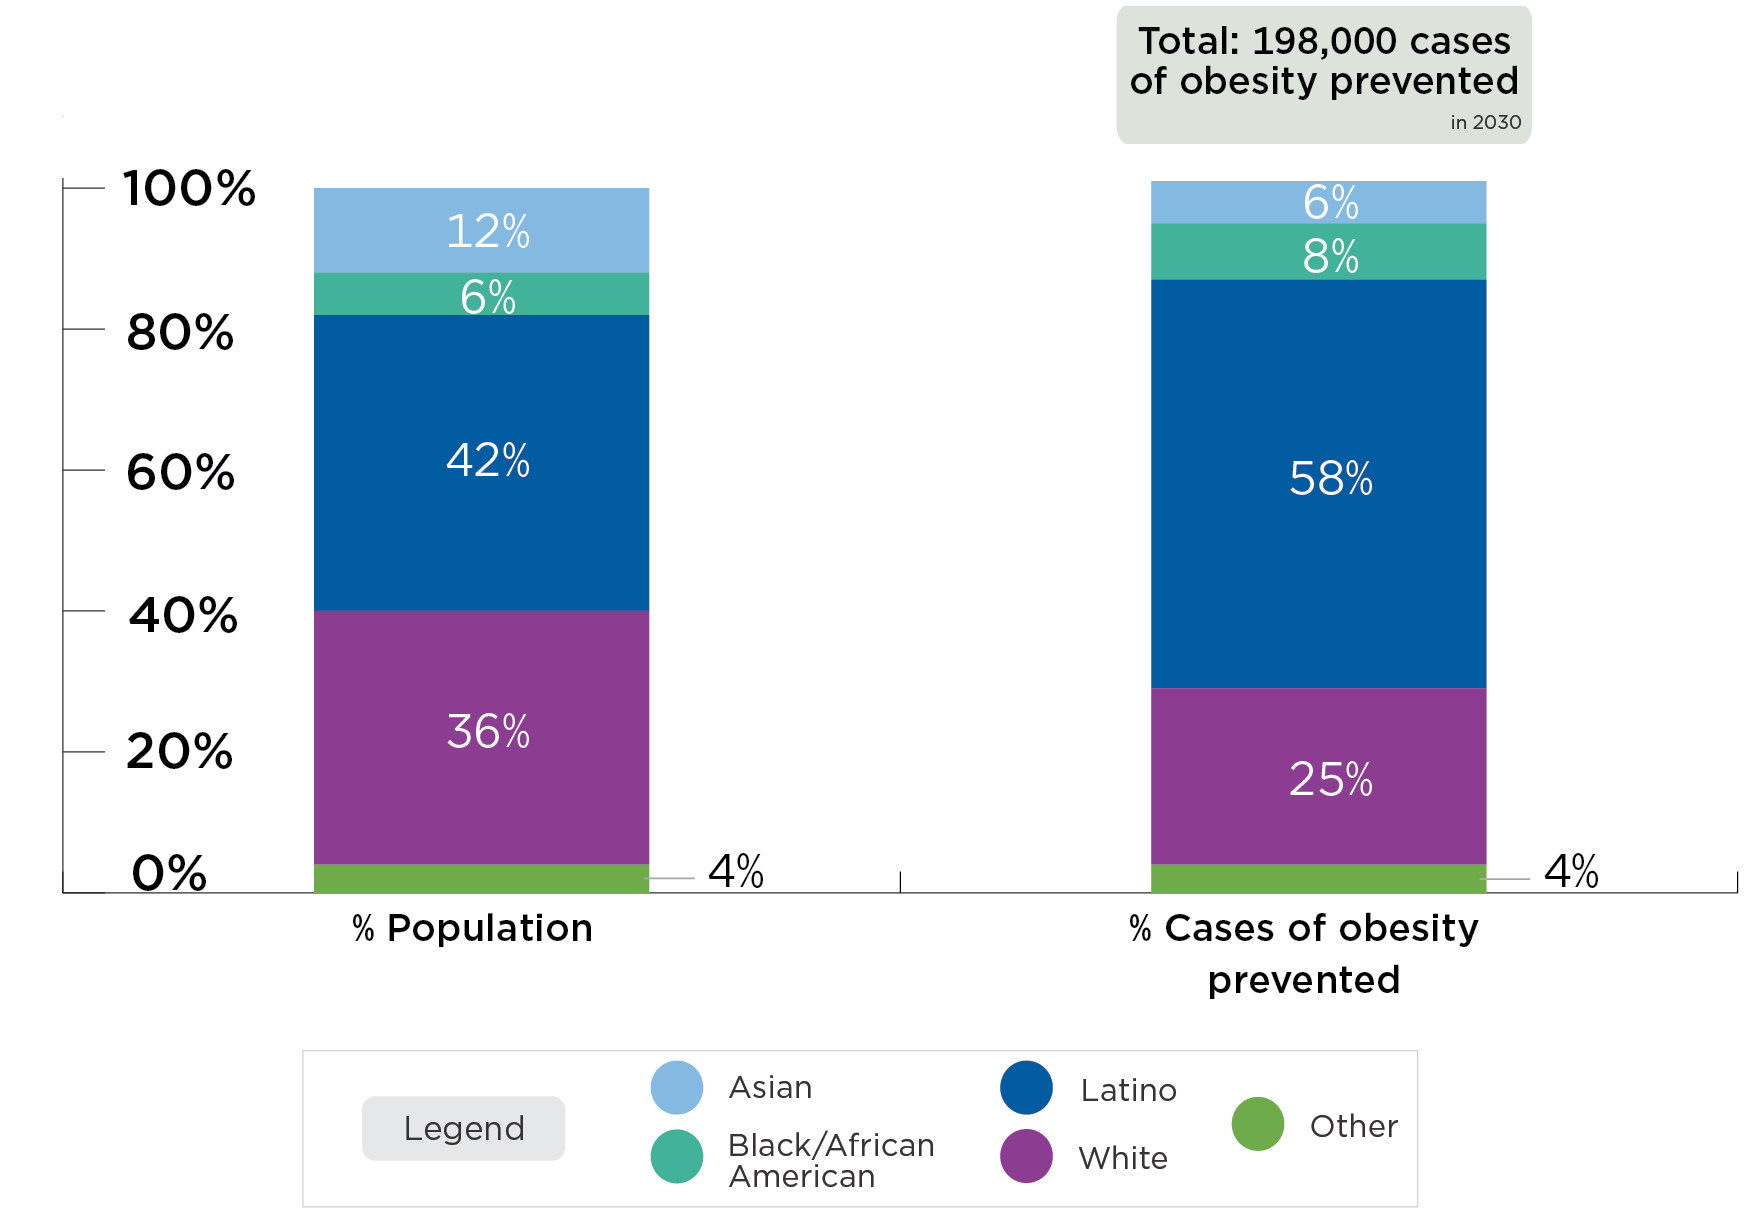
*With an excise tax of $0.02/ounce on sugary drinks.
A tax in California could prevent 198,000 cases of obesity in 2030. 58% of prevented obesity cases will be among Latino Californians, while they represent 42% of the population. 8% of prevented obesity cases will be among Black/African American Californians, while they represent 6% of the population.
| Impact of the tax on behavior and health, by race/ethnicity | |||||
|
Outcome |
Asian Mean Likely Range |
Black/African American Mean Likely Range |
Latino Mean Likely Range |
White Mean Likely Range |
Other† Mean Likely Range |
|
QALYS Gained Over 10 Years |
3,560 1,490; 8,160 |
5,100 1,990; 11,300 |
28,700 12,600; 64,200 |
18,900 7,810; 42,600 |
1,910 818; 4,230 |
|
Years of Life Gained Over 10 Years |
893 128; 2,400 |
1,820 381; 4,470 |
5,330 1,720; 12,800 |
6,020 2,040; 14,900 |
506 0; 1,490 |
|
Years with Obesity Prevented Over 10 Years |
80,800 39,800; 159,000 |
110,000 53,300; 218,000 |
820,000 407,000; 1.6 million |
354,000 159,000; 751,000 |
47,100 23,300; 89,700 |
|
Cases of Obesity Prevented in 2030* |
12,700 5,960; 26,500 |
15,100 7,130; 30,700 |
114,000 56,300; 218,000 |
49,800 22,400; 106,000 |
7,050 3,430; 13,500 |
|
Cases of Childhood Obesity Prevented in 2030* |
1,700 571; 3,980 |
2,920 1,060; 6,560 |
24,200 8,920; 52,900 |
3,610 1,240; 8,740 |
1,260 428; 2,920 |
The Likely Range is a 95% uncertainty interval estimated by running the model 1,000 times, taking into account uncertainty from data sources and population projections, and calculating a central range in which 95 percent of these model results fell.
Costs and health outcomes are discounted at 3% per year, unless otherwise noted. Discounting estimates the present value of costs and health outcomes that are spent or received in the future, given that they are worth more today than they would be tomorrow.
*Not discounted.
✝Other includes people of non-Latino ethnicity and Native Hawaiian and Pacific Islander, American Indian and Alaska Native, and two or more races.
How much would the tax cost to implement?
There are initial and ongoing costs to implementing the tax. To implement the strategy, the California Department of Tax and Fee Administration would perform several administrative activities, including identifying and notifying taxpayers, revising manuals and tax return documents and systems, processing tax statements, and conducting audits. Businesses would also need to prepare tax statements and participate in audits, which would require labor from private tax accountants. Cost information was drawn from tax programs that were previously implemented in California13 and from planned or implemented excise taxes on sugary drinks in other states and localities.14 The cost and benefit estimates do not include expected tax revenue (discussed below). Below we include annual and 10-year implementation costs.
| Costs |
Likely Range |
|
|
Annual Implementation Cost |
$3.9 million |
$2.69 million; $4.99 million |
|
Annual Implementation Cost per Person |
$0.10 |
$0.07; $0.13 |
|
Total Intervention Implementation Cost Over 10 Years |
$39.0 million |
$26.9 million; $49.9 million |
The Likely Range is a 95% uncertainty interval estimated by running the model 1,000 times, taking into account uncertainty from data sources and population projections, and calculating a central range in which 95 percent of these model results fell.
Costs and health outcomes are discounted at 3% per year, unless otherwise noted. Discounting estimates the present value of costs and health outcomes that are spent or received in the future, given that they are worth more today than they would be tomorrow.
How much would the tax save in health care costs compared to what it costs to implement?
The estimated reduction in obesity attributable to the tax leads to lower projected health care costs, offsetting tax implementation costs and resulting in a net cost savings. The difference between total health care costs with no strategy and lower health care costs with a strategy represents health care costs saved; these savings can be compared to the cost of implementing the tax to arrive at the metric of health care costs saved per $1 invested.
| Costs |
Likely Range |
|
|
Health Care Costs Saved Over 10 Years |
$1.83 billion |
$783 million; $4.06 billion |
|
Net Costs Difference Over 10 Years |
-$1.79 billion |
-$4.03 billion; -$740 million |
|
Health Care Costs Saved per $1 Invested Over 10 Years |
$46.89 |
$19.82; $118.76 |
The Likely Range is a 95% uncertainty interval estimated by running the model 1,000 times, taking into account uncertainty from data sources and population projections, and calculating a central range in which 95 percent of these model results fell.
Costs and health outcomes are discounted at 3% per year, unless otherwise noted. Discounting estimates the present value of costs and health outcomes that are spent or received in the future, given that they are worth more today than they would be tomorrow.
What would the impact of the tax be on Medi-Cal* spending?
Based on the projected reduction in adult obesity prevalence due to the tax (compared to what prevalence would be without the tax), adult obesity-related Medi-Cal expenditures in California are estimated to decrease. This does not include potential reductions in child obesity-related expenditures, and may be an underestimate if adults utilizing Medi-Cal have higher than average health care costs of obesity.15 A previous analysis found that 12.2% of adult Medi-Cal expenditures were due to obesity.16 We estimate that, in California, obesity accounted for $8.9 billion of $73.3 billion total adult Medi-Cal expenditures in 2019.16,17 This assumes that 74% of all Medi-Cal payments are for adults.18 The state paid 37% of total Medi-Cal expenditures in 2019,17 so we estimate that the state paid $3.3 billion in adult obesity-related Medi-Cal expenditures.
*Medi-Cal is California’s Medicaid program
| Medi-Cal Spending |
Likely Range |
|
|
Reduction in Annual Adult Obesity-Related Medi-Cal Expenditures (Paid by State) |
$17.9 million |
$8.19 million; $38.5 million |
|
Reduction in Total Annual Adult Obesity-Related Medi-Cal Expenditures (Paid by State and Federal) |
$48.3 million |
$22.1 million; $104 million |
The Likely Range is a 95% uncertainty interval estimated by running the model 1,000 times, taking into account uncertainty from data sources and population projections, and calculating a central range in which 95 percent of these model results fell.
Costs and health outcomes are discounted at 3% per year, unless otherwise noted. Discounting estimates the present value of costs and health outcomes that are spent or received in the future, given that they are worth more today than they would be tomorrow.
What are the key cost-effectiveness metrics?
Since we project that the tax saves more in future health care costs than it costs to implement, there is a 100% likelihood that the tax would be cost-saving.
|
Cost-effectiveness metrics |
|
|
Cost per Year with Obesity Prevented Over 10 Years |
Cost-saving* |
|
Cost per QALY Gained Over 10 Years |
Cost-saving* |
|
Cost per YL Gained Over 10 Years |
Cost-saving* |
|
Cost per Death Averted Over 10 Years |
Cost-saving* |
Costs and health outcomes are discounted at 3% per year, unless otherwise noted. Discounting estimates the present value of costs and health outcomes that are spent or received in the future, given that they are worth more today than they would be tomorrow.
*There is a 100% likelihood that these metrics are cost-saving.
What effect would the tax have on diabetes?
Economic studies indicate that with a sugary drink tax, consumers will buy less of these products.19 A $0.02/ounce tax will decrease the consumption of sugary drinks and this has other health implications that we can estimate. In California, the proposed sugary drink excise tax would lead to a 7% reduction in diabetes incidence over one year once the tax reaches full effect. We calculated this impact on diabetes incidence using projected declines in sugary drink consumption, not directly via microsimulation.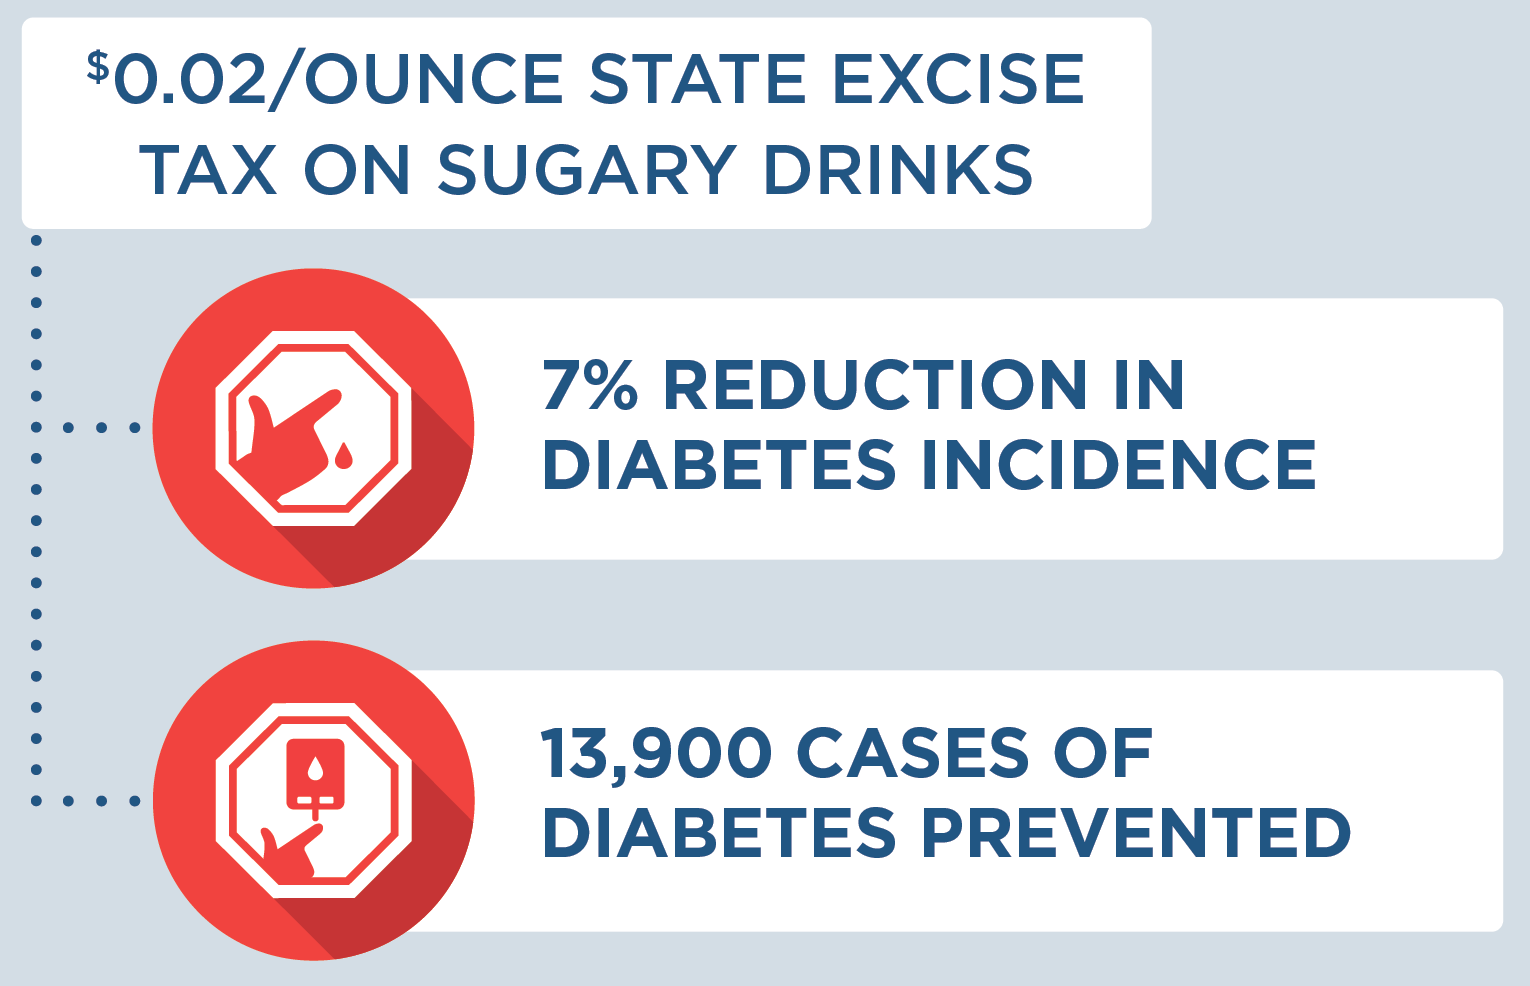
What effect would the tax have on tooth decay?
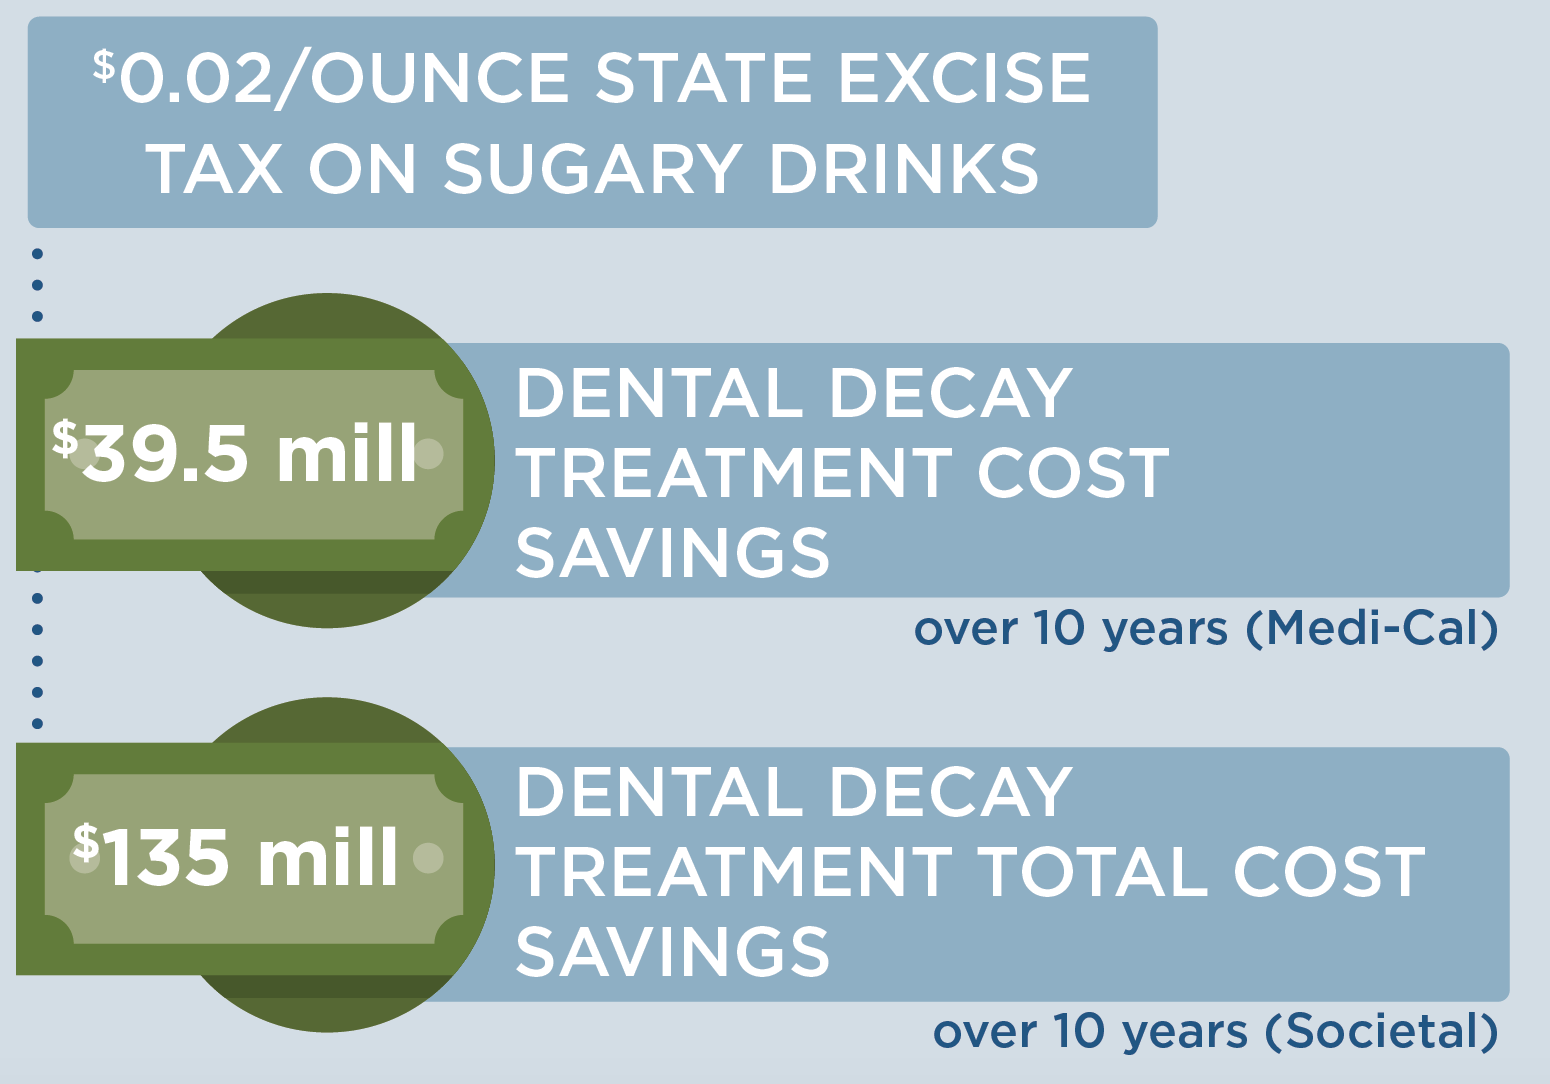
In California, we estimated that a $0.02/ounce tax would lead to a reduction of 502,000 decayed, missing, and filled teeth among Medi-Cal* recipients and $39.5 million in savings to Medi-Cal over 10 years due to a reduction in treatment of tooth decay. For the entire California population, we estimated the tax would lead to a reduction of 1,620,000 decayed, missing, and filled teeth and $135 million in savings for all payers due to a reduction in treatment of tooth decay. The Medi-Cal reimbursement tax estimates may underestimate the total cost savings of tooth decay treatment projected here as dental providers may charge higher amounts to patients. Impact on tooth decay was calculated using projected declines in sugary drink consumption, not directly via microsimulation.
*Medi-Cal is California’s Medicaid program
Key Considerations for Health Equity
Concerns have been raised regarding the impact of the tax on low-income households, because lower-income populations tend to consume more sugary drinks.20 Economic studies indicate that with a sugary drink tax, consumers will buy less of these products.19 This change in purchasing is substantial, so that consumers can be expected to spend less on sugary drinks after a tax is implemented. Using sales data from the Rudd Center Revenue Calculator for Sugary Drink Taxes,21 we project that individuals and households in California will spend less money on sugary drinks after a $0.02 per ounce tax: about $48 less per year per person, and $142 per year less for an average household. This would free up disposable income for other consumer purchases. A typical consumer in California who continues to consume these beverages after the tax is in place would be expected to pay tax of about $1.40 per week, or $73/year.
In addition to these changes in spending, health benefits are projected to be greatest among low-income individuals. We also project that greater health benefits will accrue among Latino and Black/African American California residents compared with White and Asian residents. Using data on sugary drink consumption in the CHOICES model, the average daily consumption of sugary drinks among people in California varies by race/ethnicity group (see pre-tax figures on pages 4 and 6). Under the proposed tax, we project that Black/African American Californians would see a 39% greater reduction in obesity prevalence than average, and Latino Californians would see a 33% greater reduction in obesity prevalence than average. On that basis, the proposed tax could decrease disparities in obesity outcomes and improve health equity.
These expected changes in consumption and health outcomes have led economists to conclude that low-income populations benefit substantially from sugary drink taxes.22
Implementation Considerations
A $0.02/ounce statewide excise tax on sugary drinks in California could raise as much as $1.3 to $1.8 billion in annual revenue.21 Revenue raised from a sugary drink tax could be reinvested in communities with low-income. For instance, in Berkeley, CA, revenue from a municipal sugary drink tax has been allocated for spending on school and community programs, many serving families with low-income or communities of color, to promote healthy eating, diabetes, and obesity prevention.23,24 Public support for such taxes generally increases with earmarking for preventive health activities.24
There is opposition from the food and beverage industry, which spends billions of dollars promoting their products.25 Relatively small beverage excise taxes are currently applied across many states. The proposed tax is likely to be sustainable if implemented based on the successful history of tobacco excise taxes. There is potential for a shift in social norms of sugary drink consumption based on evidence from tobacco control tax and regulatory efforts.26
Modeling Assumptions and Summary of the CHOICES Microsimulation Model
How does an excise tax on distributors affect the price paid by consumers?
An excise tax is incorporated directly into a beverage’s shelf price. We assume 100% pass-through of the tax over 10 years and assume the tax rate would be adjusted annually for inflation. Our pass-through rate estimate is supported by empirical studies of excise taxes in Mexico and France that demonstrate near-complete pass-through rates to consumers27 and consistent evidence in the U.S. indicating that beverage taxes increase prices, although there is some variation by store type.28-31
The expected change in sugary drink price was estimated based on national sugary drink prices32 and regional sales data for several categories of sugary drinks (i.e., soda, sports drinks, fruit drinks, energy drinks, sweetened teas, sweetened coffees, and enhanced water).21 In California, we assume the average price of sugary drinks is almost $0.09/ounce, so a $0.02/ounce tax would raise prices by 23%. This means that, for example, the price of a 12-ounce can of soda would increase from $1.06 to $1.30/can post-tax.
How does increasing the price of sugary drinks change individual sugary drink consumption?
How much consumers will change their purchases in response to price changes is called price elasticity for demand. We assume for every 10% increase in the price of sugary drinks, there will be a 12% reduction in purchases (a mean own-price elasticity of demand of -1.21).19 Recent research on the Berkeley, CA $0.01/ounce tax found a 21% reduction in sugary drink intake among populations with low-income consistent with this estimate.33-37 In California, we assume a $0.02/ounce tax that raises prices by 23% would reduce purchases by 27%. We assume this 27% reduction in purchases results in a 27% reduction in consumption.
To estimate current sugary drink consumption levels in California, we used national estimates of sugary drink consumption from NHANES 2011-2016 adjusted to race- and ethnicity-specific estimates of sugary drink consumption among children, teens, and adults from the California Health Interview Survey38 and estimates of sugary drink sales in California from the UConn Rudd Center for Food Policy & Obesity.21
What are the health effects of decreasing sugary drink consumption?
Research has shown that decreasing sugary drink consumption can have positive effects on health in youth and adults.
Assumptions about sugary drinks and obesity risk
We estimated the impact of a change in sugary drink intake on body mass index (BMI), accounting for dietary compensation, based on rigorous studies identified in evidence reviews.14 The relationship among adults was modeled based on the range of estimated effects from four large, multi-year longitudinal studies, which indicated that a one-serving reduction in sugary drinks was associated with a BMI decrease of 0.21 kg/m2 to 0.57 kg/m2 in adults over a 3-year period.39-42 Among youth, we used evidence from a double-blind randomized controlled trial conducted over 18 months, which found that an additional 8-ounce serving of sugary drinks led to a 2.2 pound greater weight gain.43
Assumptions about sugary drinks and diabetes risk
We estimated the impact of the tax-induced reduction in sugary drink intake on diabetes incidence for adults ages 18-79 years using a published meta-analysis of the relative risk of developing diabetes due to a one-serving change in sugary drink consumption44 as well as state-level estimates of diabetes incidence from the CDC Atlas 201645 and prevalence from the California Health Interview Survey 2017-2018.46 On average, each 8.5-ounce serving of sugary drinks per day increases the risk of diabetes by 18%.44
Assumptions about sugary drinks and tooth decay
We estimated the impact of a sugary drink excise tax on tooth decay and tooth decay treatment costs using a longitudinal analysis of the relationship between intake of sugars and tooth decay in adults. On average, for every 10 grams higher intake of sugar per day, there is an increase in decayed, missing and filled teeth (i.e., tooth decay) of approximately 0.10 over 10 years.47 There are many studies showing a similar relationship between higher intake of sugars and tooth decay in children and youth48 and thus we assume the same relationship as found in adults. We used the Medi-Cal Dental Provider Handbook 201949 to estimate a Medi-Cal cost of treating tooth decay as: $278 for a permanent crown and $58 for a filling. These codes reflect treatment for one to four surfaces but do not reflect the actual frequency of multi-surface treatment among Medi-Cal recipients or for higher reimbursement rates due to temporary crowns or potential flat tax schedules. Based on analysis of data on tooth decay, fillings and crowns for the U.S. population from NHANES 1988-1994 (the last year crowns and fillings were separately reported),50 we estimate that 78.9% of tooth decay in children and 43.5% of tooth decay in adults is treated. Using this same data set, we estimate that 97% of treatment for children is fillings and 82.5% of treatment for adults is fillings. To estimate Medi-Cal-specific savings in costs of dental treatment, we used estimates of the number of people enrolled in the Medi-Cal Dental Program in 2018.51
CHOICES Microsimulation Model
The CHOICES microsimulation model was used to calculate the costs and effectiveness of a tax in California over 10 years (2020-2030). We forecasted what would happen to a virtual population of residents in California with and without a sugary drink tax to model changes in disease and mortality rates and health care costs due to the tax. Cases of obesity prevented were calculated at the end of the model period in 2030. The model was based on peer-reviewed CHOICES methodology.14,52-54 We created a virtual population of residents in California using data from: the U.S. Census, American Community Survey, Behavioral Risk Factor Surveillance System, NHANES, National Survey of Children’s Health,52 the Medical Expenditure Panel Survey, multiple national longitudinal studies, and obesity prevalence data provided by California Department of Public Health. Impacts on diabetes, tooth decay, Medicaid spending, and household spending on sugary drinks were calculated based on summary results from the model, not directly via microsimulation.
Of note, the CHOICES microsimulation model does not include annual revenue generation from a state excise tax on sugary drinks in any of the cost-effectiveness calculations. The Rudd Center Revenue Calculator for Sugary Drink Taxes estimates potential annual revenues from excise taxes on sugary drinks and is “intended to provide a rough estimate” for municipalities to consider.21 According to the Rudd Center,21 a $0.02/ounce excise tax in California could raise as much as $1.8 billion in 2020. Accounting for 10-30% non-compliance as the Rudd Center advises, annual revenue estimates range between $1.3 – $1.8 billion.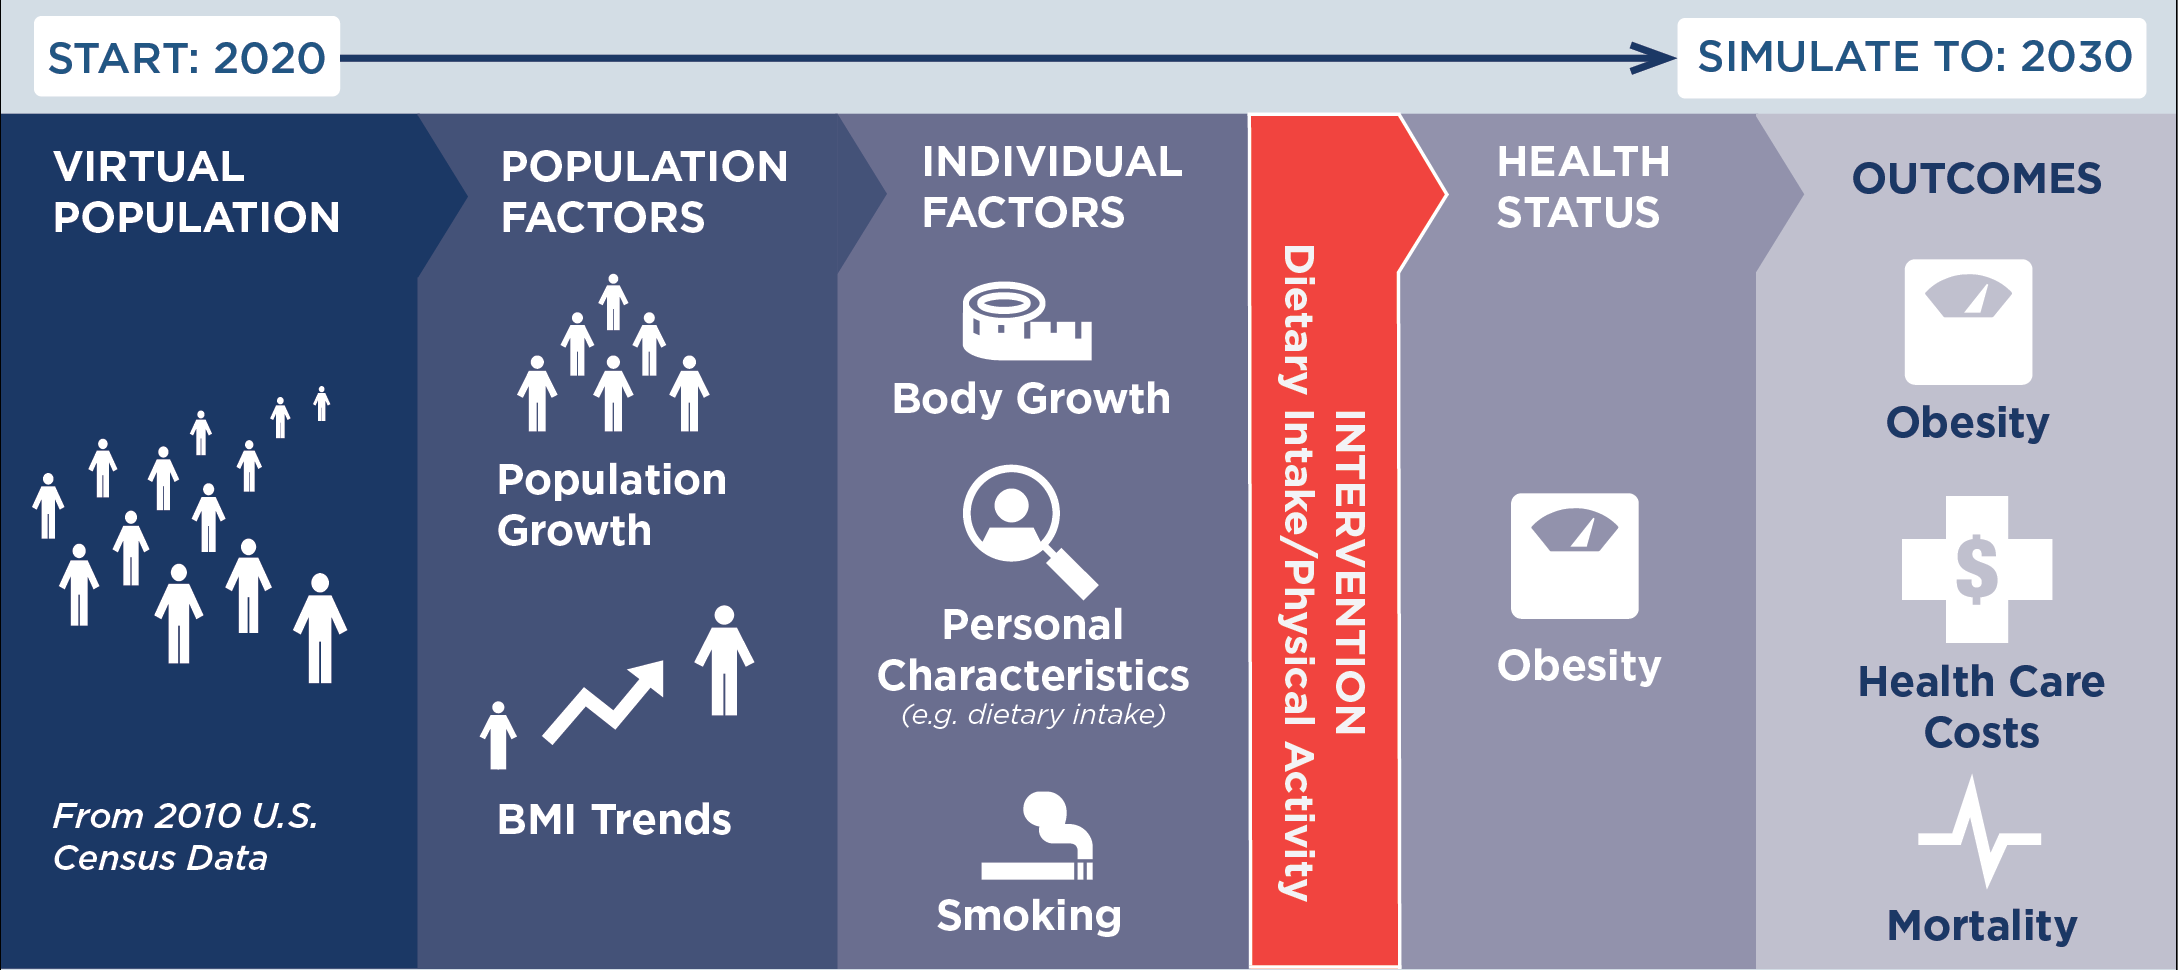
Citation
Gouck J, Whetstone L, Walter C, Pugliese J, Kurtz C, Seavey-Hultquist J, Barrett J, McCulloch S, Reiner J, Garrone M, Cradock A, Gortmaker, S. California: A Sugary Drink Excise Tax. California Department of Public Health, Sacramento, CA, the County of Santa Clara Public Health Department, San Jose, CA, and the CHOICES Learning Collaborative Partnership at the Harvard T.H. Chan School of Public Health, Boston, MA; March 2021. For more information, please visit www.choicesproject.org
The design for this brief and its graphics were developed by Molly Garrone, MA and partners at Burness.
Funding
This work is supported by The JPB Foundation and the Centers for Disease Control and Prevention (U48DP006376). The findings and conclusions are those of the author(s) and do not necessarily represent the official position of the Centers for Disease Control and Prevention or other funders.
For further information, contact choicesproject@hsph.harvard.edu
References
- American Public Health Association Taxes on Sugar-Sweetened Beverages. 2012.
- Falbe J, Rojas N, Grummon AH, Madsen KA. Higher Retail Prices of Sugar-Sweetened Beverages 3 Months After Implementation of an Excise Tax in Berkeley, California. American Journal of Public Health. 2015;105(11):2194-2201.
- World Health Organization. Global action plan for the prevention and control of noncommunicable diseases 2013–2020 [Internet]. Geneva: WHO. Updated appendix 3, “Best buys” and other recommended interventions for the prevention and control of noncommunicable diseases; [updated 2017; cited 2019 Sep 17]. Available from: http://www.who.int/ncds/management/WHO_Appendix_BestBuys.pdf
- Hart A. New coalition calls for statewide soda tax in California. Politico. July 17, 2019. Accessed October 15, 2020 at: https://www.politico.com/states/california/story/2019/07/17/new-coalition-calls-for-statewide-soda-tax-in-california-1104414
- National Academies of Sciences, Engineering, and Medicine; Health and Medicine Division; Board on Population Health and Public Health Practice; Committee on Community-Based Solutions to Promote Health Equity in the United States; Baciu A, Negussie Y, Geller A, et al., editors. Communities in Action: Pathways to Health Equity. Washington (DC): National Academies Press (US); 2017 Jan 11. 3, The Root Causes of Health Inequity. Available from: https://www.ncbi.nlm.nih.gov/books/NBK425845
- U.S. Dept of Health and Human Services & U.S. Dept of Agriculture, 2015-2020 Dietary Guidelines for Americans, 8th Edition, 2015.
- UCLA Center for Health Policy Research. AskCHIS. 2017 Health Interview Survey. Available at: https://ask.chis.ucla.edu
- Harris JL, Fleming-Milici F, Kibwana-Jaff A, Phaneuf L. Sugary Drink FACTS 2020: Sugary drink advertising to youth: Continued barrier to public health progress. UConn Rudd Center for Food Policy & Obesity, June 2020. Accessed January 7, 2021 at http://sugarydrinkfacts.org/resources/Sugary%20Drink%20FACTS%202020/Sugary_Drink_FACTS_Full%20Report_final.pdf
- Malik VS, Pan A, Willett WC, Hu FB. Sugar-sweetened beverages and weight gain in children and adults: a systematic review and meta-analysis. American Journal of Clinical Nutrition. 2013;98(4):1084-1102. 16.
- Chen L, Caballero B, Mitchell DC, et al. Reducing Consumption of Sugar-Sweetened Beverages Is Associated with Reduced Blood Pressure: A Prospective Study among U.S. Adults. Circulation. 2010;121(22):2398-2406.
- Ward ZJ, Bleich SN, Cradock AL, Barrett JL, Giles CM, Flax CN, Long MW, Gortmaker SL. Projected U.S. State-Level Prevalence of Adult Obesity and Severe Obesity. New England Journal of Medicine. 2019;381:2440-50. doi: 10.1056/NEJMsa1909301.
- California Department of Public Health, analysis of 2017 FitnessGram data provided by the California Department of Education.
- California Department of Tax and Fee Administration, personal communication to the California Department of Public Health, March 6, 2020.
- Gortmaker SL, Wang YC, Long MW, et al. Three Interventions That Reduce Childhood Obesity Are Projected To Save More Than They Cost To Implement. Health Affairs. 2015;34(11):1932-1939.
- Wang YC, Pamplin J, Long MW, Ward ZJ, Gortmaker SL, Andreyeva T. Severe Obesity In Adults Cost State Medicaid Programs Nearly $8 Billion In 2013. Health Affairs (Millwood). 2015 Nov;34(11):1923-31.
- Trogdon JG, Finkelstein EA, Feagan CW, Cohen JW. State- and payer-specific estimates of annual medical expenditures attributable to obesity. Obesity (Silver Spring). 2012 Jan;20(1):214-20.
- California Health Care Foundation. California Health Care Almanac, Medi-Cal Facts and Figures: Crucial Coverage for Low-Income Californians, February 2019. Accessed October 22, 2020 at: https://www.chcf.org/wp-content/uploads/2019/02/MediCalFactsFiguresAlmanac2019.pdf
- Lassman D, Hartman M, Washington B, Andrews K, Catlin A. US health spending trends by age and gender: selected years 2002-10. Health Affairs (Millwood). 2014 May;33(5):815-22.
- Powell LM, Chriqui JF, Khan T, Wada R, Chaloupka FJ. Assessing the Potential Effectiveness of Food and Beverage Taxes and Subsidies for Improving Public Health: A Systematic Review of Prices, Demand and Body Weight Outcomes. Obesity Reviews. 2013;14(2):110-128.
- Han E, Powell LM. Consumption patterns of sugar-sweetened beverages in the United States. Journal of the Academy of Nutrition and Dietetics. 2013;113(1):43-53.
- UConn Rudd Center for Food Policy & Obesity. Sugary Drink Tax Calculator. https://uconnruddcenter.org/tax-calculator. Accessed February 2021.
- Allcott H, Lockwood BB, Taubinsky D. Should We Tax Sugar-Sweetened Beverages? An Overview of Theory and Evidence. Journal of Economic Perspectives. 2019; 33 no 3: 202–27.
- Lynn J. City Council votes to allocate ‘soda tax’ revenue to school district, city organizations. The Daily Californian. Jan. 20, 2016; 2016.
- Berkeley City Council. (2016, June 14). Berkeley City Council meeting. [Annotated Agenda]. Retrieved from https://www.cityofberkeley.info/Clerk/City_Council/2016/06_June/City_Council__06-14-2016_-_Meeting_Info.aspx
- Federal Trade Commission. A review of food marketing to children and adolescents: follow-up report. Washington, DC; Dec 2012.
- Frieden TR, Mostashari F, Kerker BD, Miller N, Hajat A, Frankel M. Adult tobacco use levels after intensive tobacco control measures: New York City, 2002-2003. American Journal of Public Health. 2005;95(6):1016-1023
- Colchero MA, Salgado JC, Unar-Munguia M, Molina M, Ng SW, Rivera-Dommarco JA. Changes in Prices After an Excise Tax to Sweetened Sugar Beverages Was Implemented in Mexico: Evidence from Urban Areas. PLoS One. 2015;10(12):11.
- Cawley J, Frisvold D, Hill A, Jones D. The Impact of the Philadelphia Beverage Tax on Prices and Product Availability. NBER Working Paper. 2018(24990).
- Bleich SN, Lawman HG, LeVasseur MT, et al. The association of a sweetened beverage tax with changes in beverage prices and purchases at independent stores. Health Affairs (Millwood). 2020;39(7):1130-1139.
- Marinello S, Pipito AA, Leider J, Pugach O, Powell LM. The impact of the Oakland sugar-sweetened beverage tax on bottled soda and fountain drink prices in fast-food restaurants. Preventive Medicine Reports. 2020;17:101034.
- Ng S, Silver L, Ryan-Ibarra S, et al. Berkeley Evaluation of Soda Tax (BEST) Study Preliminary Findings. Presentation at the annual meeting of the American Public Health Association. Paper presented at: Presentation at the annual meeting of the American Public Health Association; November, 2015; Chicago, IL.
- Powell L, Isgor z, Rimkus L, Chaloupka F. Sugar-sweetened beverage prices: Estimates from a national sample of food outlets. Chicago, IL: Bridging the Gap Program, Health Policy Center, Institute for Health Research and Policy, University of Illinois at Chicago; 2014.
- Falbe J, Thompson HR, Becker CM, Rojas N, McCulloch CE, Madsen KA. Impact of the Berkeley Excise Tax on Sugar-Sweetened Beverage Consumption. American Journal of Public Health. 2016;106(10):1865-1871.
- Cawley J, Frisvold D, Hill A, Jones D. The impact of the Philadelphia beverage tax on purchases and consumption by adults and children. Journal of Health Economics. 2019;67:102225.
- Lee MM, Falbe J, Schillinger D, Basu S, McCulloch CE, Madsen KA. Sugar-Sweetened Beverage Consumption 3 Years After the Berkeley, California, Sugar-Sweetened Beverage Tax. American Journal of Public Health. 2019;109(4):637-639.
- Zhong Y, Auchincloss AH, Lee BK, Kanter GP. The Short-Term Impacts of the Philadelphia Beverage Tax on Beverage Consumption. American Journal of Preventive Medicine. 2018;55(1):26-34.
- Silver LD, Ng SW, Ryan-Ibarra S, et al. Changes in prices, sales, consumer spending, and beverage consumption one year after a tax on sugar-sweetened beverages in Berkeley, California, US: A before-and-after study. PLoS Medicine. 2017;14(4):e1002283
- 2011-2017 California Health Interview Survey data, analysis by the Harvard T.H. Chan School of Public Health, data provided by the UCLA Center for Health Policy Research, available at: http://healthpolicy.ucla.edu/chis/Pages/default.aspx
- Chen L, Caballero B, Mitchell DC, et al. Reducing Consumption of Sugar-Sweetened Beverages Is Associated with Reduced Blood Pressure: A Prospective Study among U.S. Adults. Circulation. 2010;121(22):2398-2406.
- Mozaffarian D, Hao T, Rimm EB, Willett WC, Hu FB. Changes in Diet and Lifestyle and Long-Term Weight Gain in Women and Men. New England Journal of Medicine. 2011;364(25):2392-2404.
- Palmer JR, Boggs DA, Krishnan S, Hu FB, Singer M, Rosenberg L. Sugar-Sweetened Beverages and Incidence of Type 2 Diabetes Mellitus in African American Women. Archives of Internal Medicine. 2008;168(14):1487-1492.
- Schulze MB, Manson JE, Ludwig DS, et al. Sugar-sweetened beverages, weight gain, and incidence of type 2 diabetes in young and middle-aged women. Journal of the American Medical Association. 2004;292(8):927-934.
- de Ruyter JC, Olthof MR, Seidell JC, Katan MB. A trial of sugar-free or sugar-sweetened beverages and body weight in children. New England Journal of Medicine. 2012;367(15):1397-1406.
- Imamura F, O’Connor L, Ye Z, et al. Consumption of sugar sweetened beverages, artificially sweetened beverages, and fruit juice and incidence of type 2 diabetes: systematic review, meta-analysis, and estimation of population attributable fraction. British Journal of Sports Medicine. 2016;50(8):496-U484.
- Centers for Disease Control and Prevention. Diabetes Atlas. Accessed 10/21/20 at: https://gis.cdc.gov/grasp/diabetes/DiabetesAtlas.html#
- 2017-2018 California Health Interview Survey data, analysis by the Harvard T.H. Chan School of Public Health, data provided by the UCLA Center for Health Policy Research, available at: http://healthpolicy.ucla.edu/chis/Pages/default.aspx
- Bernabe E, Vehkalahti MM, Sheiham A, Lundqvist A, Suominen AL. The Shape of the Dose-Response Relationship between Sugars and Caries in Adults. Journal of Dental Research. 2016;95(2):167-172.
- Sheiham A, James WPT. A new understanding of the relationship between sugars, dental caries and fluoride use: implications for limits on sugars consumption. Public Health Nutrition. 2014;17(10):2176-2184.
- California Department of Health Care Services, Medi-Cal Dental Provider Handbook 2019. Accessed October 19, 2020 at: https://dental.dhcs.ca.gov/Dental_Providers/Denti-Cal/Provider_Handbook
- Ward Z, et al. NHANES III Dental Examination: An Incisive Report. unpublished report; 2018.
- California Department of Health Care Services, Multi Year Medi-Cal Dental Measures Data by Age Groups Calendar Year 2013 to 2018. Accessed October 19, 2020 at: https://data.chhs.ca.gov/dataset/test-dhcs-multi-year-dental-measures-data-by-age-groups-calendar-year-2013-to-2015
- Ward ZJ, Long MW, Resch SC, Giles CM, Cradock AL, Gortmaker SL. Simulation of Growth Trajectories of Childhood Obesity into Adulthood. New England Journal of Medicine. 2017;377(22):2145-2153.
- Ward ZJ, Long MW, Resch SC, et al. Redrawing the US Obesity Landscape: Bias-Corrected Estimates of State-Specific Adult Obesity Prevalence. PLoS One. 2016;11(3):13.
- Long MW, Ward Z, Resch SC, et al. State-level estimates of childhood obesity prevalence in the United States corrected for report bias. International Journal of Obesity. 2016;40(10):1523-1528.